Understanding Irrigation Water Optimization
Introduction
Irrigation is applied to much of the crop ground area of Utah to support production. Limited water and competing demands make irrigation water conservation, efficiency, or optimization important components of overall water resource management. It is well known in Utah that optimal irrigation use is even more critical during drought conditions. However, optimization practices change the quantity, quality, and timing of water flows. It is important to consider the possible hydrologic impacts of irrigation optimization efforts to avoid implementing practices that have little appreciable effect relative to the desired outcome. Examples of desired outcomes include increasing supply reliability/sustainability, adequately serving irrigation company shareholders, preserving or restoring downstream ecosystems, and providing water to downstream users. Not all irrigation optimization practices will provide a given desired outcome.
The Hydrologic Cycle
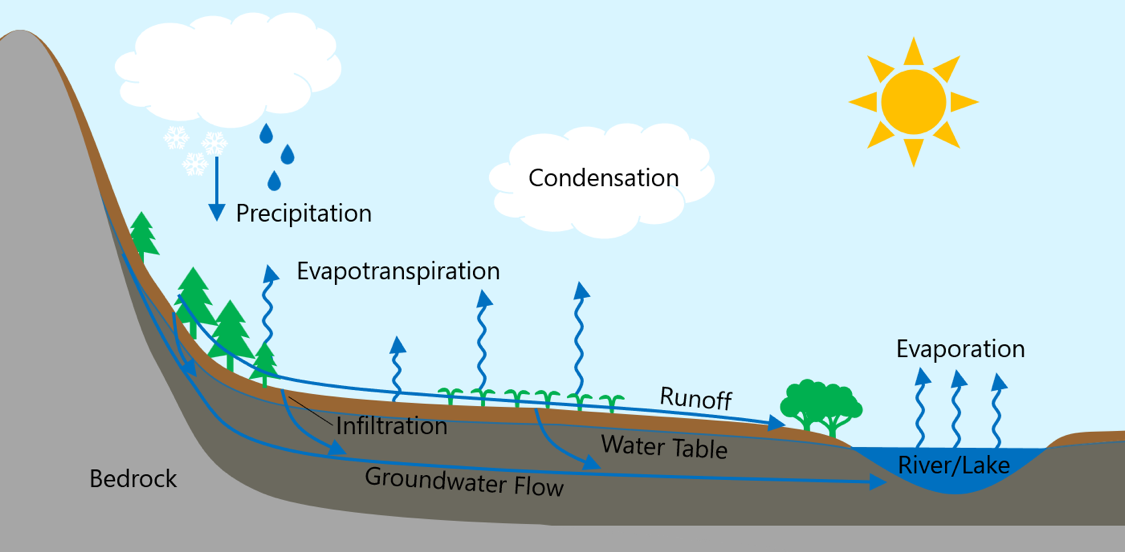
When considering the impact of changing irrigation practices, it is helpful to understand the basic hydrologic cycle, also called the water cycle (Figure 1). Water enters a hydrologic basin as precipitation. Precipitation may be intercepted by vegetation, infiltrate into the soil, pond on the land surface, or run off the land. Intercepted water will eventually evaporate off the vegetation. Water that infiltrates into the soil may be extracted and transpired by plants, evaporate from the land surface, or continue to seep downward and become groundwater. Runoff may infiltrate into the soil, pond elsewhere, or enter a stream, river, lake, or sea. Some water within water bodies will evaporate and some will seep into the ground, becoming groundwater. The combined evaporation and transpiration of water is called evapotranspiration (ET). This water vapor may be carried out of the basin by the wind or condensed into clouds, which may precipitate near where the water vapor originated.
What Are Water Conservation and Optimization?
Water conservation may be defined as a reduction in water use. But what is meant by water use? One way to consider water use is in terms of the quantity of water diverted or withdrawn from a stream, reservoir, or well. Another way to consider water use is in terms of consumptive use. Consumptive use is typically any evapotranspiration from diverted water because this water leaves the hydrologic system. Water significantly degraded in quality or transferred outside of a hydrologic basin may also be considered consumptive use.
Water conservation typically involves reducing water use. Water optimization may also include reducing water use but also includes making water use more productive.
The term optimization is used in this fact sheet instead of conservation. This is because water conservation typically refers to a reduction in either diversion or consumptive use, while water optimization may have a much broader meaning, including more productive water uses.
It is common to discuss water “losses.” However, that term can be ambiguous. For example, is water “lost” if it is available to other users? In this fact sheet, “loss” means any diverted water that does not directly satisfy the crop’s needs. Using this definition, some losses are consumptive, while some are not and may be available for other uses.
Illustrative Examples
The impact on the hydrologic cycle of some water optimization practices commonly considered in Utah is demonstrated below using the following six hypothetical scenarios.
- Scenario 1 – Surface irrigation with an unlined supply canal.
- Scenario 2 – Surface irrigation with a lined canal supply.
- Scenario 3 – Wheel line with a piped water supply.
- Scenario 4a – Surface pivot with a piped water supply; and Scenario 4b – Surface pivot with a groundwater supply.
- Scenario 5 – Center pivot irrigation with expanded irrigated land (water spreading).
- Scenario 6 – Transbasin diversions.
For all examples, ET and evaporation estimates are from Hill et al. (2011). Some additional assumptions are made for water losses in the field and conveyance losses from the supply system (Table 1).
Scenario 1 Case Parameters
| Location: | Central Utah |
| Water source: | Reservoir |
| Field size: | 100 acres |
| Crop: | Alfalfa |
| Conveyance: | 1 mile, 6-foot wide, earthen canal with 6 feet of vegetation on each bank |
| Irrigation method: |
Surface (border) |
| Crop net ET: |
242 AFY |
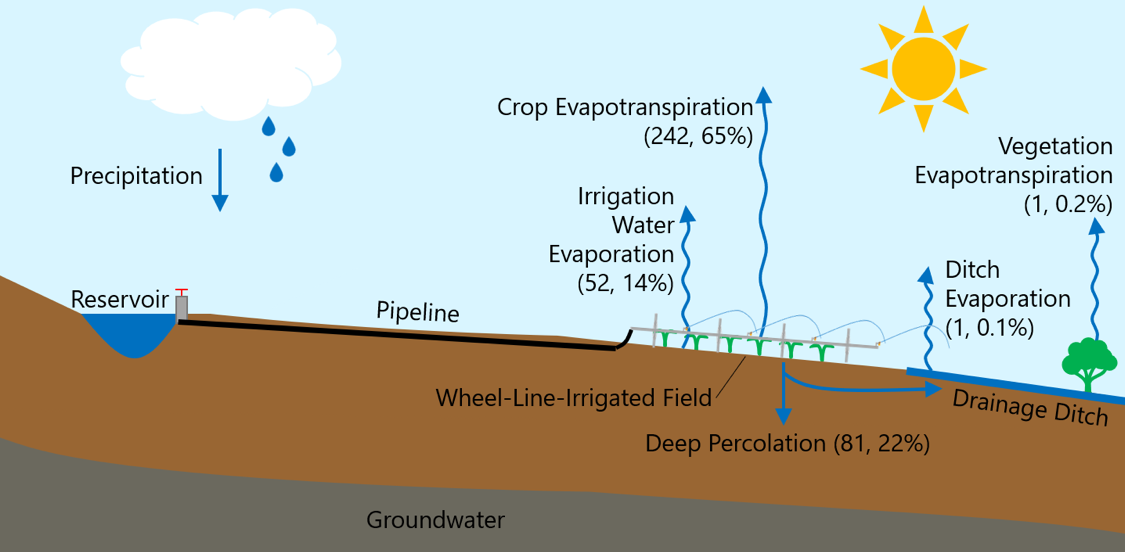
Scenario 1 – Surface Irrigation With an Unlined Supply Canal
Consider a simple situation, detailed at in the Scenario 1 Case Parameters box. Water is released from a reservoir into a canal and conveyed to a single, surface-irrigated field (Figure 2). Results are listed in Table 1 and described below.
- The total diversion from the reservoir is 628 acre-feet per year (AFY).
- 256 AFY (40% of diversion) is lost before reaching the field (conveyance losses).
- 192 AFY (75% of the conveyance loss) is seepage.
- Canal bank vegetation net ET (ET minus beneficial precipitation) from seepage is 1 AFY for a 6-foot width of vegetation on each bank.
- Operational spill (water released from the canal without going to a field) is unavoidable in many canals. Here, the operational spill is 10% of the diversion, or 63 AFY.
- Net evaporation (evaporation minus precipitation) from the canal is 2 AFY.
- 372 AFY (59%) of the diverted water reaches the field (applied water).
- 130 AFY of the applied water is lost (application losses).
- 114 AFY of the application loss is drainage (deep percolation).
- 13 AFY of the application loss is runoff from the field. This is collected in a drain and returns to the source downstream of the original diversion.
- 3 AFY of the application losses is evaporation from the water on the field during irrigation.
- The remaining 242 AFY (65% of applied water) is stored in the plant root zone and available for crop ET. This 242 AFY is 29 inches per year of net ET.
- A portion of the conveyance and application losses ends up in drainage ditches (137 AFY).
- There is 2 AFY of evaporation from drain ditch flows.
- There is 3 AFY of ET from vegetation on the drain ditch banks derived from the drain water.
- The total loss in the system is 628 AFY - 242 AFY = 386 AFY (61% of the diversion). Only a small fraction of the total loss (11 AFY) is consumptive use.
- Total consumptive use (crop net ET plus other consumptive use) is 253 AFY.
- 375 AFY of diverted water is seepage, deep percolation, or tailwater that remains part of the hydrologic system (return flows).
- Return flows may be available for downstream uses like diversions, environmental flows, or groundwater pumping. Downstream water rights may depend upon return flows.
- Return flows may be available for downstream use like diversions, environmental flows, or groundwater pumping. Downstream water rights may depend upon return flows.
- In Scenario 1, reservoir storage is reduced by 628 AFY, but the basin has only 253 AFY of consumptive use.
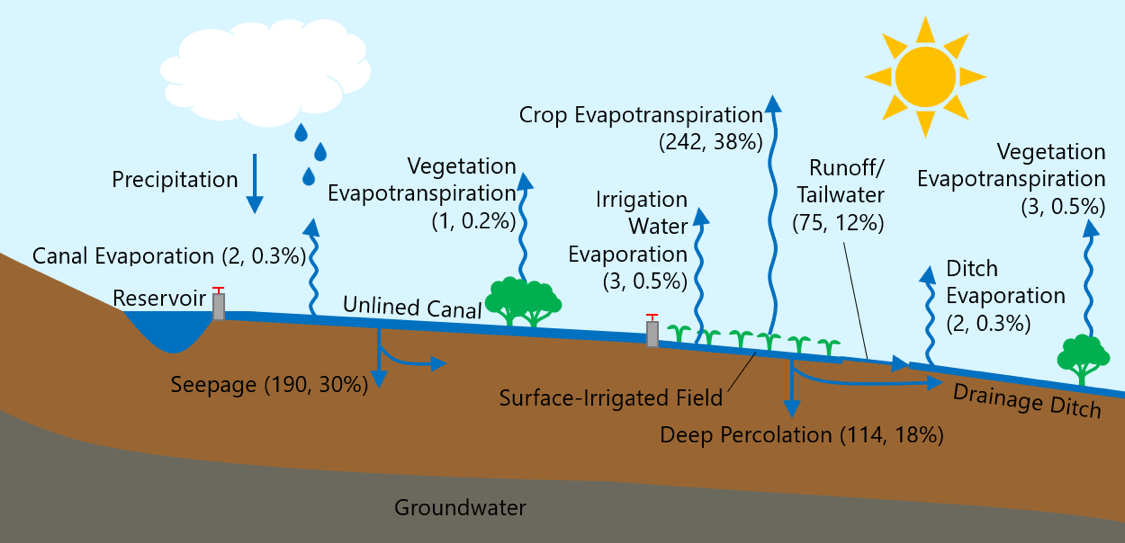
Note. Parenthetical values are water volume in acre-feet per year followed by percentages of total diversion.
Scenario 2 Case Parameters
| Location: | Central Utah |
| Water source: | Reservoir |
| Field size: | 100 acres |
| Crop: | Alfalfa |
| Conveyance: | 1 mile, 6-foot wide, lined canal with no bank vegetation |
| Irrigation method: |
Surface (border) |
| Crop net ET: |
242 AFY |
| Diversion quantity: |
440 AFY |
Scenario 2 – Surface Irrigation With a Lined Canal Supply
Now, consider the system from Scenario 1 but the canal is lined, reducing seepage to 5% of diverted flow and eliminating canal bank net ET (Figure 3).
- The total diversion from the reservoir is 440 AFY, 188 AFY less than Scenario 1.
- Conveyance losses are down 188 AFY from Scenario 1 to 68 AFY, of which 2 AFY is consumptive use.
- Application losses are unchanged from Scenario 1.
- Crop net ET is still 242 AFY (65% of applied water).
- Drain water is decreased to 74 AFY because of the reduced seepage. 3 AFY of the drain water is evaporation and ET.
- The total loss in the system is 440 AFY - 242 AFY = 198 AFY (45% of the diversion, compared to 61% in Scenario 1). Only a small fraction of the losses (8 AFY) is consumptive use.
- Total consumptive use (crop net ET plus other consumptive use) is 250 AFY, only 3 AFY less than Scenario 1.
- Return flow is reduced to 189 AFY.
- In the end, canal lining reduced reservoir releases by 172 AFY, but from the perspective of the hydrologic basin, consumptive use was only reduced by 3 AFY.
- Only the 3 AFY additional water would be made available for other potential uses over Scenario 1. This may not warrant the expense of lining in this hypothetical scenario.
- The water left in storage could make the water supply more secure, especially in a water-limited year.
- Any change in diversion or return flows either in quantity or timing could impact downstream water users (either positively or negatively).
- The decreased seepage could impact local groundwater withdrawals.
- Agricultural return flows are often degraded in quality compared to the source water. Therefore, there could be a water quality benefit to reducing diversion even if consumptive use does not decrease.
- There may be economic benefits of lining to the grower if water costs are tied to the volume diverted.
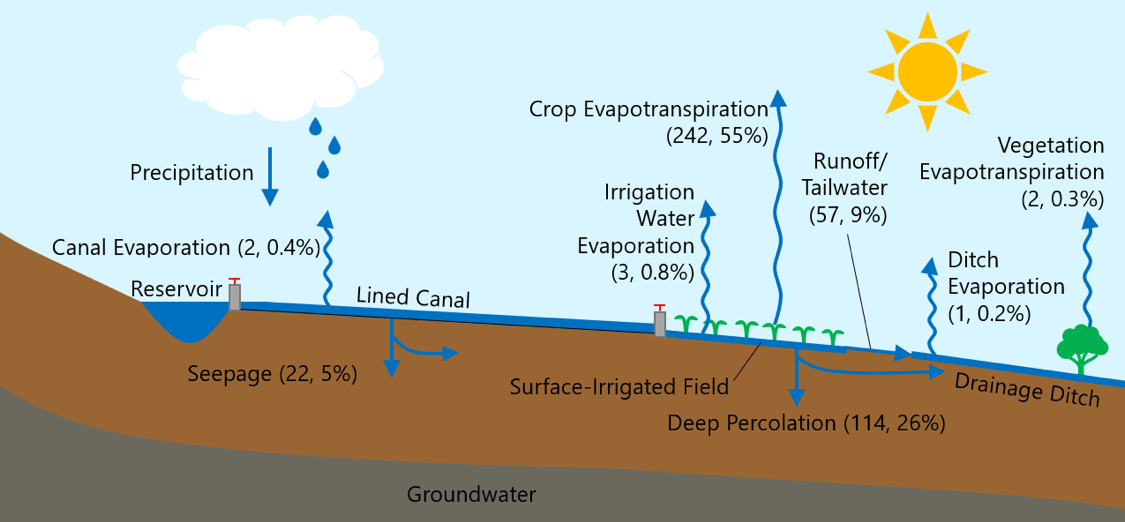
Note. Parenthetical values are water volume in acre-feet per year followed by percentages of total diversion.
Scenario 3 Case Parameters
| Location: | Central Utah |
| Water source: | Reservoir |
| Field size: | 100 acres |
| Crop: | Alfalfa |
| Conveyance: | 1 mile pipeline without leaks |
| Irrigation method: |
Wheel line |
| Crop net ET: |
242 AFY |
| Diversion quantity: |
375 AFY |
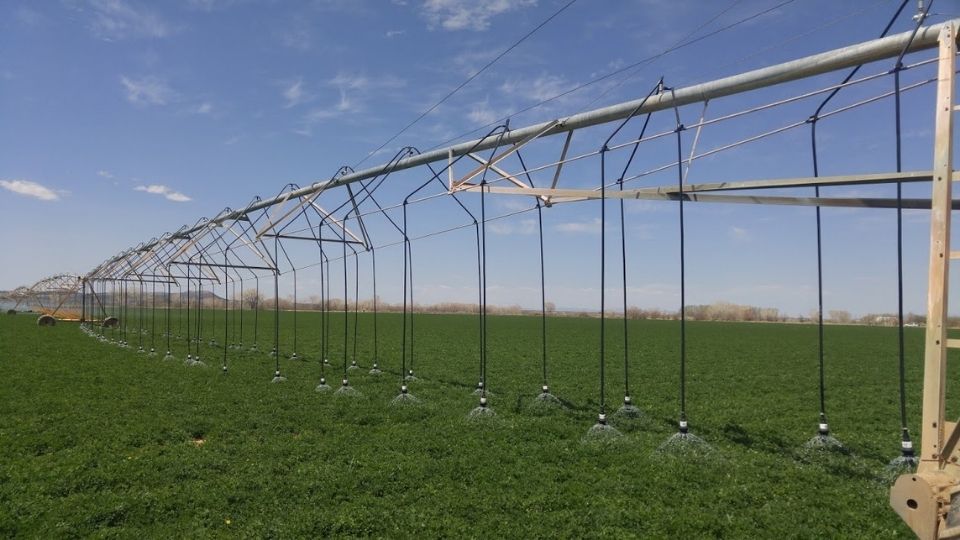
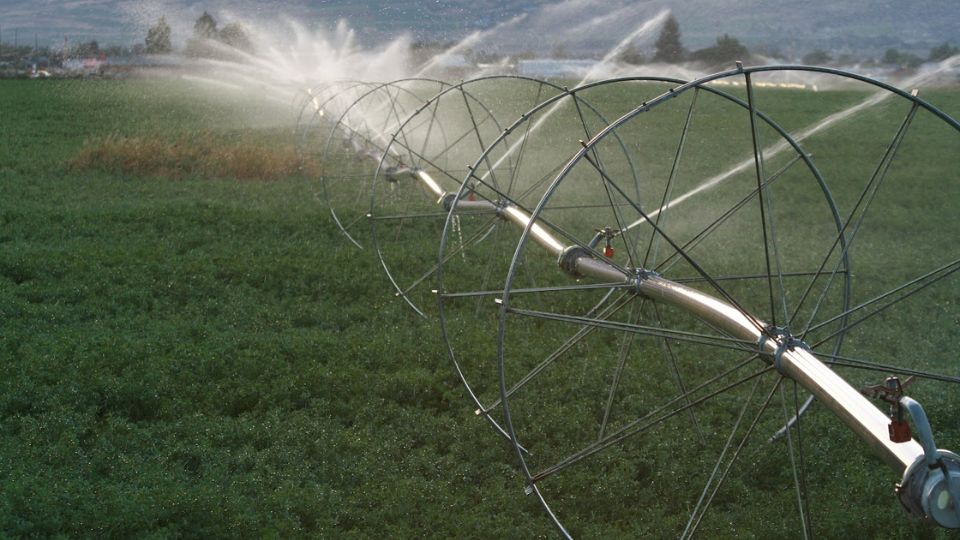
Scenario 3 – Wheel Line With a Piped Water Supply
Consider Scenario 1, but the canal is piped, eliminating all conveyance losses, and the field is irrigated with wheel-line sprinkler systems (Figure 4).
- The total diversion from the reservoir is 375 AFY, 253 AFY less than Scenario 1.
- Conveyance losses are zero.
- Application losses increase slightly to 133 AFY.
- Deep percolation is reduced to 81 AFY.
- Runoff from the wheel lines is zero.
- There is 52 AFY (14% of applied water) of wind loss and evaporation compared to 3 AFY for the first two scenarios.
- Crop net ET remains at 242 AFY.
- Total drain water is decreased to 16 AFY, of which 2 AFY is evaporation and ET.
- The total loss in the system is 375 AFY - 242 AFY = 133 AFY (35% of the diversion, compared to 61% in Scenario 1). However, 54 AFY of the total loss is consumptive use, compared to 11 AFY for Scenario 1.
- Total consumptive use (crop net ET plus other consumptive use) is 296 AFY.
- Return flow is reduced to 79 AFY.
- In the end, piping and using wheel lines reduced reservoir releases by 253 AFY over Scenario 1, but from the perspective of the hydrologic basin, consumptive use increased by 43 AFY.
- For the grower, wheel-line irrigation may require less labor than surface irrigation. However, wheel lines often require energy for pumping.
- Greater crop uniformity and less crop stress may be attainable with wheel lines than with surface irrigation, which may improve yields, though this may also result in greater ET (not considered in this example).
- The decrease in return flows could impact the timing of water in the river system. This could impact downstream surface water users (either positively or negatively).
- The decreased return flows could reduce local groundwater supplies.
Note. Parenthetical values are water volume in acre-feet per year followed by percentages of total diversion.
Scenario 4a Case Parameters
| Location: | Central Utah |
| Water source: | Reservoir |
| Field size: | 100 acres |
| Crop: | Alfalfa |
| Conveyance: | 1 mile pipeline without leaks |
| Irrigation method: |
Center pivot |
| Crop net ET: |
242 AFY |
| Diversion quantity: |
316 AFY |
Scenario 4a – Center Pivot With a Piped Water Supply
This Scenario follows Scenario 3, but the field is irrigated using a center pivot instead of wheel lines (Figure 5).
- The total diversion from the reservoir is 316 AFY, 312 AFY less than Scenario 1, and 59 AFY less than Scenario 3.
- Application losses decrease to 74 AFY.
- Deep percolation is 39 AFY because pivots typically have better application uniformity than wheel lines.
- Runoff is zero.
- Wind and evaporation loss is 35 AFY, being generally less for center pivots than for wheel lines.
- Crop net ET remains at 242 AFY.
- Total drain water is decreased to 16 AFY, of which 1 AFY is evaporation and ET.
- The total loss in the system is 316 AFY - 242 AFY = 74 AFY (23% of the diversion, less than the first three scenarios).
- 36 AFY of the total loss is consumptive use, compared to 11 AFY for Scenario 1 and 79 AFY for Scenario 3.
- Total consumptive use (crop net ET plus other consumptive use) is 278 AFY.
- Return flow is reduced to 38 AFY.
- In the end, piping and using a center pivot reduced reservoir releases by 312 AFY over Scenario 1 and 59 AFY over Scenario 3. From the perspective of the hydrologic basin, consumptive use increased by 25 AFY over Scenario 1, while it decreased by 18 AFY over Scenario 3.
- For the grower, center pivot irrigation requires less labor than the previous scenarios.
- Center pivots also require pumping energy, but this may be less than for wheel-line irrigation.
- Often, greater crop uniformity and less crop stress are attainable with center pivots than surface irrigation or wheel-line irrigation. This uniformity may improve yields, which may result in greater crop ET (not considered in this example).
- Like Scenario 3, the decrease in return flows could impact the timing of water in the river system. This could impact downstream water users either positively or negatively.
- The decreased return flows could reduce local groundwater supplies, which may rely on the recharge provided by the unlined canal and surface irrigation system.
- The water quality discussion from Scenario 2 is again applicable.
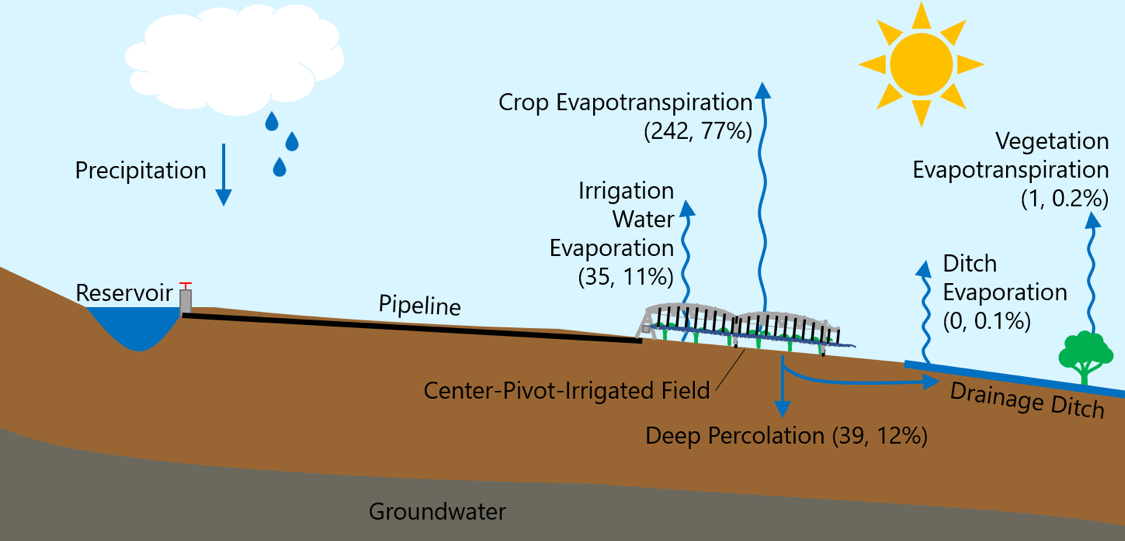
Note. Parenthetical values are water volume in acre-feet per year followed by percentages of total diversion.
Scenario 4b Case Parameters
| Location: | Central Utah |
| Water source: | Reservoir |
| Field size: | 100 acres |
| Crop: | Alfalfa |
| Conveyance: | Piped from well |
| Irrigation method: |
Center pivot |
| Crop net ET: |
242 AFY |
| Diversion quantity: |
316 AFY |
Scenario 4b – Center Pivot With a Groundwater Supply
Consider the field from Scenario 4a supplied by a groundwater well (Figure 6). No aquifer layering is considered, meaning the well is pumping from the same aquifer that contains the water table. The results and discussion for Scenario 4b are the same as Scenario 4a.
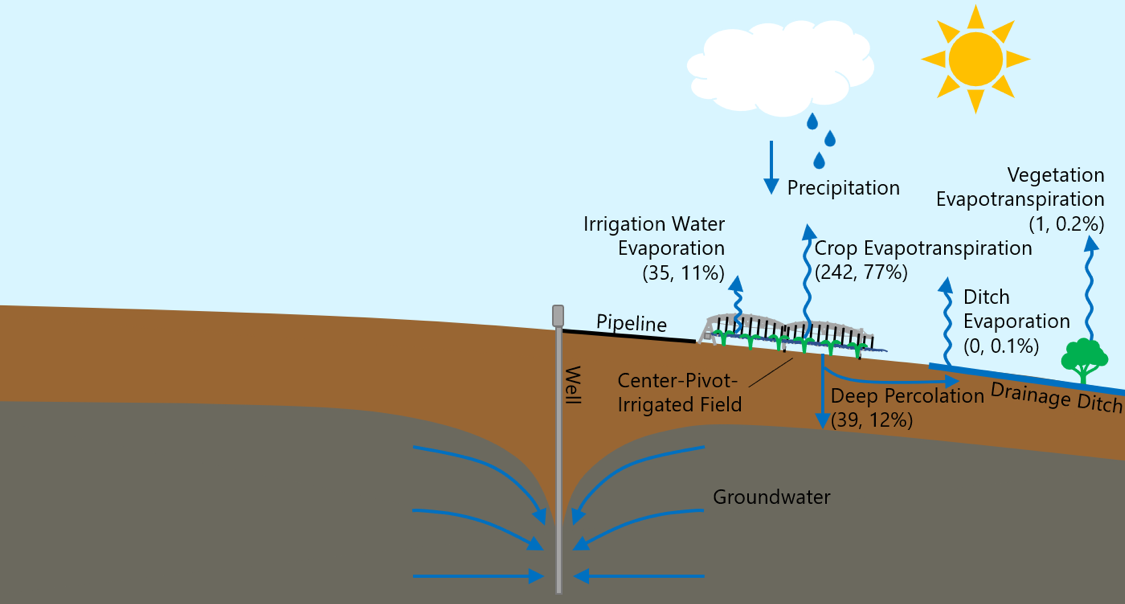
Note. Parenthetical values are water volume in acre-feet per year followed by percentages of total diversion.
Scenario 5 Case Parameters
| Location: | Central Utah |
| Water source: | Reservoir |
| Field size: | 199 acres |
| Crop: | Alfalfa |
| Conveyance: | Piped from well |
| Irrigation method: |
Center pivot |
| Crop net ET: |
481 AFY |
| Diversion quantity: |
628 AFY |
Scenario 5 – Center Pivot Irrigation With Expanded Irrigated Land
Take Scenario 4a but use the reduced diversion requirement relative to Scenario 1 to increase the irrigated land to 199 acres to maintain the diversion at 628 AFY (water spreading).
- The total diversion is 628 AFY, the same as in Scenario 1.
- Crop net ET increases to 481 AFY from 242 AFY in Scenario 1.
- Total consumptive use is 552 AFY from 253 AFY in Scenario 1.
- Return flow is reduced to 77 AFY from 375 AFY.
- The impact on reservoir storage is similar to Scenario 1, but there is a much greater impact on the hydrologic basin, including any downstream users.
Scenario 6 Case Parameters
| Location: | Central Utah |
| Conveyance: | Transbasin pipeline or canal system |
| Water losses: |
? |
Scenario 6 – Transbasin Diversions
If water is conveyed outside of the source hydrologic basin in any of Scenarios 1–5, no seepage, runoff, tailwater, or deep percolation in the new basin would be return flow in the original basin. So, all water exiting the basin is considered consumptive use from the diversion basin (see NRCE & Jacobs, 2021). Within the new basin, any reduction in water crossing the basin boundary would cause a decrease in water within that basin.
Table 1
Example Water Balance for Scenarios 1 – 5
|
Description |
Annual quantity (acre-feet per year)1 |
Use type |
|||||||
|
Scenario 1 |
Scenario 2 |
Scenario 3 |
Scenarios 4a&4b |
Scenario 5 |
Consump-tive |
Non-Consump-tive |
|||
|
Conveyance |
Unlined canal |
Lined canal |
Piped |
Piped |
Piped |
|
|||
|
Irrigation system |
Surface |
Surface |
Wheel lines |
Center pivot |
Center pivot |
|
|||
|
Irrigated area (acres) |
100 |
100 |
100 |
100 |
199 |
|
|||
|
Total diverted water |
628 |
440 |
375 |
316 |
628 |
||||
|
Total canal (conveyance) losses |
256 |
68 |
0 |
0 |
0 |
||||
|
- |
Total seepage 2 |
192 |
22 |
0 |
0 |
0 |
|||
|
- |
- |
Bank vegetation ET from seepage 3 |
1 |
0 |
0 |
0 |
0 |
X |
|
|
- |
- |
Remaining seepage |
190 |
22 |
0 |
0 |
0 |
X 4 |
|
|
- |
Operational spill (tailwater) |
63 |
44 |
0 |
0 |
0 |
X 4 |
||
|
- |
Evaporation from canal water 3 |
2 |
2 |
0 |
0 |
0 |
X |
||
|
Total water reaching the field |
372 |
372 |
375 |
316 |
628 |
||||
|
Total field application losses |
130 |
130 |
133 |
74 |
147 |
||||
|
- |
Deep percolation 5,6 |
114 |
114 |
81 |
39 |
78 |
X 4 |
||
|
- |
Field runoff (tailwater) 5,6 |
13 |
13 |
0 |
0 |
0 |
X 4 |
||
|
- |
Evaporation during application 3,5 |
3 |
3 |
52 |
35 |
69 |
X |
||
|
Crop evapotranspiration supplied from |
242 |
242 |
242 |
242 |
481 |
X |
|||
|
Total drain water 7 |
137 |
74 |
16 |
8 |
16 |
||||
|
- |
Evaporation from drain channel water 3 |
2 |
1 |
1 |
0 |
1 |
X |
||
|
- |
Drainage channel bank vegetation ET |
3 |
2 |
1 |
1 |
1 |
X |
||
|
Total consumptive use |
253 |
250 |
296 |
278 |
552 |
||||
|
Total nonconsumptive use |
375 |
189 |
79 |
38 |
77 |
||||
1Values have been rounded and may not sum to the totals.
2Canal seepage is based on Napan (2008).
3Net irrigation and evaporation estimates are from Hill, et al. (2011) in the Utah Agricultural Experiment Station Report 213. For many irrigation water optimization efforts that involve increasing efficiency or irrigation application uniformity, crop evapotranspiration (and consumptive use) will increase because more of the crop will receive a proper amount of water.
4Some of the nonconsumptive losses may eventually supply riparian vegetation or may flow to surface water and evaporate. This is represented in the examples using a drainage ditch from which water is evaporated and transpired (see footnote 7).
5Soil information is based on a Redfield silt loam https://websoilsurvey.sc.egov.usda.gov/.
6Based on simulations using the USDA's WinSRFR software and Waller and Yitayew (2016).
7Assumed to be 100% of field runoff and canal spills plus 20% of deep percolation and canal seepage.
Brief Comparison of Optimization Practices
The example scenarios included only a few optimization practices. Whether or not an optimization practice would be considered beneficial is situation-specific. However, it is possible to roughly categorize certain practices based on the likelihood of reducing diversion and/or consumptive use (Table 2). Though many of the optimization practices listed in Table 2 have the potential to reduce diversion/withdrawals, only some of the practices may be expected to reduce consumptive use. Further information regarding the relative benefits and costs of optimization practices is provided in a USU Extension fact sheet titled Irrigation Water Loss and Recovery in Utah by Crookston et al. (2022). An online Irrigation Technology Cost/Benefit Analysis Calculator is also available on the USU Extension Crops website.
Table 2
Water Use Reduction Potential From Several Types of Optimization Practices
|
Optimization practice1 |
Likely to reduce diversion/withdrawal? |
Likely to reduce consumptive use? |
Example scenario |
|||
|
Fallowing |
Yes |
Yes |
||||
|
Deficit irrigation |
Yes |
Yes |
||||
|
Change crops |
Possibly |
Possibly |
||||
|
Canal lining/piping |
Yes |
No |
2,3 |
|||
|
Improve surface irrigation efficiency |
Yes |
No |
||||
|
Improve sprinkler irrigation efficiency |
Yes |
Possibly |
||||
|
Improve drip irrigation efficiency |
Yes |
No |
||||
|
Convert surface irrigation to sprinkler |
Possibly |
No |
3,4a |
|||
|
Reduce sprinkler wind drift/evaporation |
Yes |
Yes |
4a |
|||
|
Convert surface irrigation to drip |
Yes |
Possibly |
||||
|
Convert sprinkler irrigation to drip |
Yes |
Yes |
||||
|
Scientific irrigation scheduling |
Possibly |
Possibly |
||||
1See NRCE and Jacobs (2021).
Increasing Consumptive Use With Optimization Practices
One often unintended consequence of optimizing irrigation water use is that some optimization practices increase crop evapotranspiration. For example, when lining a canal, water deliveries may be more reliable to water shareholders. Improving on-farm irrigation efficiency often means applying water more effectively to more plants. Both cases will tend to increase both crop yield and crop consumptive use. Unless coupled with some other reduction in consumptive use, like less wind and evaporation loss, improved irrigation efficiency and uniformity can often result in increased consumptive use per acre irrigated. However, crop production may also improve, less energy may be required to apply water, and there may be less stress on supply reservoirs. Any such benefits must be weighed against the cost of increased consumptive use.
Conclusions
There are many benefits to optimizing irrigation water use. These benefits may include less rapid depletion of reservoir storage, surface water, or groundwater resources, economic benefits to the water user, reduced labor requirements, improved control, less overall stress on the hydrologic system, the ability to use water for other purposes, and increased yield per unit water applied. However, consumptive water use and nonconsumptive use have different impacts on the basin hydrology and downstream water users.
It is important to consider impacts to both diversion and consumptive use when considering water optimization practices. Otherwise, it is possible to invest significant amounts of money on projects that have little benefit toward the desired outcome. If reducing water use on a basin scale is the highest priority, then optimization practices should reduce consumptive use. Such practices, like deficit irrigation or fallowing, however, can have significant negative economic impacts on water users and the community where they farm. When the economic viability of agriculture is the primary goal, practices that increase flexibility and reduce labor costs are often important, like piping canals and installing center pivots. If reducing reservoir releases or maintaining water supply security upstream of the diversion (or well) is prioritized, then optimization practices that reduce diversion are of most benefit, like canal lining/piping or changing to more efficient irrigation methods. These principles should be considered when making water optimization decisions.
Disclaimer
All figures and photos are by Burdette Barker and require attribution.
References
-
Crookston, B., Peters, R. T., Yost, M., & Barker, B. (2022). Water loss and recovery of irrigation systems [Fact sheet]. Utah State University Extension. https://digitalcommons.usu.edu/extension_curall/2278/
-
Hill, R. W., Barker, J. B., & Lewis, C. S. (2011). Crop and wetland consumptive use and open water surface evaporation for Utah [Report No. 213]. Utah Agricultural Experiment Station, Utah State University. https://extension.usu.edu/irrigation/crop-water-use
-
Keller, J. & Bliesner, R. D. (2000). Sprinkle and trickle irrigation. The Blackburn Press.
-
Molina, K. N. (2008). Seepage evaluations in Cache Valley irrigation canals (Publication No. 424) [Master’s thesis, Department of Biological and Irrigation Engineering, Utah State University]. All Graduate Theses and Dissertations. https://digitalcommons.usu.edu/etd/424/
-
Natural Resources Consulting Engineers, Inc., & Jacobs Engineering Group, Inc. (NRCE & Jacobs). (2021). Exploration of quantification methods for agricultural water savings in the lower Colorado River Basin. Bureau of Reclamation, U.S. Department of the Interior. https://www.usbr.gov/lc/region/programs/crbstudy/Agstudy.html
-
Waller, P., & Yitayew, M. (2016). Irrigation and drainage engineering. Springer.
Published May 2023
Utah State University Extension
Peer-reviewed fact sheet
Authors
Burdette Barker, Jody Gale, Mark Nelson and Matt Yost


Jody Gale
Extension Associate Professor | Agriculture Economic Development | Sevier County

Mark Nelson
Extension Professor | Agriculture & 4-H | Beaver Co. Director

Related Research
2015 Costs and Returns for Flood Irrigated Alfalfa, Box Elder County
Enterprise budgets are the building blocks of a farm or ranch. They represent estimates of income and expenses for a specific period of time using a set of production practices and inputs for that enterprise.

2015 Costs and Returns for Irrigated Soft White Wheat, Box Elder County
Enterprise budgets are the building blocks of a farm or ranch. They represent estimates of income and expenses for a specific period of time using a set of production practices and inputs for that enterprise.

2019 Costs and Returns for Irrigated Safflower, Northern Utah
Enterprise budgets are the building blocks of a farm or ranch. They represent estimates of income and expenses for a specific period of time using a set of production practices and inputs for that enterprise. This research contains sample costs and return
2022 Costs and Returns for Non-irrigated Flax in Utah
Enterprise budgets are created to help a grower to understand all the costs and returns associated with producing a crop and are usually expressed on a per-unit basis, such as per acre.
4R’s of Irrigation Management
The research community and fertilizer industry have developed and utilized a framework termed “4R nutrient management” to help improve fertilizer stewardship. For decades, national and international organizations and institutes such as The Fertilizer Inst

50 Common Questions About Field Crops
Utah State University (USU) Extension strives to provide research-based information and knowledge to help agricultural producers. Producers often have questions about several aspects of field crop production. This article is not comprehensive of all ques
Accurate Irrigation Water Flow Measurement in Pipes
Accurate flow measurement is important to irrigation water management and water rights accounting and protection. Accurate flow measurement is essential in ensuring equitable water distribution to water rights holders and shareholders within irrigation co
Adopting Organic Wheat: Grower Motivations and Concerns
A recent study of wheat producers in the western United States found that wheat growers were actually transitioning out of organic production due to concerns about pest control and profitability. This fact sheet provides an overview of the study results b
Agricultural Irrigated Land and Irrigation Water Use in Utah
This article is a summary of several estimates of the extent of agricultural irrigation in Utah and some associated trends.

Agricultural Producers’ Motivations and Challenges With Improving Soil Health in Utah
This study examines Utah agricultural producers' motivations and challenges in adopting soil health practices. It highlights the lack of localized resources and transferable knowledge as barriers, while emphasizing producers' desire to gain insights, enha

Agriculture Water Use and Economic Value in the Great Salt Lake Basin
This fact sheet provides information about the following topics in the context of the Great Salt Lake and its basin: Great Salt Lake facts, Human effects on the size of the lake, Changes to population and land use, Agricultural water use, Agriculture and

Aphids in Alfalfa
Aphids belong in the order Hemiptera and family Aphididae. Aphids are common insects in field and forage crops, with at least six kinds in Utah alfalfa. Aphids can be distinguished from other insects in alfalfa with a hand lens. In general, aphids are sof
Barley yellow dwarf virus (BYDV)
Barley yellow dwarf virus (BYDV) is found worldwide. It infects small grains like barley, wheat, oats and rice as well as many wild grass species. There are two strains of the barley yellow dwarf virus: BYDV-MAV and BYDV-PAV.
Boom Sprayer Calibration for Pesticide Applications
To protect your investment in agricultural pesticides, a boom sprayer should be calibrated at the start of the season and whenever application conditions change. Also, sprayer output should be periodically checked throughout the season to assure proper ap
Buying and Selling Corn Silage or Other High Moisture Feeds: Value the Feed not the Water
Alfalfa is the most important crop in Utah, both in terms of acreage and revenue. Although often overlooked, one of the most critical decisions made in alfalfa production is determining which variety to plant. This report summarizes dry matter (DM) yields
Characteristics of Organic Wheat Growers
A recent study was conducted with wheat growers in the western U.S. which found notable differences in the grower and farm characteristics that influence organic adoption, including older age and the lack of importance of gender and farming experience. Th
Chopping and Storing Quality Corn Silage
Properly harvested and stored, corn silage is extremely palatable, superior to other forages in energy content, a great fiber source, and relatively consistent in quality. The high palatability of corn silage encourages feed intake which contributes to hi

Comparison of Three Traps Used for Pocket Gopher Management (Thomomys Bottae) in Alfalfa Fields
Valley pocket gophers (Thomomys bottae) are a common agricultural pest in many areas of Utah, Nevada and California. Pocket gophers predominantly eat roots, although they will pull vegetation into their burrows, and eat plants immediately adjacent to thei
Considerations for Crop Rotation from Alfalfa to Corn
The importance of rotating out of a declining alfalfa stand is well established. As the alfalfa stand ages, forage yield and quality decline, while weed, insect, and disease pressures increase.
Corn Earworm
In Utah, there are typically three generations of corn earworm (CEW) each year. The first generation of adults either come from overwintering pupae (southern and central Utah) or migrate into northern Utah. The adult moth is tannish brown with a 1 1/2 inc
Corn Silage Variety Performance
This report summarizes on-farm performance of irrigated silage corn hybrids at Benson (Cache County) in 2006. The site is at 4439 ft elevation and has a long-term average of 2800 corn growing degree days (50/86° F) per year. Hybrids were seeded with a six
Costs and Returns for Non-Irrigated Safflower
Enterprise budgets are the building blocks of a farm or ranch. They represent estimates of income and expenses for a specific period of time using a set of production practices and inputs for that enterprise. Tables in this research is intended to be a gu

Costs and Returns for Roundup Ready™ Grain Corn
Enterprise budgets are the building blocks of a farm or ranch. They represent estimates of income and expenses for a specific period of time using a set of production practices and inputs for that enterprise. This research contains sample costs and return

Costs and Returns for Roundup Ready™ Silage Corn
Enterprise budgets are the building blocks of a farm or ranch. They represent estimates of income and expenses for a specific period of time using a set of production practices and inputs for that enterprise. This research contains sample costs and return
County-Level View of Irrigation Trends in Utah and the West
As water demand and scarcity increase simultaneously over the coming decades, water managers and growers will need to optimize water use on their irrigated lands. These challenges have been especially noticeable as the Western U.S.faces a prolonged “megad
Cover Crops for Utah
The purpose of this fact sheet is to provide the current state of knowledge on cover crop management for Utah based on USU research and local grower experience.

Crop Advisor Approaches to Soil Health Advising and Opportunities for Improvement
The report highlights that crop advisors in Utah and Idaho are increasingly addressing soil health, though barriers like cost, lack of localized information, and disagreements about soil health practices persist. Advisors from the NRCS are the most active

Crop Revenue Coverage 2007 Commodity Insurance Fact Sheet
Crop Revenue Coverage(CRC), provides revenue protection against a yield loss, a price decline, or a combination of both. CRC is available for these crop and counties Beaver, Box Elder, Cache, Carbon, Davis, Duchesne, Emery, Garfield, Iron, Juab, Millard,
Defense Against Drought
Utah’s climate can often be harsh and unpredictable. As the nation’s second driest state, Utah is commonly subject to droughts. Extensive statewide droughts have often lasted 5 to 6 years. It is imperative that farmers are well prepared to defend against
Deficit Irrigation of Pastures
Deficit irrigation is any irrigation level that does not meet the crop’s full evapotranspiration (ET) demand, meaning evaporation from plant and soil surface and transpiration through plant growth.
Diagnostic Testing for Nitrogen Soil Fertility
Environmental concerns over nitrate contamination of ground water, and the desire of land managers to increase the efficiency of their fertilizer investment, can both be satisfied more completely through diagnostic testing for nitrogen (N) soil fertility.
Downy Mildew of Alfalfa
Downy mildew is an obligate parasite. Even though they look like fungi they are not. They belong to the Oomycota and are more closely related to algae than true fungi. The most common alfalfa downy mildew species in the USA is Peronospora trifoliorum. In
Drought Tolerance Guide for Alfalfa in Utah
Crop variety selection is one of the most important choices on the farm. Crop genetics determine a significant portion of the yield potential and resource use efficiency. Crop types and genetics that use water more efficiently will become increasingly imp
Drought Tolerance Guide for Corn in Utah
Crop variety selection is one of the most important choices on the farm. Crop genetics determine a significant portion of the yield potential and resource use efficiency. Crop types and genetics that use water more efficiently will become increasingly imp
Drought Tolerance Guide for Small Grains in Utah
Crop variety selection is one of the most important choices on the farm. Crop genetics determine a significant portion of the yield potential and resource use efficiency.
Dwarf Bunt in Winter Wheat
The disease first appeared in Utah in the early 1930s in Cache County near the city of Paradise. The disease was soon found in Box Elder County near Hansel Valley. The outbreak of dwarf bunt became so severe that it affected other crops, such as barley.
Easy Calibration for Backpack and Canister (Handheld) Sprayers
If sprayers are not properly calibrated, it can result in over or under-application of chemicals, causing damage, reduced pest control, and potential safety concerns. Making the effort to properly mix chemicals and calibrate sprayers can save money and in
Easy Calibration for Boom Sprayers
Making the effort to properly mix chemicals and calibrate sprayers can save money and headaches in the long run. This fact sheet provides simple guidelines for calibrating boom sprayers.
Economic Feasibility of Solar Photovoltaic Irrigation Systems
The Great Basin is primarily located in Nevada, western Utah, and small sections of southern Oregon and Idaho. The Great Basin is noted for its arid conditions and high percentage of publically owned land. The potential for solar energy generation in the
Energy Conservation with Irrigation Water Management
Irrigators in Utah experienced rapidly increasing energy costs from the mid 1970s to the late 1980s. These costs remain relatively high. Those who are pumping from deep wells are particularly interested in ways to cut back on energy use without doing away

Evapotranspiration and Precipitation Data for Calculating Irrigation Water Requirements in Utah
In this fact sheet, we calculated average reference evapotranspiration and precipitation data for multiple locations in Utah, USA. To accomplish this, we collected the data from the Utah Climate Center and compiled it to show an average of 20 years of dat
Fertigation Facts
The purpose of this fact sheet is to provide general information on forms of fertigation for primary plant nutrient, fertigation timing, and fertigation economics.
Grass Pasture Response to Water and Nitrogen
The objective of this project is to study the response of pasture grass varieties to weather, irrigation, and fertility in a field experimental plot at a high elevation. The water variable is accomplished with a line source sprinkler irrigation system. Tw
Growing Safflower in Utah
Northern Utah growers produced approximately 23 million pounds of safflower second only to California in U.S. production.
Guide to Irrigation Sprinkler Packages for Pivots and Laterals
Guide to Irrigation Sprinkler Packages for Pivots and Laterals
Guide to Pivot Track Management
Center pivot irrigation systems are the most popular form of irrigation in the western United States. A significant problem with center pivots is wheel track rutting. Deep wheel tracks can cause overirrigation because the pivot moves slower than intended
How Good is Your Water Measurement?
Accurate water measurement is essential to maintaining equity of water delivery within an irrigation company or water districts. Good management of our scarce water resource is dependent upon quantifying supplies and uses with accurate measurement techniq