Evapotranspiration and Precipitation Data for Calculating Irrigation Water Requirements in Utah

Introduction
Reference evapotranspiration (ETo) and precipitation data are essential for developing water budgets and calculating irrigation water requirements. However, it is crucial that the data used for such purposes are recent and easily accessible to stakeholders. In this fact sheet, we calculated average reference evapotranspiration and precipitation data for multiple locations in Utah, USA. To accomplish this, we collected the data from the Utah Climate Center and compiled it to show an average of 20 years of data by month in an easily digestible format. We compiled data for 69 locations in Utah, making it easy to find one close to your site. However, it is important to note that the data might not be accurate in every location, as some locations may have distinct microclimate. Nevertheless, stakeholders can use this data to develop a water budget and calculate irrigation water requirements for their area.
Evaporation and Transpiration
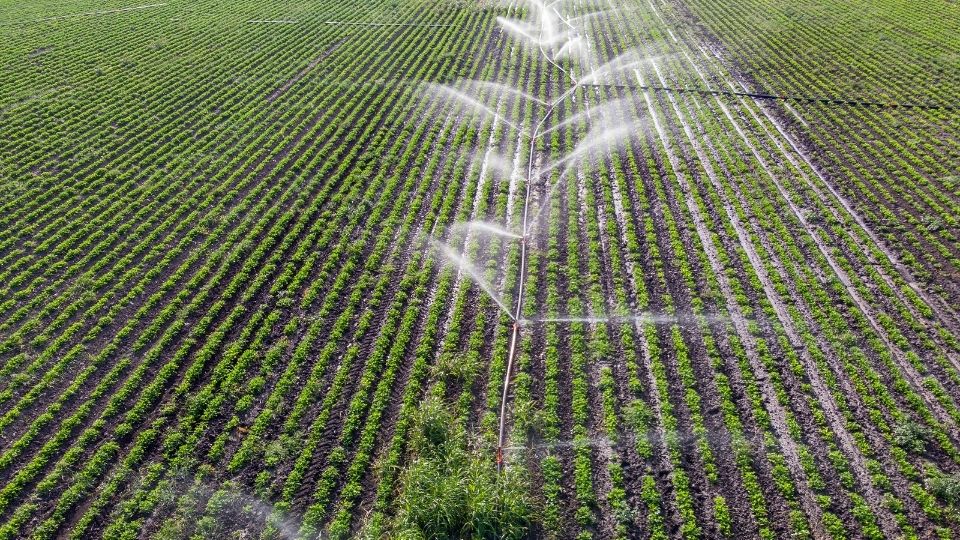
Evapotranspiration or actual evapotranspiration (ETa) is made up of two words: evaporation and transpiration. The amount of water lost through soil surface and water bodies is referred to as evaporation, whereas transpiration is the loss of water via plants' leaves, stems, and other surfaces. Several factors can influence evapotranspiration rates, including solar radiation, temperature, humidity, wind, soil moisture, topography, atmospheric pressure, and surface coverings, such as plant type, plant density, and mulch layer.
While ETa is the amount of water that is actually lost for soil and plant surfaces, reference evapotranspiration (ETo) is a standardized method of estimating the potential water loss from a well-watered, uniform cool-season grass or reference crop under specific meteorological conditions. The cool-season grass or reference crop has a uniform height and is assumed to always have sufficient water supply. ETo is a theoretical reference value that represents the maximum evapotranspiration that can occur under those idealized conditions. Therefore, ETo is often used as a standard, baseline, or reference for estimating crop water needs and scheduling irrigation. There are several methods that can be used to calculate ETo values; however, the Penman-Monteith method is most widely used. It is important to have accurate and reliable meteorological data, as generating precise ETo values depend on quality meteorological data used in the calculations.
Evapotranspiration Data in Utah
Utah is a climatically diverse state with varying geographical conditions, such as topography, altitude, and vegetation. As ETo is a function of various climatic and geographical conditions, ETo varies in different parts of the state. To understand this, let us consider the interaction between two factors: latitude (proximity to equator) and evapotranspiration. St. George, Utah, is closer to the equator than Salt Lake City, Utah; therefore, St. George receives higher solar radiation, and thus, has a higher evapotranspiration rate.
Reference Evapotranspiration and Precipitation Data: Vital Roles in Water Management
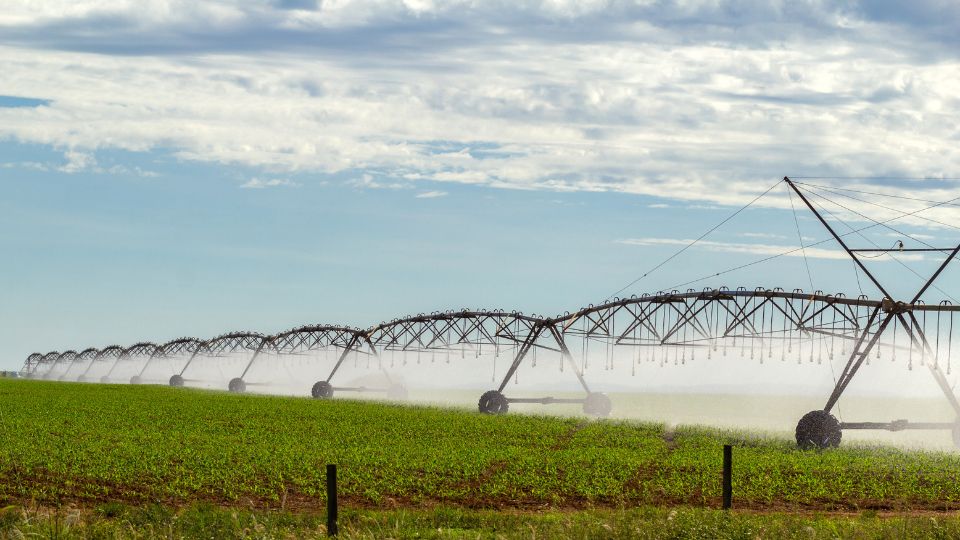
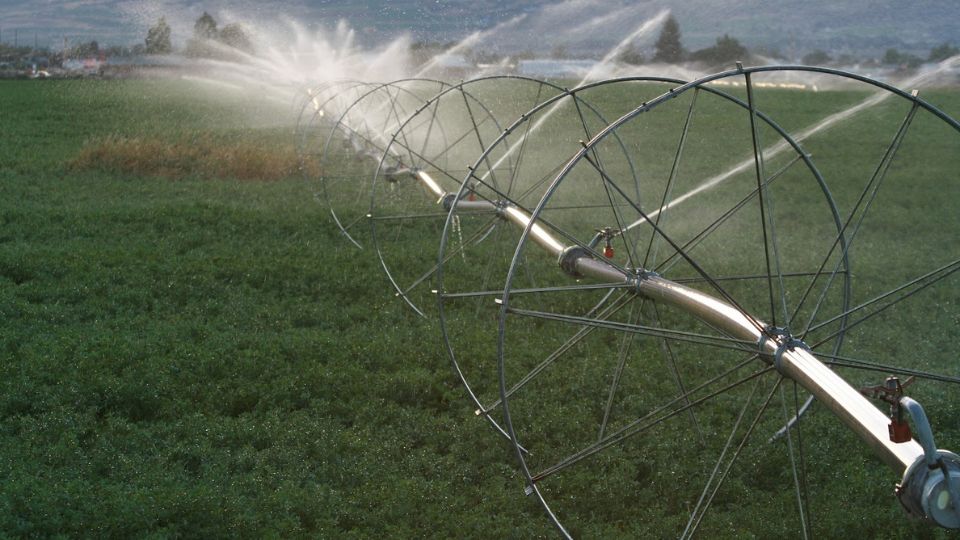
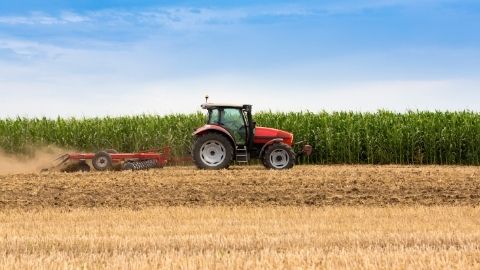
Reference evapotranspiration (ETo) data plays a critical role in agricultural water management, as it provides essential information on crop or landscape water requirements under standardized environmental conditions. Landscapers rely on ETo data to estimate the amount of water required for crops and landscape, thus helping them manage irrigation systems and avoid over or underwatering. ETo data can be used in the landscape planning process to determine potential water savings that can be achieved by using low-water-use plants or changing landscape designs. The ETo values can also be used to:
- Develop water management plans for regions.
- Assist in forecasting areas of drought.
- Manage water resources in agricultural and urban areas.
- Plan landscape by budgeting the available water.
In addition to ETo, including precipitation data in calculations further increases accuracy of water budget estimation. Precipitation is any form of water that falls on earth. In Utah, rain and snow are the two most common forms of precipitation. While ETo data provides potential water loss numbers to determine the irrigation water needs, precipitation amount should be accounted and subtracted from irrigation water. In addition, if the laws allow, precipitation water can be stored and used as needed to reduce the reliance on culinary or secondary water.
Use Most Recent Data
However, as important as the ETo and precipitation data are, it is also equally important to have the most recent data because climate and other meteorological conditions change significantly over time. This is especially important as climate change is rapidly changing average temperature, precipitation, and other weather patterns that can impact ETo rates. Using decade old average ETo data may not account for these changes in weather patterns, resulting in inaccurate water budget calculations and poor accuracy in irrigation planning. In addition to climate variations, instruments used to capture those data have also come a long way and are more accurate, powerful, and reliable. Therefore, it is crucial to use the most recent data one can find.
Using Data for Irrigation Scheduling in Landscapes
Estimate irrigation requirements by applying the following formula.
Gross Irrigation Requirement (GIR) (in gallons) = {(ETo – Precipitation) x PF x A } x 0.623
Net Irrigation Requirement (NIR) (in gallons) = GIR/IE
|
Where, ETo = |
Reference evapotranspiration data (in inches) are provided in Table 1. |
|
PF = |
The plant factor accounts for the water requirements of specific plant types or species within the landscape. Different plants have varying water needs, and the plant factor adjusts the ETo value to reflect these differences. For example, drought-tolerant plants may have a lower PF, while high-water-use plants may have a higher PF. It ranges from 0 to 1, where 1 is high-water-use plants. |
|
A = |
Area of the landscape that requires irrigation (in square feet) |
|
IE = |
Irrigation efficiency reflects how effectively water is delivered to the landscape. It considers factors such as the irrigation system's design, maintenance, and management. Higher IE indicates a more efficient irrigation system, while a lower IE suggests that more water may be needed to achieve the desired result. It ranges from 0 to 1 where 1 is 100 % efficient. |
|
Precipitation = |
Precipitation data (in inches) are provided Table 1. |
Data Generation
This fact sheet lists the most recent values for ETo and precipitation at different locations in Utah. To do so, we downloaded the reference evapotranspiration and precipitation data from the Utah Climate Center’s MapServer (https://climate.usu.edu/mapServer/mapGUI/index.php) website. We downloaded the data from the years 2000 to 2022, organized it by months, and averaged it for 22 years, aiming to cover all counties of Utah. Figure 1 shows locations included in this fact sheet. However, for some locations, we couldn’t find data for all 22 years, and in that case, we just included the data that was available. Some stations also had missing precipitation data and, in that case, we used the precipitation data from a nearby station. Those limitations are also highlighted in Table 1.
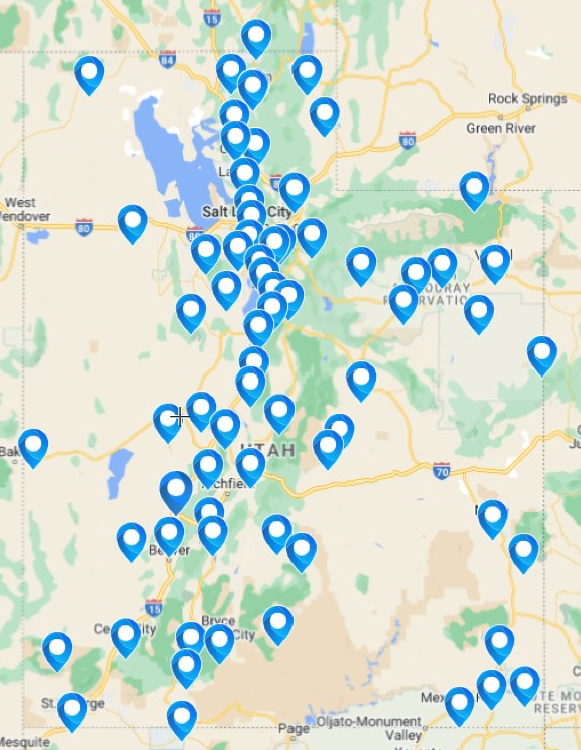
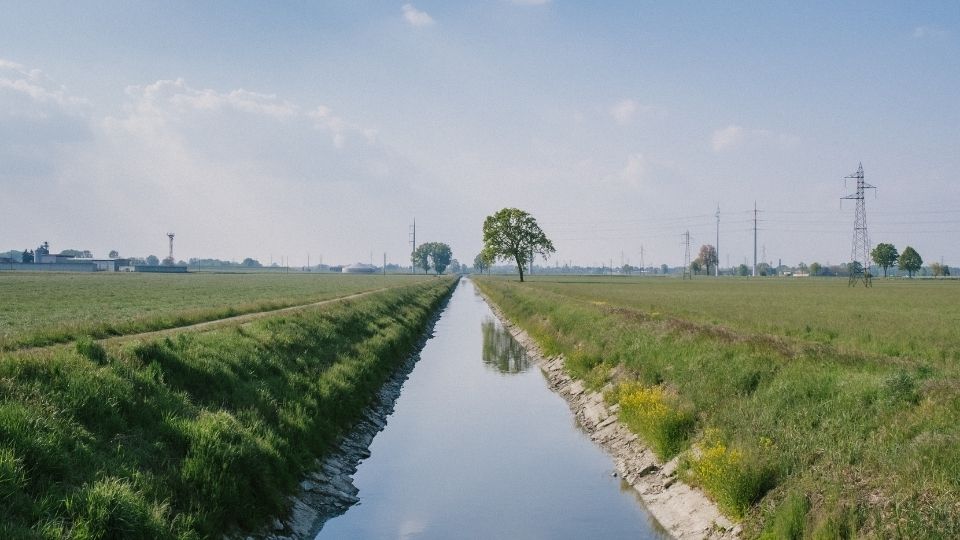
Figure 1. The Spread of Stations Selected to Include ETo and Precipitation Data
Limitations
Although this fact sheet has ETo and precipitation data for multiple Utah locations, and we advise choosing the station closest to your site, we also know it is important to understand that there are limitations to these data. Local weather and meteorological conditions can influence site-specific evapotranspiration rates, which can be challenging to capture accurately due to spatial and temporal variability. As such, it is important to consider the limitations of evapotranspiration data and contextualize it with additional information when making decisions or drawing conclusions.
Table 1. Tables for Average Monthly and Annual Reference Evapotranspiration (ETo) and Precipitation (ppt) Data for
Various Utah Locations
|
Alta, UT |
||||||||||||||
|
Average |
Jan |
Feb |
Mar |
Apr |
May |
Jun |
Jul |
Aug |
Sep |
Oct |
Nov |
Dec |
Annual |
|
|
Total ETo (inches) |
0.61 |
0.71 |
1.44 |
2.19 |
3.40 |
4.79 |
5.59 |
4.65 |
3.14 |
1.69 |
0.85 |
0.51 |
29.84 |
|
|
Total ppt (inches) |
5.69 |
5.53 |
5.52 |
5.44 |
3.29 |
1.84 |
1.53 |
2.24 |
2.63 |
3.46 |
4.24 |
6.17 |
47.14 |
|
|
Alpine, UT |
||||||||||||||
|
Average |
Jan |
Feb |
Mar |
Apr |
May |
Jun |
Jul |
Aug |
Sep |
Oct |
Nov |
Dec |
Annual |
|
|
Total ETo (inches) |
0.86 |
1.27 |
2.63 |
3.79 |
5.56 |
7.10 |
7.93 |
6.73 |
4.65 |
2.63 |
1.31 |
0.76 |
45.41 |
|
|
Total ppt (inches) |
2.05 |
1.90 |
2.01 |
2.47 |
2.21 |
0.76 |
0.60 |
1.07 |
1.37 |
1.81 |
1.53 |
2.42 |
19.92 |
|
|
Altamont, UT *Missing ETo data from 2000–2001 |
||||||||||||||
|
Average |
Jan |
Feb |
Mar |
Apr |
May |
Jun |
Jul |
Aug |
Sep |
Oct |
Nov |
Dec |
Annual |
|
|
Total ETo (inches) |
0.64 |
1.02 |
2.36 |
3.59 |
5.17 |
6.63 |
7.34 |
6.18 |
4.31 |
2.43 |
1.20 |
0.58 |
41.43 |
|
|
Total ppt (inches) |
0.54 |
0.48 |
0.50 |
0.70 |
0.90 |
0.61 |
0.55 |
0.99 |
1.11 |
0.94 |
0.44 |
0.90 |
8.50 |
|
|
Alton, UT |
||||||||||||||
|
Average |
Jan |
Feb |
Mar |
Apr |
May |
Jun |
Jul |
Aug |
Sep |
Oct |
Nov |
Dec |
Annual |
|
|
Total ETo (inches) |
1.14 |
1.42 |
2.72 |
4.13 |
5.82 |
7.42 |
7.60 |
6.53 |
4.81 |
2.97 |
1.62 |
1.00 |
47.19 |
|
|
Total ppt (inches) |
1.67 |
1.75 |
1.42 |
0.77 |
0.65 |
0.25 |
1.44 |
2.09 |
1.63 |
1.99 |
1.08 |
1.81 |
15.99 |
|
|
Aragonite, UT * Used nearby station for ppt data, Mining Fork, UT |
||||||||||||||
|
Average |
Jan |
Feb |
Mar |
Apr |
May |
Jun |
Jul |
Aug |
Sep |
Oct |
Nov |
Dec |
Annual |
|
|
Total ETo (inches) |
0.86 |
1.25 |
2.51 |
3.67 |
5.36 |
6.90 |
7.84 |
6.66 |
4.49 |
2.58 |
1.25 |
0.75 |
44.13 |
|
|
Total ppt (inches) |
3.85 |
3.60 |
3.88 |
4.05 |
3.44 |
1.43 |
1.02 |
1.45 |
1.88 |
3.23 |
3.05 |
4.22 |
35.10 |
|
|
Assay-Hatch 10 SW, UT *Used nearby station for ppt data, Harris Flat, UT |
||||||||||||||
|
Average |
Jan |
Feb |
Mar |
Apr |
May |
Jun |
Jul |
Aug |
Sep |
Oct |
Nov |
Dec |
Annual |
|
|
Total ETo (inches) |
1.10 |
1.30 |
2.38 |
3.46 |
5.03 |
6.43 |
6.84 |
5.92 |
4.32 |
2.67 |
1.47 |
0.94 |
41.86 |
|
|
Total ppt (inches) |
2.13 |
2.31 |
1.70 |
0.89 |
0.70 |
0.36 |
1.87 |
2.09 |
1.67 |
1.99 |
1.59 |
2.76 |
20.05 |
|
|
Beaver Canyon PWR House, UT *2022 data is missing |
||||||||||||||
|
Average |
Jan |
Feb |
Mar |
Apr |
May |
Jun |
Jul |
Aug |
Sep |
Oct |
Nov |
Dec |
Annual |
|
|
Total ETo (inches) |
1.03 |
1.28 |
2.38 |
3.40 |
5.11 |
6.63 |
7.00 |
6.13 |
4.32 |
2.60 |
1.39 |
0.90 |
42.56 |
|
|
Total ppt (inches) |
1.42 |
1.68 |
1.86 |
1.79 |
1.65 |
0.62 |
1.97 |
1.60 |
0.89 |
1.50 |
0.93 |
1.51 |
17.71 |
|
|
Black Rock, UT |
||||||||||||||
|
Average |
Jan |
Feb |
Mar |
Apr |
May |
Jun |
Jul |
Aug |
Sep |
Oct |
Nov |
Dec |
Annual |
|
|
Total ETo (inches) |
1.07 |
1.61 |
3.32 |
4.79 |
6.67 |
8.29 |
9.00 |
7.69 |
5.43 |
3.23 |
1.64 |
0.96 |
53.47 |
|
|
Total ppt (inches) |
0.58 |
0.72 |
0.89 |
0.94 |
0.74 |
0.36 |
0.58 |
0.74 |
0.64 |
0.97 |
0.51 |
0.82 |
8.34 |
|
|
Blanding, UT |
||||||||||||||
|
Average |
Jan |
Feb |
Mar |
Apr |
May |
Jun |
Jul |
Aug |
Sep |
Oct |
Nov |
Dec |
Annual |
|
|
Total ETo (inches) |
1.09 |
1.50 |
2.93 |
4.22 |
6.01 |
7.46 |
7.79 |
6.62 |
4.66 |
2.93 |
1.56 |
0.95 |
47.78 |
|
|
Total ppt (inches) |
1.40 |
1.23 |
0.96 |
0.55 |
0.61 |
0.32 |
0.98 |
1.20 |
1.31 |
1.27 |
0.77 |
1.35 |
12.10 |
|
|
Bluff, UT |
||||||||||||||
|
Average |
Jan |
Feb |
Mar |
Apr |
May |
Jun |
Jul |
Aug |
Sep |
Oct |
Nov |
Dec |
Annual |
|
|
Total ETo (inches) |
1.26 |
1.90 |
3.67 |
5.33 |
7.22 |
8.76 |
8.87 |
7.58 |
5.54 |
3.46 |
1.86 |
1.11 |
56.41 |
|
|
Total ppt (inches) |
0.75 |
0.60 |
0.48 |
0.26 |
0.39 |
0.27 |
0.66 |
0.94 |
0.90 |
0.78 |
0.42 |
0.68 |
7.20 |
|
|
Bountiful Bench, UT |
||||||||||||||
|
Average |
Jan |
Feb |
Mar |
Apr |
May |
Jun |
Jul |
Aug |
Sep |
Oct |
Nov |
Dec |
Annual |
|
|
Total ETo (inches) |
0.79 |
1.15 |
2.37 |
3.46 |
4.99 |
6.27 |
7.04 |
5.92 |
4.04 |
2.36 |
1.17 |
0.70 |
40.26 |
|
|
Total ppt (inches) |
2.49 |
2.35 |
3.13 |
3.58 |
2.63 |
1.14 |
0.60 |
1.26 |
1.53 |
2.18 |
2.34 |
2.84 |
26.16 |
|
|
Brigham City West PLT, UT |
||||||||||||||
|
Average |
Jan |
Feb |
Mar |
Apr |
May |
Jun |
Jul |
Aug |
Sep |
Oct |
Nov |
Dec |
Annual |
|
|
Total ETo (inches) |
0.74 |
1.16 |
2.56 |
3.82 |
5.55 |
7.08 |
8.25 |
7.03 |
4.75 |
2.70 |
1.25 |
0.67 |
45.72 |
|
|
Total ppt (inches) |
1.42 |
1.18 |
1.38 |
1.61 |
1.76 |
0.83 |
0.15 |
0.72 |
1.36 |
1.53 |
1.13 |
1.37 |
14.37 |
|
|
Brighton, UT *Missing ETo data from 2018-2020 |
||||||||||||||
|
Average |
Jan |
Feb |
Mar |
Apr |
May |
Jun |
Jul |
Aug |
Sep |
Oct |
Nov |
Dec |
Annual |
|
|
Total ETo (inches) |
0.73 |
0.91 |
1.75 |
2.56 |
3.77 |
4.98 |
5.68 |
4.72 |
3.23 |
1.83 |
0.94 |
0.60 |
31.70 |
|
|
Total ppt (inches) |
4.31 |
3.60 |
3.36 |
3.66 |
2.44 |
1.25 |
0.98 |
1.80 |
2.12 |
3.10 |
3.45 |
4.57 |
35.93 |
|
|
Bryce Canyon AP, UT *Missing ETo data of 2000 |
||||||||||||||
|
Average |
Jan |
Feb |
Mar |
Apr |
May |
Jun |
Jul |
Aug |
Sep |
Oct |
Nov |
Dec |
Annual |
|
|
Total ETo (inches) |
0.86 |
1.11 |
2.29 |
3.57 |
5.28 |
6.87 |
7.29 |
6.26 |
4.51 |
2.71 |
1.41 |
0.76 |
42.93 |
|
|
Total ppt (inches) |
0.60 |
0.64 |
0.70 |
0.59 |
0.61 |
0.32 |
1.54 |
1.42 |
1.49 |
1.36 |
0.68 |
0.71 |
10.65 |
|
|
Capitol Reef NP, UT |
||||||||||||||
|
Average |
Jan |
Feb |
Mar |
Apr |
May |
Jun |
Jul |
Aug |
Sep |
Oct |
Nov |
Dec |
Annual |
|
|
Total ETo (inches) |
1.05 |
1.53 |
2.93 |
4.29 |
5.92 |
7.35 |
7.64 |
6.52 |
4.68 |
2.80 |
1.45 |
0.89 |
47.06 |
|
|
Total ppt (inches) |
0.42 |
0.52 |
0.53 |
0.40 |
0.57 |
0.31 |
1.24 |
1.06 |
0.98 |
0.95 |
0.49 |
0.31 |
7.72 |
|
|
Castle Dale, UT |
||||||||||||||
|
Average |
Jan |
Feb |
Mar |
Apr |
May |
Jun |
Jul |
Aug |
Sep |
Oct |
Nov |
Dec |
Annual |
|
|
Total ETo (inches) |
1.02 |
1.54 |
3.15 |
4.55 |
6.30 |
7.83 |
8.48 |
7.28 |
5.28 |
3.19 |
1.62 |
0.90 |
51.00 |
|
|
Total ppt (inches) |
0.55 |
0.58 |
0.50 |
0.42 |
0.54 |
0.39 |
0.52 |
0.82 |
0.93 |
1.05 |
0.31 |
0.45 |
7.09 |
|
|
Cedar City MUNI AP, UT |
||||||||||||||
|
Average |
Jan |
Feb |
Mar |
Apr |
May |
Jun |
Jul |
Aug |
Sep |
Oct |
Nov |
Dec |
Annual |
|
|
Total ETo (inches) |
1.16 |
1.57 |
3.02 |
4.30 |
6.17 |
7.78 |
8.24 |
7.11 |
5.20 |
3.18 |
1.71 |
1.02 |
50.36 |
|
|
Total ppt (inches) |
0.71 |
0.94 |
1.23 |
1.02 |
0.86 |
0.36 |
1.19 |
0.93 |
0.71 |
1.15 |
0.77 |
1.02 |
11.12 |
|
|
Chalk Creek #2, UT *Missing ETo data from 2017–2020 |
||||||||||||||
|
Average |
Jan |
Feb |
Mar |
Apr |
May |
Jun |
Jul |
Aug |
Sep |
Oct |
Nov |
Dec |
Annual |
|
|
Total ETo (inches) |
0.67 |
0.88 |
1.84 |
2.85 |
4.21 |
5.37 |
6.01 |
4.97 |
3.24 |
1.86 |
0.90 |
0.56 |
33.37 |
|
|
Total ppt (inches) |
2.27 |
2.03 |
2.35 |
2.77 |
2.30 |
1.34 |
0.82 |
1.58 |
1.90 |
2.23 |
2.20 |
2.51 |
24.92 |
|
|
City Creek WTP, UT *Missing ETo data from 2000–2001 |
||||||||||||||
|
Average |
Jan |
Feb |
Mar |
Apr |
May |
Jun |
Jul |
Aug |
Sep |
Oct |
Nov |
Dec |
Annual |
|
|
Total ETo (inches) |
0.84 |
1.20 |
2.48 |
3.66 |
5.47 |
6.95 |
7.92 |
6.78 |
4.70 |
2.67 |
1.29 |
0.71 |
44.58 |
|
|
Total ppt (inches) |
2.30 |
2.17 |
3.07 |
3.47 |
2.78 |
1.13 |
0.52 |
0.88 |
1.60 |
2.22 |
2.21 |
2.65 |
25.00 |
|
|
Clayton Springs, UT *Missing ETo data of 2000, 2018, and 2019 |
||||||||||||||
|
Average |
Jan |
Feb |
Mar |
Apr |
May |
Jun |
Jul |
Aug |
Sep |
Oct |
Nov |
Dec |
Annual |
|
|
Total ETo (inches) |
0.86 |
1.08 |
2.02 |
2.78 |
4.08 |
5.41 |
5.74 |
4.84 |
3.45 |
2.08 |
1.12 |
0.72 |
34.17 |
|
|
Total ppt (inches) |
1.98 |
2.16 |
2.10 |
1.90 |
1.21 |
0.53 |
2.40 |
2.49 |
1.86 |
2.37 |
1.56 |
2.33 |
24.02 |
|
|
Cottonwood Weir, UT |
||||||||||||||
|
Average |
Jan |
Feb |
Mar |
Apr |
May |
Jun |
Jul |
Aug |
Sep |
Oct |
Nov |
Dec |
Annual |
|
|
Total ETo (inches) |
0.82 |
1.24 |
2.54 |
3.76 |
5.26 |
6.65 |
7.39 |
6.27 |
4.32 |
2.55 |
1.23 |
0.73 |
42.47 |
|
|
Total ppt (inches) |
1.78 |
1.92 |
2.60 |
2.91 |
2.25 |
1.18 |
0.38 |
0.88 |
1.55 |
2.04 |
1.49 |
2.10 |
20.69 |
|
|
Cutler Dam, UT |
||||||||||||||
|
Average |
Jan |
Feb |
Mar |
Apr |
May |
Jun |
Jul |
Aug |
Sep |
Oct |
Nov |
Dec |
Annual |
|
|
Total ETo (inches) |
0.61 |
0.97 |
2.28 |
3.63 |
5.22 |
6.68 |
7.94 |
6.75 |
4.56 |
2.53 |
1.14 |
0.59 |
42.65 |
|
|
Total ppt (inches) |
1.71 |
1.38 |
1.37 |
1.79 |
1.86 |
0.76 |
0.40 |
0.73 |
1.25 |
1.74 |
1.27 |
1.61 |
16.22 |
|
|
Deseret, UT |
||||||||||||||
|
Average |
Jan |
Feb |
Mar |
Apr |
May |
Jun |
Jul |
Aug |
Sep |
Oct |
Nov |
Dec |
Annual |
|
|
Total ETo (inches) |
0.95 |
1.51 |
3.18 |
4.63 |
6.57 |
8.23 |
9.07 |
7.75 |
5.40 |
3.12 |
1.55 |
0.84 |
52.78 |
|
|
Total ppt (inches) |
0.65 |
0.58 |
0.86 |
0.88 |
0.85 |
0.36 |
0.32 |
0.50 |
0.66 |
0.97 |
0.48 |
0.76 |
7.86 |
|
|
Duchesne, UT |
||||||||||||||
|
Average |
Jan |
Feb |
Mar |
Apr |
May |
Jun |
Jul |
Aug |
Sep |
Oct |
Nov |
Dec |
Annual |
|
|
Total ETo (inches) |
0.71 |
1.19 |
2.74 |
4.07 |
5.73 |
7.19 |
7.70 |
6.49 |
4.54 |
2.63 |
1.30 |
0.64 |
44.47 |
|
|
Total ppt (inches) |
0.47 |
0.49 |
0.61 |
0.71 |
0.87 |
0.53 |
0.70 |
1.09 |
1.13 |
0.94 |
0.44 |
0.65 |
9.00 |
|
|
Echo Dam, UT |
||||||||||||||
|
Average |
Jan |
Feb |
Mar |
Apr |
May |
Jun |
Jul |
Aug |
Sep |
Oct |
Nov |
Dec |
Annual |
|
|
Total ETo (inches) |
0.73 |
1.13 |
2.52 |
3.83 |
5.60 |
7.31 |
8.35 |
7.13 |
4.92 |
2.82 |
1.27 |
0.65 |
46.21 |
|
|
Total ppt (inches) |
1.14 |
0.89 |
1.26 |
1.46 |
1.66 |
0.96 |
0.63 |
1.01 |
1.21 |
1.43 |
1.13 |
1.29 |
14.09 |
|
|
Eden-Liberty, UT *Missing ETo and ppt data from 2000–2010 and missing ETo data from 2014–2016 |
||||||||||||||
|
Average |
Jan |
Feb |
Mar |
Apr |
May |
Jun |
Jul |
Aug |
Sep |
Oct |
Nov |
Dec |
Annual |
|
|
Total ETo (inches) |
0.66 |
0.98 |
2.25 |
3.37 |
4.95 |
6.79 |
7.86 |
6.83 |
4.72 |
2.55 |
1.24 |
0.63 |
43.23 |
|
|
Total ppt (inches) |
2.64 |
1.81 |
1.78 |
1.92 |
2.03 |
0.76 |
0.46 |
0.53 |
1.18 |
1.58 |
2.07 |
1.98 |
18.49 |
|
|
Enterprise Utah, UT *Missing ETo data from 2000–2002; *Used nearby station for ppt data, Little Grassy, UT |
||||||||||||||
|
Average |
Jan |
Feb |
Mar |
Apr |
May |
Jun |
Jul |
Aug |
Sep |
Oct |
Nov |
Dec |
Annual |
|
|
Total ETo (inches) |
1.20 |
1.59 |
3.03 |
4.29 |
6.09 |
7.72 |
8.26 |
7.23 |
5.31 |
3.26 |
1.74 |
1.03 |
50.71 |
|
|
Total ppt (inches) |
2.47 |
2.45 |
1.55 |
1.14 |
0.49 |
0.16 |
1.40 |
1.85 |
1.25 |
1.80 |
1.33 |
3.03 |
19.58 |
|
|
Ephraim, UT |
||||||||||||||
|
Average |
Jan |
Feb |
Mar |
Apr |
May |
Jun |
Jul |
Aug |
Sep |
Oct |
Nov |
Dec |
Annual |
|
|
Total ETo (inches) |
0.80 |
1.25 |
2.75 |
4.10 |
5.96 |
7.70 |
8.67 |
7.33 |
5.20 |
3.05 |
1.50 |
0.77 |
48.91 |
|
|
Total ppt (inches) |
0.71 |
0.80 |
1.01 |
0.87 |
0.87 |
0.55 |
0.52 |
0.72 |
0.87 |
1.03 |
0.68 |
1.17 |
9.86 |
|
|
Escalante, UT |
||||||||||||||
|
Average |
Jan |
Feb |
Mar |
Apr |
May |
Jun |
Jul |
Aug |
Sep |
Oct |
Nov |
Dec |
Annual |
|
|
Total ETo (inches) |
1.25 |
1.73 |
3.31 |
4.78 |
6.69 |
8.29 |
8.69 |
7.51 |
5.47 |
3.36 |
1.80 |
1.10 |
53.90 |
|
|
Total ppt (inches) |
0.89 |
0.75 |
0.72 |
0.36 |
0.51 |
0.40 |
1.27 |
1.49 |
1.17 |
1.43 |
0.54 |
0.71 |
10.26 |
|
|
Eskdale, UT |
||||||||||||||
|
Average |
Jan |
Feb |
Mar |
Apr |
May |
Jun |
Jul |
Aug |
Sep |
Oct |
Nov |
Dec |
Annual |
|
|
Total ETo (inches) |
1.06 |
1.54 |
3.15 |
4.53 |
6.34 |
7.90 |
8.61 |
7.50 |
5.31 |
3.18 |
1.60 |
0.95 |
51.89 |
|
|
Total ppt (inches) |
0.41 |
0.38 |
0.58 |
0.71 |
0.62 |
0.29 |
0.47 |
0.57 |
0.46 |
0.59 |
0.36 |
0.41 |
5.80 |
|
|
Fairfield, UT *Missing ETo data from 2010–2011 |
||||||||||||||
|
Average |
Jan |
Feb |
Mar |
Apr |
May |
Jun |
Jul |
Aug |
Sep |
Oct |
Nov |
Dec |
Annual |
|
|
Total ETo (inches) |
0.85 |
1.25 |
2.79 |
4.13 |
6.06 |
7.39 |
8.37 |
7.23 |
4.94 |
2.96 |
1.43 |
0.81 |
48.08 |
|
|
Total ppt (inches) |
0.76 |
0.89 |
0.81 |
0.71 |
0.59 |
0.43 |
0.51 |
0.58 |
0.55 |
0.73 |
0.42 |
0.87 |
9.64 |
|
|
Ferron, UT |
||||||||||||||
|
Average |
Jan |
Feb |
Mar |
Apr |
May |
Jun |
Jul |
Aug |
Sep |
Oct |
Nov |
Dec |
Annual |
|
|
Total ETo (inches) |
0.92 |
1.35 |
2.76 |
4.14 |
5.75 |
7.34 |
7.85 |
6.64 |
4.78 |
2.89 |
1.46 |
0.82 |
46.99 |
|
|
Total ppt (inches) |
0.55 |
0.57 |
0.56 |
0.41 |
0.67 |
0.43 |
0.74 |
0.73 |
0.90 |
1.06 |
0.34 |
0.52 |
7.75 |
|
|
Fremont Indian SP, UT |
||||||||||||||
|
Average |
Jan |
Feb |
Mar |
Apr |
May |
Jun |
Jul |
Aug |
Sep |
Oct |
Nov |
Dec |
Annual |
|
|
Total ETo (inches) |
1.12 |
1.48 |
2.91 |
4.12 |
6.01 |
7.46 |
8.32 |
7.16 |
5.21 |
3.11 |
1.64 |
0.97 |
49.69 |
|
|
Total ppt (inches) |
0.69 |
0.91 |
0.93 |
1.12 |
0.97 |
0.49 |
1.34 |
1.35 |
0.92 |
1.18 |
0.77 |
0.92 |
11.82 |
|
|
Hanna, UT *Missing ETo data from 2000–2013; *Used nearby station for ppt data, Rock Creek, UT |
||||||||||||||
|
Average |
Jan |
Feb |
Mar |
Apr |
May |
Jun |
Jul |
Aug |
Sep |
Oct |
Nov |
Dec |
Annual |
|
|
Total ETo (inches) |
0.84 |
1.08 |
2.22 |
3.29 |
4.64 |
6.21 |
6.94 |
6.06 |
4.09 |
2.51 |
1.21 |
0.65 |
39.74 |
|
|
Total ppt (inches) |
1.67 |
1.38 |
1.04 |
1.23 |
1.28 |
0.96 |
1.49 |
1.70 |
2.02 |
2.08 |
1.15 |
1.93 |
18.37 |
|
|
Hobble Creek, UT *Missing ETo and ppt data from 2000–2011 |
||||||||||||||
|
Average |
Jan |
Feb |
Mar |
Apr |
May |
Jun |
Jul |
Aug |
Sep |
Oct |
Nov |
Dec |
Annual |
|
|
Total ETo (inches) |
0.88 |
1.12 |
2.21 |
3.17 |
4.58 |
5.94 |
6.80 |
5.89 |
3.94 |
2.26 |
1.19 |
0.70 |
38.83 |
|
|
Total ppt (inches) |
3.14 |
2.52 |
1.95 |
1.65 |
1.48 |
0.43 |
0.81 |
1.46 |
1.88 |
1.38 |
2.18 |
3.35 |
23.21 |
|
|
Horse Hollow-Cove Fort 5W, UT *Used nearby station for ppt data, Kimberly Mine, UT |
||||||||||||||
|
Average |
Jan |
Feb |
Mar |
Apr |
May |
Jun |
Jul |
Aug |
Sep |
Oct |
Nov |
Dec |
Annual |
|
|
Total ETo (inches) |
1.05 |
1.35 |
2.58 |
3.74 |
5.46 |
6.96 |
7.57 |
6.53 |
4.63 |
2.73 |
1.41 |
0.91 |
44.92 |
|
|
Total ppt (inches) |
2.57 |
3.05 |
3.23 |
3.13 |
1.80 |
0.71 |
1.91 |
1.99 |
1.97 |
2.48 |
2.36 |
3.25 |
29.49 |
|
|
Kamas, UT |
||||||||||||||
|
Average |
Jan |
Feb |
Mar |
Apr |
May |
Jun |
Jul |
Aug |
Sep |
Oct |
Nov |
Dec |
Annual |
|
|
Total ETo (inches) |
0.82 |
1.12 |
2.37 |
3.61 |
5.46 |
6.88 |
8.09 |
6.86 |
4.60 |
2.62 |
1.25 |
0.70 |
44.01 |
|
|
Total ppt (inches) |
1.42 |
1.12 |
1.30 |
1.12 |
1.25 |
0.74 |
0.86 |
1.17 |
1.59 |
1.57 |
1.22 |
0.87 |
14.57 |
|
|
Kanab, UT |
||||||||||||||
|
Average |
Jan |
Feb |
Mar |
Apr |
May |
Jun |
Jul |
Aug |
Sep |
Oct |
Nov |
Dec |
Annual |
|
|
Total ETo (inches) |
1.49 |
1.95 |
3.55 |
5.03 |
6.85 |
8.41 |
8.57 |
7.41 |
5.55 |
3.56 |
2.00 |
1.27 |
55.66 |
|
|
Total ppt (inches) |
1.24 |
1.49 |
1.08 |
0.73 |
0.46 |
0.18 |
1.21 |
1.49 |
1.16 |
1.51 |
0.90 |
1.58 |
12.81 |
|
|
La Sal 1SW, UT |
||||||||||||||
|
Average |
Jan |
Feb |
Mar |
Apr |
May |
Jun |
Jul |
Aug |
Sep |
Oct |
Nov |
Dec |
Annual |
|
|
Total ETo (inches) |
0.90 |
1.20 |
2.51 |
3.78 |
5.37 |
7.10 |
7.47 |
6.25 |
4.23 |
2.62 |
1.38 |
0.81 |
44.33 |
|
|
Total ppt (inches) |
0.73 |
0.73 |
0.97 |
0.88 |
0.75 |
0.57 |
1.26 |
1.40 |
1.47 |
1.29 |
0.84 |
0.97 |
11.82 |
|
|
Laketown, UT |
||||||||||||||
|
Average |
Jan |
Feb |
Mar |
Apr |
May |
Jun |
Jul |
Aug |
Sep |
Oct |
Nov |
Dec |
Annual |
|
|
Total ETo (inches) |
0.59 |
0.81 |
1.89 |
3.22 |
4.72 |
6.20 |
7.08 |
5.99 |
4.05 |
2.24 |
1.02 |
0.55 |
38.44 |
|
|
Total ppt (inches) |
1.29 |
1.20 |
1.13 |
1.49 |
1.96 |
0.70 |
0.46 |
0.95 |
1.05 |
1.27 |
1.30 |
1.29 |
14.15 |
|
|
Levan, UT *Missing ETo data from 2008-2009 |
||||||||||||||
|
Average |
Jan |
Feb |
Mar |
Apr |
May |
Jun |
Jul |
Aug |
Sep |
Oct |
Nov |
Dec |
Annual |
|
|
Total ETo (inches) |
0.89 |
1.31 |
2.75 |
4.06 |
5.87 |
7.36 |
8.12 |
7.04 |
4.91 |
2.92 |
1.47 |
0.80 |
47.17 |
|
|
Total ppt (inches) |
0.93 |
1.02 |
1.38 |
1.33 |
1.23 |
0.54 |
0.63 |
0.60 |
0.99 |
1.24 |
0.94 |
1.40 |
12.65 |
|
|
Little Sahara REC AREA, UT *Missing ETo data from 2008-2009 |
||||||||||||||
|
Average |
Jan |
Feb |
Mar |
Apr |
May |
Jun |
Jul |
Aug |
Sep |
Oct |
Nov |
Dec |
Annual |
|
|
Total ETo (inches) |
0.89 |
1.30 |
2.76 |
4.09 |
5.93 |
7.59 |
8.45 |
7.25 |
5.04 |
2.83 |
1.38 |
0.75 |
48.47 |
|
|
Total ppt (inches) |
1.30 |
0.77 |
0.98 |
1.07 |
0.98 |
0.26 |
0.47 |
0.52 |
0.73 |
0.88 |
0.43 |
0.75 |
9.75 |
|
|
Logan 5 SW EXP FARM, UT |
||||||||||||||
|
Average |
Jan |
Feb |
Mar |
Apr |
May |
Jun |
Jul |
Aug |
Sep |
Oct |
Nov |
Dec |
Annual |
|
|
Total ETo (inches) |
0.62 |
0.99 |
2.27 |
3.60 |
5.21 |
6.80 |
8.04 |
6.93 |
4.60 |
2.62 |
1.18 |
0.60 |
43.27 |
|
|
Total ppt (inches) |
1.63 |
1.47 |
1.74 |
1.89 |
1.96 |
0.90 |
0.32 |
0.85 |
1.41 |
1.64 |
1.30 |
1.75 |
16.37 |
|
|
Manila, UT *Missing ETo data from 2000-2007 |
||||||||||||||
|
Average |
Jan |
Feb |
Mar |
Apr |
May |
Jun |
Jul |
Aug |
Sep |
Oct |
Nov |
Dec |
Annual |
|
|
Total ETo (inches) |
0.78 |
1.00 |
2.20 |
3.32 |
4.69 |
5.96 |
7.03 |
5.89 |
4.07 |
2.34 |
1.21 |
0.64 |
40.17 |
|
|
Total ppt (inches) |
0.25 |
0.32 |
0.65 |
0.71 |
1.21 |
0.84 |
0.90 |
0.92 |
0.91 |
0.76 |
0.22 |
0.29 |
7.64 |
|
|
Marysvale, UT *Missing ETo data from 2011-2018 |
||||||||||||||
|
Average |
Jan |
Feb |
Mar |
Apr |
May |
Jun |
Jul |
Aug |
Sep |
Oct |
Nov |
Dec |
Annual |
|
|
Total ETo (inches) |
1.08 |
1.52 |
2.94 |
4.35 |
6.20 |
7.68 |
8.31 |
7.19 |
5.18 |
3.11 |
1.62 |
0.99 |
50.81 |
|
|
Total ppt (inches) |
0.41 |
0.49 |
0.42 |
0.36 |
0.44 |
0.25 |
0.91 |
0.82 |
0.57 |
0.83 |
0.46 |
0.61 |
6.80 |
|
|
McCook Ridge, UT *Used nearby station for ppt data, East Willow Creek, UT |
||||||||||||||
|
Average |
Jan |
Feb |
Mar |
Apr |
May |
Jun |
Jul |
Aug |
Sep |
Oct |
Nov |
Dec |
Annual |
|
|
Total ETo (inches) |
0.91 |
1.24 |
2.46 |
3.63 |
5.37 |
6.92 |
7.50 |
6.30 |
4.40 |
2.58 |
1.30 |
0.78 |
43.29 |
|
|
Total ppt (inches) |
1.57 |
1.48 |
1.37 |
1.23 |
1.01 |
0.73 |
1.61 |
1.76 |
2.03 |
1.69 |
1.28 |
2.04 |
18.49 |
|
|
Mexican Hat, UT *Missing ETo and ppt data from 2020-2022 |
||||||||||||||
|
Average |
Jan |
Feb |
Mar |
Apr |
May |
Jun |
Jul |
Aug |
Sep |
Oct |
Nov |
Dec |
Annual |
|
|
Total ETo (inches) |
1.36 |
1.94 |
3.72 |
5.23 |
7.19 |
8.89 |
8.83 |
7.57 |
5.72 |
3.68 |
1.95 |
1.20 |
57.29 |
|
|
Total ppt (inches) |
0.73 |
0.73 |
0.36 |
0.19 |
0.33 |
0.23 |
0.57 |
0.75 |
0.89 |
0.67 |
0.40 |
0.50 |
6.32 |
|
|
Milford MUNI AP, UT |
||||||||||||||
|
Average |
Jan |
Feb |
Mar |
Apr |
May |
Jun |
Jul |
Aug |
Sep |
Oct |
Nov |
Dec |
Annual |
|
|
Total ETo (inches) |
1.03 |
1.50 |
2.94 |
4.39 |
6.38 |
8.06 |
8.78 |
7.36 |
5.26 |
3.16 |
1.62 |
0.92 |
52.03 |
|
|
Total ppt (inches) |
0.57 |
0.60 |
0.91 |
0.78 |
0.71 |
0.30 |
0.86 |
0.67 |
0.60 |
1.18 |
0.57 |
0.80 |
8.53 |
|
|
Moab, UT |
||||||||||||||
|
Average |
Jan |
Feb |
Mar |
Apr |
May |
Jun |
Jul |
Aug |
Sep |
Oct |
Nov |
Dec |
Annual |
|
|
Total ETo (inches) |
1.16 |
1.80 |
3.55 |
5.10 |
7.16 |
8.50 |
9.03 |
7.78 |
5.72 |
3.51 |
1.80 |
1.06 |
56.28 |
|
|
Total ppt (inches) |
0.57 |
0.64 |
0.73 |
0.72 |
0.70 |
0.36 |
0.91 |
0.93 |
0.90 |
1.06 |
0.62 |
0.89 |
9.04 |
|
|
Neola, UT |
||||||||||||||
|
Average |
Jan |
Feb |
Mar |
Apr |
May |
Jun |
Jul |
Aug |
Sep |
Oct |
Nov |
Dec |
Annual |
|
|
Total ETo (inches) |
0.65 |
1.07 |
2.50 |
3.80 |
5.34 |
6.68 |
7.24 |
6.21 |
4.42 |
2.50 |
1.20 |
0.60 |
42.46 |
|
|
Total ppt (inches) |
0.54 |
0.54 |
0.58 |
0.70 |
0.73 |
0.58 |
0.52 |
0.88 |
1.30 |
1.16 |
0.52 |
0.75 |
8.88 |
|
|
Nephi, UT |
||||||||||||||
|
Average |
Jan |
Feb |
Mar |
Apr |
May |
Jun |
Jul |
Aug |
Sep |
Oct |
Nov |
Dec |
Annual |
|
|
Total ETo (inches) |
0.88 |
1.30 |
2.72 |
3.95 |
5.61 |
7.05 |
7.86 |
6.76 |
4.75 |
2.77 |
1.40 |
0.78 |
45.57 |
|
|
Total ppt (inches) |
1.12 |
1.09 |
1.37 |
1.44 |
1.36 |
0.60 |
0.46 |
0.68 |
0.90 |
1.25 |
1.03 |
1.37 |
12.84 |
|
|
Oak City, UT |
||||||||||||||
|
Average |
Jan |
Feb |
Mar |
Apr |
May |
Jun |
Jul |
Aug |
Sep |
Oct |
Nov |
Dec |
Annual |
|
|
Total ETo (inches) |
0.91 |
1.34 |
2.76 |
4.02 |
5.81 |
7.37 |
8.03 |
6.96 |
4.83 |
2.83 |
1.40 |
0.83 |
47.08 |
|
|
Total ppt (inches) |
1.14 |
1.10 |
1.84 |
1.52 |
1.29 |
0.43 |
0.43 |
0.59 |
0.80 |
1.42 |
0.92 |
1.66 |
13.25 |
|
|
Ogden, UT, Hinkley AP |
||||||||||||||
|
Average |
Jan |
Feb |
Mar |
Apr |
May |
Jun |
Jul |
Aug |
Sep |
Oct |
Nov |
Dec |
Annual |
|
|
Total ETo (inches) |
0.75 |
1.15 |
2.49 |
3.64 |
5.34 |
6.90 |
7.93 |
6.65 |
4.49 |
2.53 |
1.22 |
0.69 |
43.78 |
|
|
Total ppt (inches) |
1.35 |
1.25 |
1.58 |
1.85 |
1.92 |
0.80 |
0.30 |
0.80 |
1.13 |
1.59 |
1.20 |
1.44 |
15.21 |
|
|
Ouray 4 NE, UT |
||||||||||||||
|
Average |
Jan |
Feb |
Mar |
Apr |
May |
Jun |
Jul |
Aug |
Sep |
Oct |
Nov |
Dec |
Annual |
|
|
Total ETo (inches) |
0.55 |
1.16 |
2.99 |
4.58 |
6.57 |
8.26 |
8.97 |
7.64 |
5.28 |
3.02 |
1.38 |
0.59 |
50.92 |
|
|
Total ppt (inches) |
0.31 |
0.32 |
0.61 |
0.58 |
0.75 |
0.38 |
0.45 |
0.51 |
1.06 |
0.92 |
0.39 |
0.39 |
6.62 |
|
|
Pleasant Grove, UT |
||||||||||||||
|
Average |
Jan |
Feb |
Mar |
Apr |
May |
Jun |
Jul |
Aug |
Sep |
Oct |
Nov |
Dec |
Annual |
|
|
Total ETo (inches) |
0.90 |
1.36 |
2.80 |
4.02 |
5.81 |
7.20 |
8.16 |
6.99 |
4.92 |
2.82 |
1.35 |
0.81 |
46.92 |
|
|
Total ppt (inches) |
1.28 |
1.35 |
1.47 |
1.79 |
1.84 |
0.60 |
0.41 |
0.80 |
0.85 |
1.35 |
0.95 |
1.24 |
15.58 |
|
|
Price Carbon CO AP, UT |
||||||||||||||
|
Average |
Jan |
Feb |
Mar |
Apr |
May |
Jun |
Jul |
Aug |
Sep |
Oct |
Nov |
Dec |
Annual |
|
|
Total ETo (inches) |
0.84 |
1.24 |
2.67 |
4.08 |
5.84 |
7.42 |
8.06 |
6.77 |
4.74 |
2.68 |
1.34 |
0.74 |
46.31 |
|
|
Total ppt (inches) |
0.60 |
0.57 |
0.62 |
0.50 |
0.60 |
0.58 |
0.48 |
0.82 |
1.08 |
1.00 |
0.41 |
0.72 |
8.15 |
|
|
Provo BYU, UT |
||||||||||||||
|
Average |
Jan |
Feb |
Mar |
Apr |
May |
Jun |
Jul |
Aug |
Sep |
Oct |
Nov |
Dec |
Annual |
|
|
Total ETo (inches) |
0.94 |
1.44 |
2.93 |
4.30 |
6.13 |
7.84 |
8.72 |
7.35 |
5.14 |
2.97 |
1.45 |
0.86 |
50.05 |
|
|
Total ppt (inches) |
1.57 |
1.41 |
1.45 |
1.79 |
1.67 |
0.63 |
0.42 |
0.78 |
1.20 |
1.54 |
1.25 |
2.01 |
15.71 |
|
|
Richmond, UT |
||||||||||||||
|
Average |
Jan |
Feb |
Mar |
Apr |
May |
Jun |
Jul |
Aug |
Sep |
Oct |
Nov |
Dec |
Annual |
|
|
Total ETo (inches) |
0.61 |
0.97 |
2.31 |
3.69 |
5.42 |
7.07 |
8.30 |
7.05 |
4.72 |
2.58 |
1.13 |
0.60 |
44.67 |
|
|
Total ppt (inches) |
1.83 |
1.74 |
1.99 |
2.36 |
2.26 |
0.90 |
0.40 |
0.85 |
1.59 |
1.82 |
1.44 |
1.80 |
19.30 |
|
|
Rosette, UT |
||||||||||||||
|
Average |
Jan |
Feb |
Mar |
Apr |
May |
Jun |
Jul |
Aug |
Sep |
Oct |
Nov |
Dec |
Annual |
|
|
Total ETo (inches) |
0.71 |
1.03 |
2.16 |
3.21 |
4.75 |
6.00 |
7.09 |
6.13 |
4.27 |
2.39 |
1.09 |
0.60 |
39.94 |
|
|
Total ppt (inches) |
1.07 |
0.82 |
0.72 |
1.00 |
1.35 |
0.64 |
0.65 |
0.75 |
1.09 |
0.88 |
0.63 |
1.19 |
11.28 |
|
|
Salina 24 E, UT |
||||||||||||||
|
Average |
Jan |
Feb |
Mar |
Apr |
May |
Jun |
Jul |
Aug |
Sep |
Oct |
Nov |
Dec |
Annual |
|
|
Total ETo (inches) |
0.73 |
0.94 |
1.98 |
3.03 |
4.50 |
6.14 |
6.66 |
5.61 |
3.99 |
2.26 |
1.08 |
0.65 |
36.89 |
|
|
Total ppt (inches) |
0.91 |
0.92 |
1.07 |
0.80 |
1.06 |
0.66 |
1.35 |
1.37 |
1.19 |
1.47 |
0.67 |
1.16 |
12.46 |
|
|
Santaquin Chlorinator, UT |
||||||||||||||
|
Average |
Jan |
Feb |
Mar |
Apr |
May |
Jun |
Jul |
Aug |
Sep |
Oct |
Nov |
Dec |
Annual |
|
|
Total ETo (inches) |
0.89 |
1.30 |
2.59 |
3.78 |
5.53 |
7.04 |
7.91 |
6.84 |
4.73 |
2.77 |
1.35 |
0.80 |
45.65 |
|
|
Total ppt (inches) |
1.66 |
1.48 |
1.95 |
1.94 |
1.44 |
0.67 |
0.43 |
0.87 |
1.11 |
1.79 |
1.42 |
1.95 |
17.42 |
|
|
Scipio, UT |
||||||||||||||
|
Average |
Jan |
Feb |
Mar |
Apr |
May |
Jun |
Jul |
Aug |
Sep |
Oct |
Nov |
Dec |
Annual |
|
|
Total ETo (inches) |
0.92 |
1.33 |
2.82 |
4.13 |
6.03 |
7.65 |
8.11 |
7.10 |
5.06 |
2.98 |
1.49 |
0.81 |
48.62 |
|
|
Total ppt (inches) |
1.15 |
1.09 |
1.37 |
1.22 |
1.16 |
0.51 |
0.61 |
0.91 |
1.02 |
1.25 |
0.97 |
1.65 |
12.76 |
|
|
Sevier Reservoir-Scipio 9NNE, UT *Used nearby station for ppt data, Scipio, UT |
||||||||||||||
|
Average |
Jan |
Feb |
Mar |
Apr |
May |
Jun |
Jul |
Aug |
Sep |
Oct |
Nov |
Dec |
Annual |
|
|
Total ETo (inches) |
1.01 |
1.44 |
2.83 |
4.05 |
5.86 |
7.48 |
8.30 |
7.13 |
5.10 |
3.00 |
1.53 |
0.88 |
48.45 |
|
|
Total ppt (inches) |
1.15 |
1.09 |
1.37 |
1.22 |
1.16 |
0.51 |
0.61 |
0.91 |
1.02 |
1.25 |
0.97 |
1.65 |
12.76 |
|
|
Spanish Fork PWR HOUSE, UT |
||||||||||||||
|
Average |
Jan |
Feb |
Mar |
Apr |
May |
Jun |
Jul |
Aug |
Sep |
Oct |
Nov |
Dec |
Annual |
|
|
Total ETo (inches) |
0.87 |
1.35 |
2.85 |
4.22 |
5.99 |
7.58 |
8.45 |
7.21 |
4.99 |
2.87 |
1.36 |
0.76 |
48.48 |
|
|
Total ppt (inches) |
1.82 |
1.75 |
2.11 |
2.25 |
1.74 |
0.80 |
0.52 |
0.89 |
1.43 |
1.81 |
1.50 |
2.26 |
18.98 |
|
|
St. George, UT |
||||||||||||||
|
Average |
Jan |
Feb |
Mar |
Apr |
May |
Jun |
Jul |
Aug |
Sep |
Oct |
Nov |
Dec |
Annual |
|
|
Total ETo (inches) |
1.60 |
2.20 |
3.92 |
5.23 |
7.06 |
8.47 |
8.69 |
7.72 |
5.83 |
3.82 |
2.13 |
1.37 |
59.68 |
|
|
Total ppt (inches) |
0.73 |
1.14 |
0.76 |
0.60 |
0.26 |
0.07 |
0.56 |
0.63 |
0.38 |
0.65 |
0.49 |
0.91 |
7.78 |
|
|
Tooele, UT |
||||||||||||||
|
Average |
Jan |
Feb |
Mar |
Apr |
May |
Jun |
Jul |
Aug |
Sep |
Oct |
Nov |
Dec |
Annual |
|
|
Total ETo (inches) |
0.91 |
1.33 |
2.68 |
3.93 |
5.60 |
7.07 |
8.04 |
6.87 |
4.71 |
2.70 |
1.33 |
0.79 |
45.93 |
|
|
Total ppt (inches) |
1.28 |
1.43 |
2.14 |
2.26 |
2.10 |
0.87 |
0.79 |
0.76 |
1.02 |
1.39 |
1.28 |
1.71 |
17.02 |
|
|
Vernal, UT |
||||||||||||||
|
Average |
Jan |
Feb |
Mar |
Apr |
May |
Jun |
Jul |
Aug |
Sep |
Oct |
Nov |
Dec |
Annual |
|
|
Total ETo (inches) |
0.60 |
1.07 |
2.55 |
4.01 |
5.53 |
7.15 |
7.70 |
6.67 |
4.45 |
2.57 |
1.22 |
0.58 |
44.13 |
|
|
Total ppt (inches) |
0.62 |
0.52 |
0.77 |
0.71 |
0.99 |
0.53 |
0.53 |
0.70 |
1.26 |
1.12 |
0.49 |
0.63 |
8.81 |
|
|
Vernon-10 N Utah, UT *Used nearby station for ppt data, Vernon Creek, UT |
||||||||||||||
|
Average |
Jan |
Feb |
Mar |
Apr |
May |
Jun |
Jul |
Aug |
Sep |
Oct |
Nov |
Dec |
Annual |
|
|
Total ETo (inches) |
1.01 |
1.33 |
2.61 |
3.86 |
5.78 |
7.53 |
8.57 |
7.32 |
5.00 |
2.89 |
1.46 |
0.87 |
48.37 |
|
|
Total ppt (inches) |
2.78 |
2.79 |
2.73 |
2.25 |
1.95 |
0.70 |
0.69 |
1.09 |
1.26 |
2.37 |
2.09 |
3.23 |
23.93 |
|
|
Woodruff, UT |
||||||||||||||
|
Average |
Jan |
Feb |
Mar |
Apr |
May |
Jun |
Jul |
Aug |
Sep |
Oct |
Nov |
Dec |
Annual |
|
|
Total ETo (inches) |
0.50 |
0.76 |
2.04 |
3.53 |
5.21 |
6.66 |
7.79 |
6.66 |
4.50 |
2.48 |
1.09 |
0.49 |
41.71 |
|
|
Total ppt (inches) |
0.45 |
0.48 |
0.58 |
0.73 |
1.26 |
0.73 |
0.52 |
0.91 |
1.13 |
1.06 |
0.62 |
0.53 |
8.99 |
|
Conclusion
The data on ETo and precipitation in Utah highlights the substantial variation in water requirements for landscapes across the state. ETo can range from as low as 30s to as high as 50s, with a corresponding significant difference in water needs. For instance, a 10,000 square foot landscape would demand approximately 150,000 gallons of water annually with a lower ETo of 30, and 250,000 gallons with a higher ETo of 50. This example assumes consistent plant types and excludes precipitation, thus emphasizing the critical role that location and climate play in determining irrigation needs. Including precipitation data further enhances precision water budgeting. This fact sheet provides valuable insights for Utah residents interested in accurately estimating and budgeting for landscape water requirements to promote responsible and efficient water management practices throughout the state.
References
-
Nouri, H., Beecham, S., Hassanli, A. M., & Kazemi, F. (2013). Water requirements of urban landscape plants: A comparison of three factor-based approaches. Ecological Engineering, 57, 276–284. https://doi.org/10.1016/j.ecoleng.2013.04.025
-
Pereira, L. S., Alves, I., & Paredes, P. (2023). Crop and landscape water requirements. In Encyclopedia of soils in the environment (pp. 571–592). Elsevier. https://doi.org/10.1016/B978-0-12-822974-3.00044-6
-
Texas A&M School of Irrigation. Landscape water budgeting. Texas A&M AgriLife Extension Service. Retrieved September 12, 2023, from https://irrigation.tamu.edu/files/2018/06/Landscape-Water-Budgeting-manual-8-6-14.pdf.
-
Utah Climate Center. (n.d.). Utah State University. Accessed September 12, 2023, at https://climate.usu.edu/.
-
Vanderkimpen, P. J. (1991). Estimation of crop evapotranspiration by means of the Penman-Monteith Equation (3842) [Doctoral dissertation, Utah State University]. All Graduate Theses and Dissertations, Spring 1920 to Summer 2023. https://digitalcommons.usu.edu/etd/3842.
Published September 2023
Utah State University Extension
Peer-reviewed fact sheet
Authors
Shital Poudyal and Anju Chaudhary

Shital Poudyal
Assistant Professor | Ornamental Horticulture Specialist
Plants, Soils and Climate
Related Research
4R’s of Irrigation Management
The research community and fertilizer industry have developed and utilized a framework termed “4R nutrient management” to help improve fertilizer stewardship. For decades, national and international organizations and institutes such as The Fertilizer Inst
Accurate Irrigation Water Flow Measurement in Pipes
Accurate flow measurement is important to irrigation water management and water rights accounting and protection. Accurate flow measurement is essential in ensuring equitable water distribution to water rights holders and shareholders within irrigation co
County-Level View of Irrigation Trends in Utah and the West
As water demand and scarcity increase simultaneously over the coming decades, water managers and growers will need to optimize water use on their irrigated lands. These challenges have been especially noticeable as the Western U.S.faces a prolonged “megad
Defense Against Drought
Utah’s climate can often be harsh and unpredictable. As the nation’s second driest state, Utah is commonly subject to droughts. Extensive statewide droughts have often lasted 5 to 6 years. It is imperative that farmers are well prepared to defend against
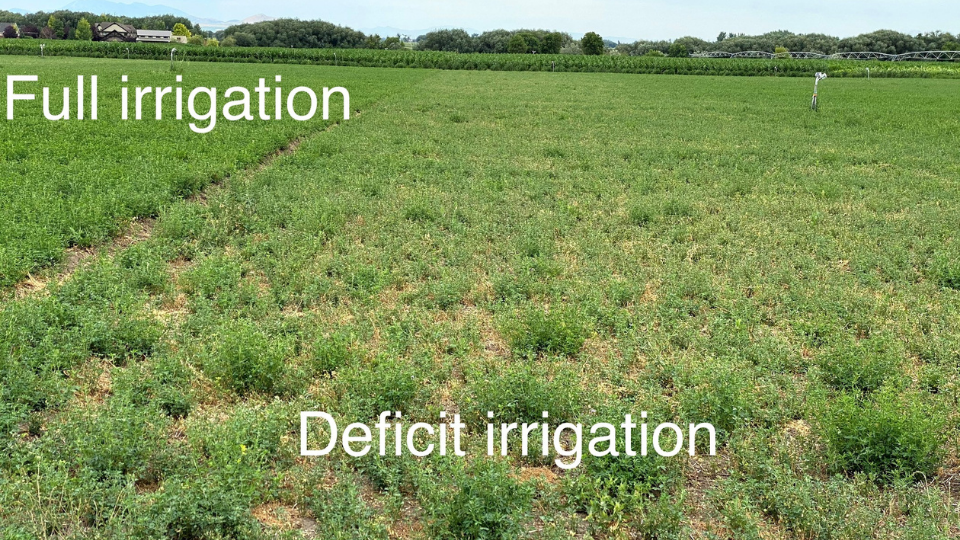
Deficit Irrigation of Pastures
Deficit irrigation is any irrigation level that does not meet the crop’s full evapotranspiration (ET) demand, meaning evaporation from plant and soil surface and transpiration through plant growth.
Drought Tolerance Guide for Alfalfa in Utah
Crop variety selection is one of the most important choices on the farm. Crop genetics determine a significant portion of the yield potential and resource use efficiency. Crop types and genetics that use water more efficiently will become increasingly imp
Economic Feasibility of Solar Photovoltaic Irrigation Systems
The Great Basin is primarily located in Nevada, western Utah, and small sections of southern Oregon and Idaho. The Great Basin is noted for its arid conditions and high percentage of publically owned land. The potential for solar energy generation in the
Energy Conservation with Irrigation Water Management
Irrigators in Utah experienced rapidly increasing energy costs from the mid 1970s to the late 1980s. These costs remain relatively high. Those who are pumping from deep wells are particularly interested in ways to cut back on energy use without doing away
Guide to Irrigation Sprinkler Packages for Pivots and Laterals
Guide to Irrigation Sprinkler Packages for Pivots and Laterals
How Good is Your Water Measurement?
Accurate water measurement is essential to maintaining equity of water delivery within an irrigation company or water districts. Good management of our scarce water resource is dependent upon quantifying supplies and uses with accurate measurement techniq
Irrigation Canal Lining?
Irrigation canals placed in native soil or lined with earth can have seepage water losses varying from 20 percent to more than 50 percent. Well designed, new compacted earth lined canals can have reduced seepage losses similar to concrete lined channels.
Irrigation Water Loss and Recovery in Utah
When deciding which irrigation systems to adopt, permit, or promote, it is important to consider how their efficiency and losses affect the water balance of Utah’s watersheds and drainage basins. Irrigators have no control over precipitation and only limi
Irrigation Water Quality Sampling Guide
The suitability of a water source for irrigation depends on the water quality, and some sources may be altogether unsuitable for practical use.
Managing Saline and Sodic Soils and Irrigation Water
Salt is important in plant and soil management. Excessive salt concentrations in soil can cause water to be less available to plants because of the osmotic forces of salt in the soil water. Excessive concentrations of some salt ions can also be toxic to p
Managing Soil pH for Crop Production in Calcareous-Alkaline Soil
In semiarid soils of the Western U.S., altering soil pH is not easily accomplished nor straightforward. Recall that pH is a measure of the acidity or alkalinity of a substance. More specifically, Utah’s soil pH range can be 1,000 times more acidic or alka
Mobile Drip Irrigation for Pivots and Laterals
New technologies like MDI have the potential to improve irrigation efficiency thereby increasing water available to the crop and conserving water by reducing loss. If you are considering MDI on your farm, it will be important to carefully review its poten
Precision Irrigation Guide for Center Pivots
Precision irrigation is a process involving technology and specialized equipment to improve the efficiency and effectiveness of agriculture irrigation management. This management process is beneficial in allocating water based on spatial variability throu
Soil Sampling Guide for Crops
Why conduct soil sampling for crops? The answer is simple and intuitive for most involved in agriculture. Regular soil sampling, testing, and associated guidance on fertilization and soil amendments help develop and maintain more productive and healthy
Strategies for Deficit Irrigation of Forage Crops
Deficit irrigation strategies with varying effectiveness can be employed in many cases to maximize production and profit. These strategies can include modifying irrigation schedules, concentrating irrigation to critical crop growth stages, reducing rates,
Ten Considerations for Solar-Powered Irrigation in Utah
Generating power from solar energy used to be one of the most expensive options in Utah. This scenario is changing. According to the American Council on Renewable Energy (ACORE, 2021), the cost of solar power production went down by 90% between 2009 and 2
Understanding Irrigation Water Optimization
It is important to consider the possible hydrologic impacts of irrigation optimization efforts to avoid implementing practices that have little appreciable effect relative to the desired outcome. Examples of desired outcomes include increasing supply reli

Utah Surface Irrigation Water Optimization Opportunities and Barriers
This peer-reviewed fact sheet from Utah State University Extension summarizes a statewide survey of surface irrigators, highlighting current practices, barriers, and opportunities for water optimization in Utah agriculture. It emphasizes the importance of
Variable Frequency Drives for Irrigation Pumps
A VFD can make sense in a variety of irrigation applications. Here are 6 of the major applications where one might consider a VFD (also see Henry and Stringham, 2013 and USDA-NRCS, 2010):
Water Rights in Utah
If you are connected to a municipal system, your water is probably categorized as “culinary or municipal water” and is used for everything from drinking and bathing to washing the car to watering tomatoes. However the Utah Division of Water Rights takes a
25 Rules of Thumb for Field Crops
University Extension services are widely known for scientific information on best practices for field crop production. Many Extension experts commonly offer the same tips or "rules of thumb" to growers. This article is certainly not a comprehensive list o
Irrigation Advance Sensors Are Having Large Impacts in Surface Irrigation
There are many good things about surface irrigation, but the labor requirements and large water withdrawals can diminish its feasibility in situations with limited access to labor or water. In this fact sheet, we will describe two of these systems current
Irrigation, Crop, and Soil Management Impacts on Water Use in Pivots/Laterals
This fact sheet explores how irrigation technologies, crop genetics, and soil management practices influence water use efficiency in Utah’s pivot and lateral systems. It highlights research findings using the SMET model to help producers improve water pro