Accurate Irrigation Water Flow Measurement in Pipes
Introduction
Accurate flow measurement is important to irrigation water management and water rights accounting and protection. Accurate flow measurement is essential in ensuring the equitable water distribution to water rights holders and shareholders within irrigation companies. Accurate flow measurement can be used to resolve or even prevent conflicts. And it can help producers ensure they can best use their limited water resources.
Many methods can be used to measure water flow, and different methods and technologies are used for pipe flow compared to open channel (canal) flow. In this fact sheet, we cover only pipe flow and for that, only technologies that are most common in conventional irrigation practice. We also address some basic flow measurement principles and the pros and cons of different measurement technologies.
Flow Measurement Principles
Water Flow Rate
Water flow rates are measured and reported in terms of the volume of water moved per amount of time--for example, gallons per minute (gpm) or cubic feet per second (cfs). A cubic foot per second is sometimes called a second-foot. There are 449 gpm in 1 cfs.
Another way to think about water flow is that the flow rate is equal to the average velocity (or speed) of water multiplied by the flow area:
Flow Rate = (Average Flow Velocity) × (Flow Area)
Example
A pipe has an average flow velocity of 4 feet per second and a cross-sectional area of 0.7 square feet. Find the flow rate. The answer is 4 feet per second × 0.7 square feet = 2.8 cubic feet per second (cfs). This is the same as about 2.8 cfs × 449 gpm/cfs = 1,260 cfs.
Some flow meters work on this principle by measuring the average flow velocity in a pipe and multiplying it by the area. The flow area equals the number pi (π) multiplied by the pipe’s inside radius squared. Recall that π is about 3.14:
Area of a Circular Pipe = π × (Inside Radius)2
Example
The inside diameter of Class 125 iron pipe size (IPS) polyvinyl chloride (PVC) pipe is about 10.05 inches. The radius of this pipe is 10.05 inches ÷ 2 = 5.025 inches. So, the area is π × (5.025 inches)2 = 3.14 × 5.025 inches × 5.025 inches = 79.3 square inches. There are 144 square inches in 1 square foot (12 inches/foot × 12 inches per foot = 144 square inches per square foot). So, 79.3 square inches ÷ 144 square inches per square foot = 0.55 square feet.
Therefore, any difference in the flow area or the velocity conditions from the requirements of a given flow meter will cause errors.
Water Volume
Water is often managed or regulated in terms of an annual water volume. Water volume is computed as the flow rate of water multiplied by the duration of flow:
Volume = (Flow Rate) × (Flow Duration)
When computing volume, the flow duration must have the same time units as the flow rate.
Example
A flow of 1,000 gpm of water is pumped for 60 hours. Find the volume pumped. First, convert the duration time units to minutes to match gpm: 60 hours × 60 minutes per hour = 3,600 minutes. So, 1,000 gpm × 3,600 minutes = 3,600,000 gallons.
Common volume units are gallons, millions of gallons, cubic feet, acre-feet, and acre-inches. An acre-foot is the volume of water it would take to cover an acre of land with water 1 foot deep. An acre-inch is 1/12 of this amount (Table 1).
Table 1. Common Irrigation Volume Conversions
| 1 cubic feet | = | 7.48 gallons |
| 1 acre-foot | = | 43,560 cubic feet |
| 1 acre-foot | = | 12 acre-inches |
| 1 acre-foot | = | 325,851 gallons |
| 1 acre-inch | = | 27,154 gallons |
Example
Convert 3,600,000 gallons into acre-feet. 3,600,000 gallons ÷ 325,851 gallons per acre-foot = 11 acre-feet.
Some flow meters provide an instantaneous flow reading and a totalizer reading. The totalizer is like a vehicle’s odometer, but rather than logging the total distance traveled, it records the total volume of water that has passed through the meter. It is most accurate to use the totalizer for flow records and any type of decision-making. In such a case, one may take an initial totalizer reading, set a timer for several minutes, and then take a second totalizer reading. The flow rate would be computed by calculating the difference between the two totalizer readings and dividing by the elapsed time.
Example
Compute the average flow rate from a meter with an initial totalizer reading of 34,583 gallons and a final reading of 34,758 gallons over a 5-minute period. First, 34,758 gallons – 34,583 gallons = 175 gallons. Now, 175 gallons ÷ 5 minutes = 35 gpm.
Flow Conditions
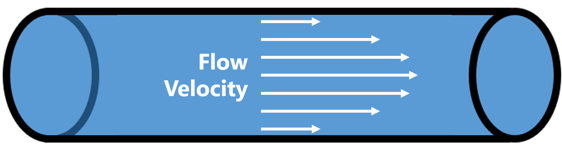
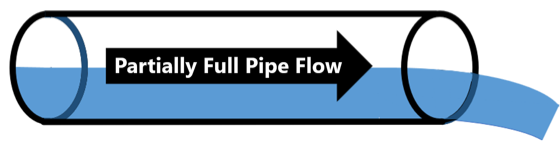
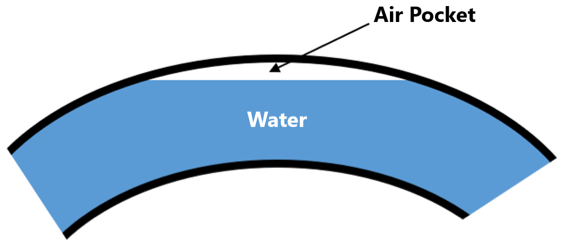
Flow measurement accuracy depends upon the characteristics of flow within the pipe. The speed or velocity of water flowing in a pipe is not the same for all water in the pipe. Water flowing next to the pipe wall flows slower because of friction against the pipe wall, while flow in the center of a pipe flows faster (Figure 1). When water goes through or past a fitting (elbow, tee, reduction, expansion, valve) or through a pump, the flow velocity becomes distorted and no longer follows the pattern shown in Figure 1. This can be a problem for flow measurement accuracy. Many flow meter technologies rely on the type of velocity pattern shown in Figure 1. This type of pattern only develops in pipes that are flowing completely full. Partially full flow can occur when a pipe has an open discharge or when air is trapped in a pipeline (Figure 2 and Figure 3). When a pipe is partially full, the velocity pattern is very different from full pipe flow and the flow area (cross-section) differs also. Many flow meters also rely upon the flow area for flow estimation.
Ensuring Proper Flow Conditions
Proper Velocity Distribution
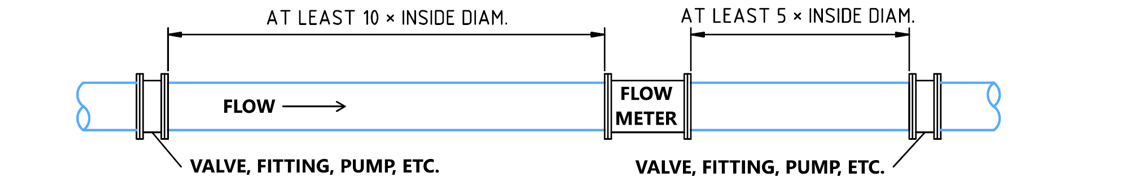
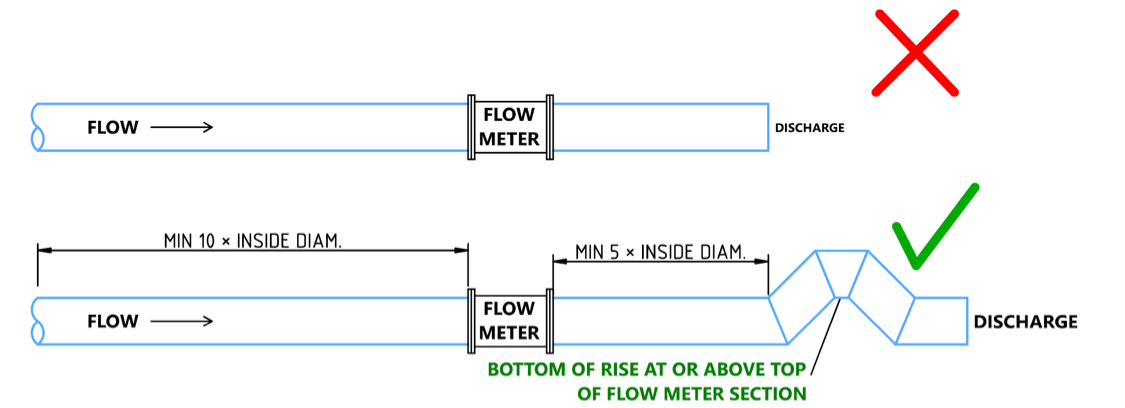
Proper installation and management of a flow meter include taking measures to ensure proper flow conditions. The installation should include a sufficiently long section of straight, full-flowing pipe without fittings so that the desired velocity distribution can develop in the pipe. Generally, this requires that the pipe be straight and free of fittings or valves for at least ten times the inside diameter of the pipe upstream of the flow measurement device and at least five diameters downstream of the device (Figure 4). This can be called the “10-5 Rule.” For example, a flow meter is installed in a 10-inch, Class 100, IPS, PVC pipeline. This type of pipe has an inside diameter of about 10.2 inches. So, the flow meter would need at least 10 × 10.2 inches = 102 inches of straight pipe upstream of the meter and at least 5 × 10.2 inches = 51 inches downstream of the meter. So, this installation would require 102 inches + 51 inches = 153 inches or 12 feet 9 inches of straight pipe (not including the meter length itself).
Exceptions to the 10-5 Rule
The 10-5 Rule is not absolute. Follow manufacturer guidelines regarding installation if they require longer lengths of pipe. However, great care should be taken when following guidelines that suggest smaller distances than the 10-5 Rule unless a qualified, independent, testing laboratory generated the information. That said, some situations and some flow meter technologies may provide accurate measurements with smaller lengths of straight pipe. For example, many flow meters and metering configurations have been tested by the Utah Water Research Laboratory (UWRL) at Utah State University, a world-class water laboratory (https://uwrl.usu.edu/).
The Idaho Department of Water Resources requires flow meters qualifying under their jurisdiction be tested at the UWRL. They have published a list of flow meter models that meet their requirements, available at https://extension.usu.edu/irrigation/measurement and https://idwr.idaho.gov/wp-content/uploads/sites/2/water-measurement/Approved-flow-meter-list-v3.8_4_4_2022.pdf. Under their requirements, electromagnetic meters (magmeters) and spool-type ultrasonic meters may have as little as three times the pipe inside diameter of straight pipe upstream and at least two times the inside diameter of straight pipe downstream of the meter. Other meter types do not meet this recommendation. Note that at this fact sheet’s publication, the State of Utah did not have specific guidelines for agricultural irrigation flow measurement. As such, it is recommended to use those from Idaho.
Researchers in Nebraska found that some spool-type magmeters could function with as little as two pipe inside diameters of straight pipe upstream and one inside diameter of straight pipe downstream (Eisenhauer et al., 2021). However, this would apply only to the model of meter that they tested. Conversely, Taghvaeian (2017) lists examples where much more length is needed than the 10-5 Rule for ultrasonic flow meters.
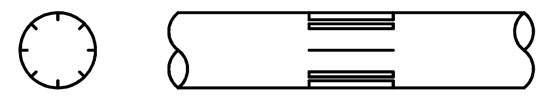
Sometimes, straightening vanes may be placed in a pipe to reduce the necessary straight pipe length (Figure 5). This application may be necessary, for example, with a propeller meter (Eisenhauer et al., 2021).
Full Pipe Flow
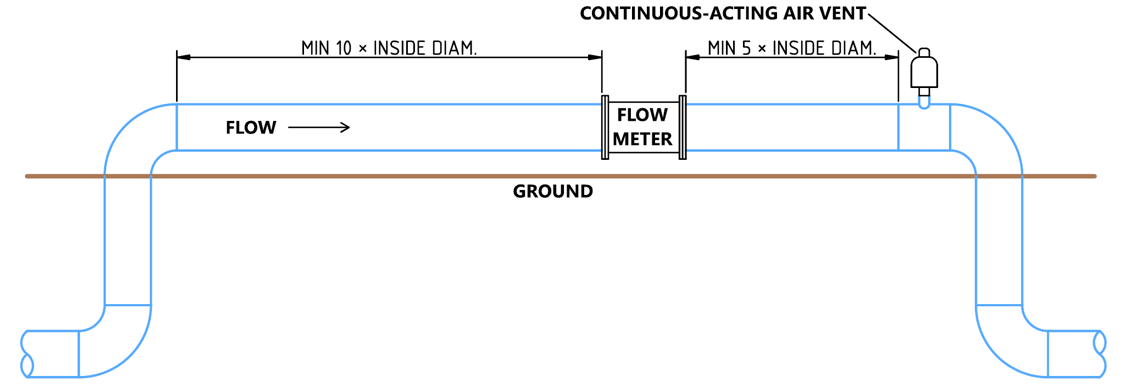
Full pipe flow is not guaranteed even in sprinkler and drip irrigation systems. A flow meter may be positioned in a segment of pipe that could collect air, for example, a segment of aboveground pipe that feeds a buried pipe (Figure 6). Whenever a flow meter is installed in a section of pipe that is higher than the surrounding pipe, a continuous-acting air vent should be installed in the pipe segment to bleed off any entrapped air (Figure 7). An air vent/vacuum release valve that is not continuously acting will not bleed off entrapped air during operation.
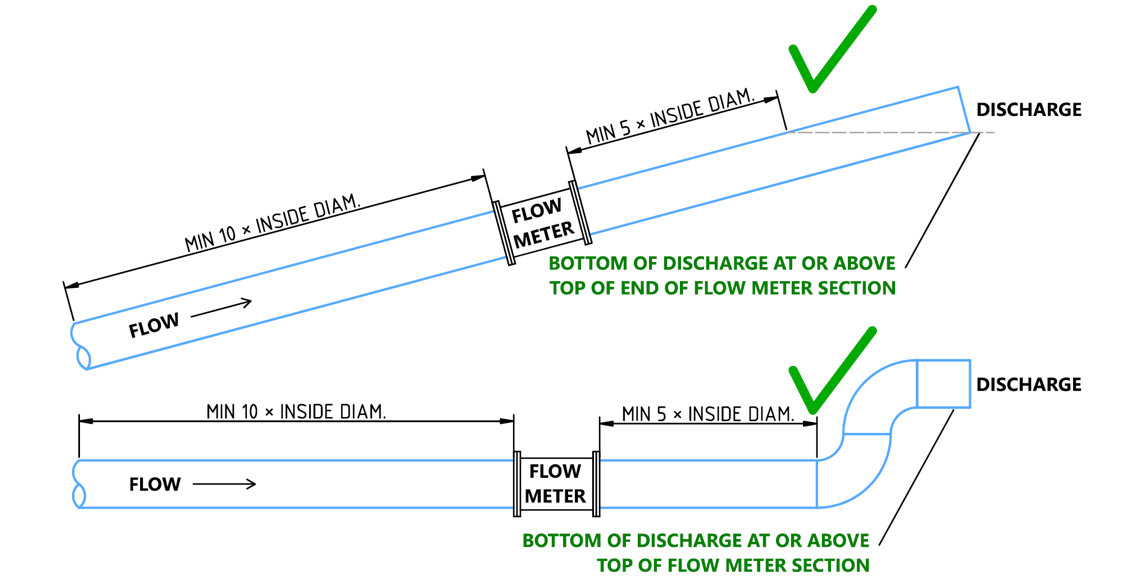
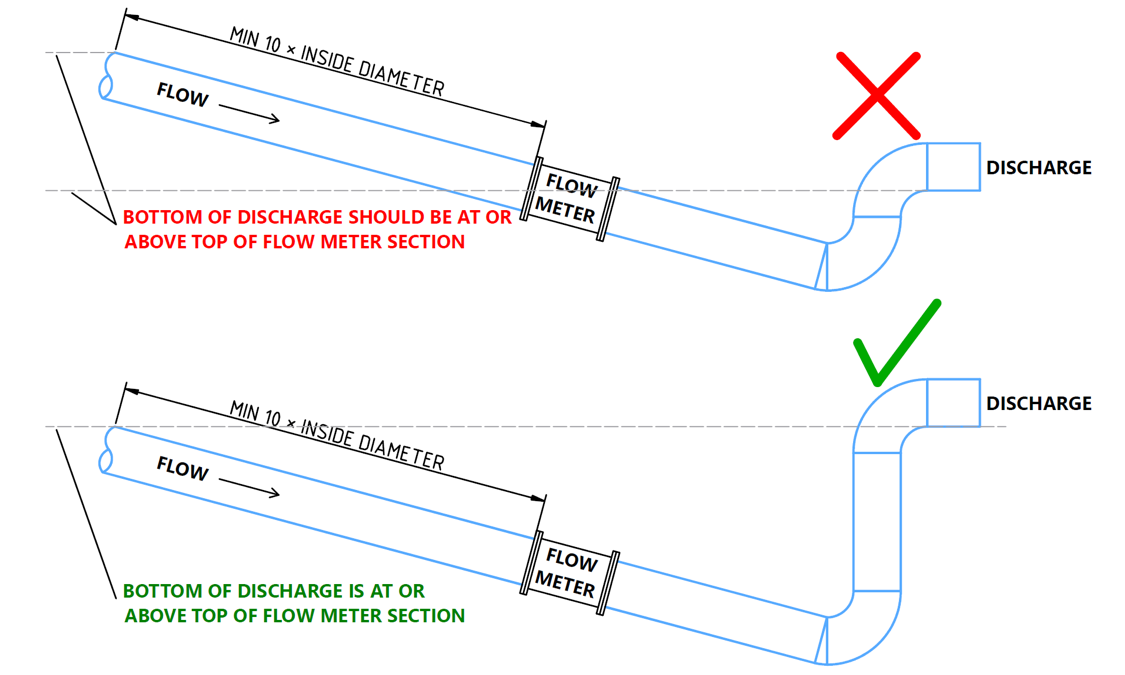
For open discharge systems, like those used to supply a head ditch for surface irrigation, there is often a risk of the pipe flowing partially full. In these cases, a small rise can be added using elbows or pipe miters to ensure the pipe flows fully through the flow meter (Figure 8; Eisenhauer et al., 2021). Other situations may exist or can be designed to ensure full flow through the flow meter (Figure 9). The principle is that the pipe should flow full for the required distances upstream and downstream of the meter (Figure 10).
Finally, many flow meters can be mounted in vertical pipe sections. However, the same required straight pipe distances apply. Manufacturers typically recommend that water flows upward through the pipe section and flow meter (for example, McCrometer, Inc., 2021).
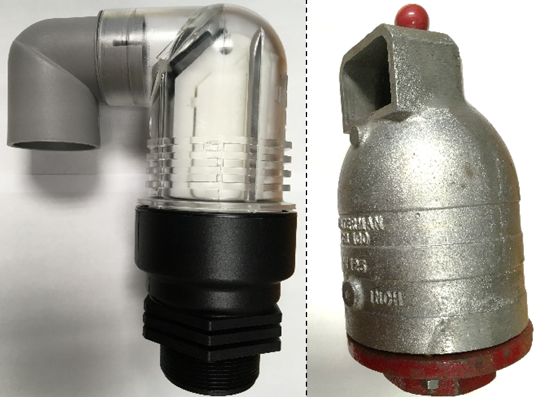
(left) ACV200 Air Control Valve from Nelson Irrigation Corporation, Walla Walla, WA;
(right) CR100 Continuous-Acting Air Vent and Vacuum Relief Valve From Waterman Valve, LLC, Exeter, CA
Flow Meter Types
There are several types of flow meters common in agricultural applications. Flow meters can be categorized by measuring, mounting, and readout methods.
Flow Meter Measurement Types
There are several flow measurement types commonly used to measure water flow in pipelines. Only some of these are common in agricultural irrigation (Table 2). Example photos of some of these technologies are provided in Figure 11.
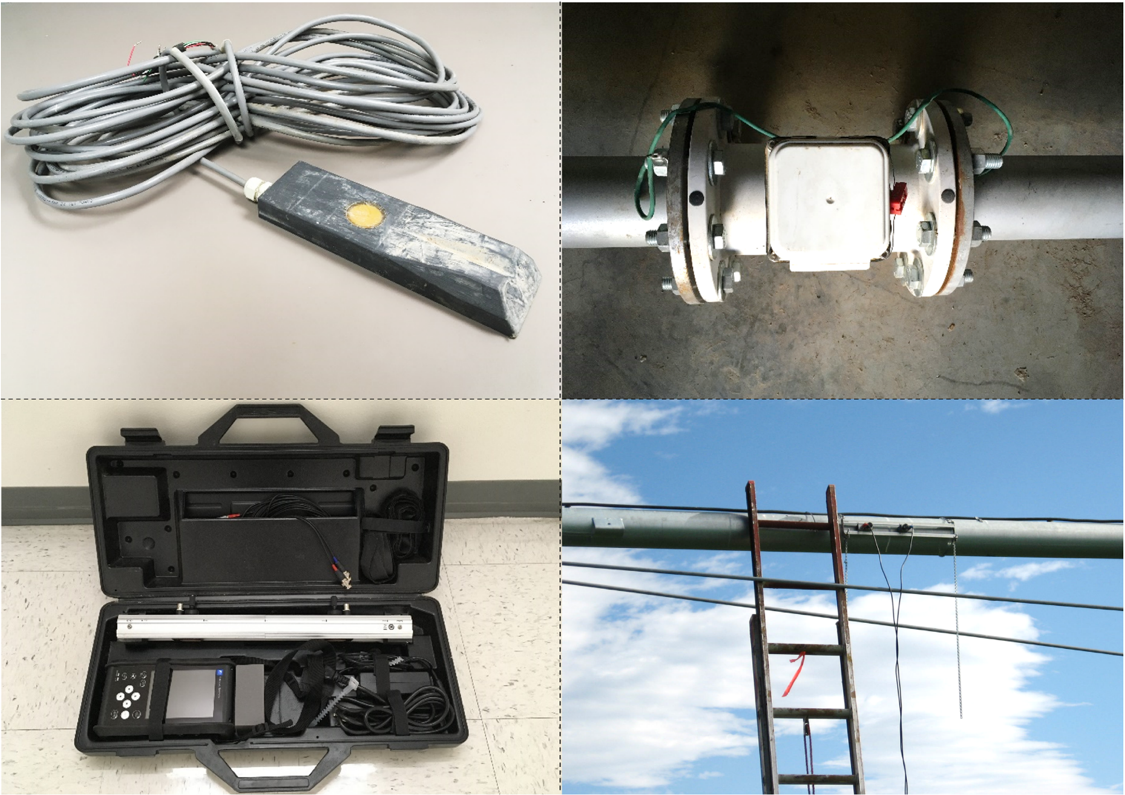
(top left) Doppler Meter for Pipe-Bottom Installation (Can Measure Partially Full Flow); (top right) Spool-Type Magmeter;
(bottom left) Transit Time Flow Meter in Carrying Case; (bottom right) Transit Time Flow Meter Installed on a Center Pivot Lateral
Table 2. Comparing Flow Meter Measurement Types
|
Meter types |
Function |
Used in irrigation? |
Some pros |
Some cons |
|
|
Mechanical meters |
|||||
|
Propeller/ Turbine meter |
A propeller or turbine is placed in the pipe (typically centered and pointed upstream). Velocity is based on the rotational speed of the propeller. |
Yes |
Among the least expensive options. Installation can be easier than other methods. |
Strongly affected by the flow velocity distribution. Prone to mechanical wear, which causes inaccurate readings. The meter can collect debris. |
|
|
Paddle wheel |
A small paddle wheel is placed inside the pipe (typically centered horizontally). Velocity is based on the rotational speed of the paddle wheel. |
Yes |
|||
|
Electronic meters |
|||||
|
Electro-magnetic (mag-meter) |
Generates a magnetic field and measures flow based on distortion of the field. These meters require proper grounding. |
Yes |
One of the more accurate methods. No moving parts. Based on flow rate, not velocity. May require less straight pipe than other methods. |
More costly than some other options. The installation often requires more effort than other technologies. |
|
|
Transit time meter |
Measures the time an ultrasonic wave takes to travel from a transducer through a pipe to a second receiving transducer. The travel time is related to flow velocity. |
Sometimes |
Some can be installed on the outside of a pipe, not requiring additional fittings. No moving parts. |
More costly than some options. The meter must be protected from the elements. Not best for corroded pipes. |
|
|
Doppler meter1 |
Sends sound waves into the water and measures the speed of the waves reflected off particles in the flow. Velocity is based on the speed of the reflected waves. |
Sometimes |
|||
|
Pressure reduction |
|||||
|
Venturi |
A tapered pipe constriction causes a pressure difference in the pipe. The flow velocity is based on the physics of water flow. |
Rarely |
Can be quite accurate. No moving parts. |
Relies on accurate pressure measurements. |
|
|
Orifice plate |
A flat plate with a hole in it is placed in the pipe. The flow velocity is based on the pressure difference between the two sides of the plate and the physics of water flow. |
Rarely |
|||
1 See Masasi et al., 2017.
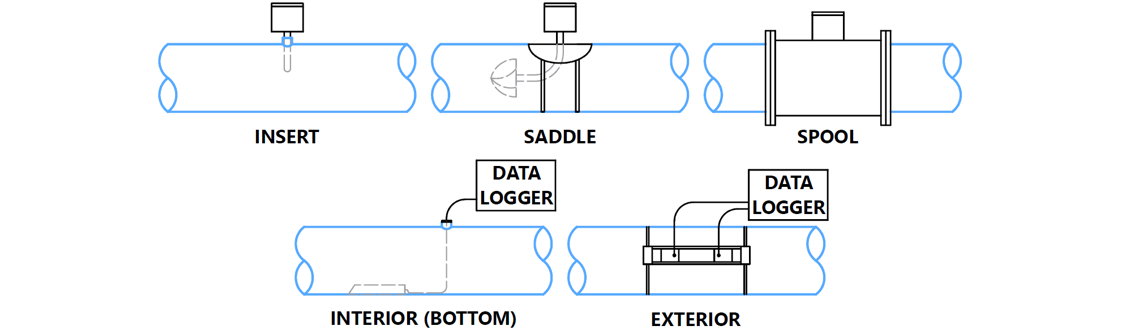
Flow Meter Mounting Types
There are several common methods for mounting pipeline flow meters (Table 3). Some measurement technologies may be available in multiple mounting configurations. Example drawings of some of these mounting methods are provided in Figure 12.
Table 3. Comparing Flow Meter Mounting Types
|
Mounting types |
Description |
Types of meters |
Some pros |
Some cons |
|
Insertion |
The meter is typically cylindrical and of relatively small diameter (< 2"). The meter is inserted through a threaded outlet (tee or half coupler) in the pipe. |
Paddle wheel |
Among the least expensive options. Installation is often relatively simple. |
Strongly affected by the flow velocity distribution. The meter can collect debris. |
|
Saddle |
A hole is cut in the top of the pipe to accommodate the flow meter. The flow meter is attached to a saddle, much like a repair saddle, to cover the hole. |
Propeller/ Turbine |
Among the least expensive options. Installation is often relatively simple. |
Strongly affected by the flow velocity distribution. The meter can collect debris. |
|
Spool/ Fitting |
The meter is a cylindrical fitting, typically flanged, that must be mounted in the pipe and through which water flows. |
Magmeter Turbine |
Can be a more accurate option, depending on the meter technology. |
Can cost more than some options. Installation is often more involved. |
|
Interior wall mount |
The meter is mounted to the inside (often bottom) of the pipe and the sensor cable must be routed out through a fitting or the pipe discharge. |
Doppler |
Among the least expensive options. Installation is often relatively easy. |
The sensor can collect sediment. |
|
Exterior |
Transducers are mounted on the exterior of the pipe. |
Transit time |
The least expensive of mounting methods. |
The mounting location must be protected from the elements. |
Flow Meter Recording Types
The output of flow meter readings can differ among flow meters, with multiple options available for many meters. For example, a meter may only have a manually readable dial, or it may have datalogging capacity and remote access using a cellular connection (Table 4).
Table 4. Comparing Flow Meter Data Output Types
|
Recording types |
Description |
Types of meters |
Some pros |
Some cons |
Notes |
|
Needle/ Totalizer |
An indicator with a needle (like a speedometer) and a rotating totalizer (like an odometer). Measurements are recorded manually. |
Propeller/ Turbine |
Among the least expensive options. |
Often, there is no data logging or remote access. |
The totalizer is more accurate than the needle or instantaneous value. |
|
Electronic display/ Totalizer |
Like a needle/totalizer but a digital display is used. Measurements are recorded manually. |
Propeller/ Turbine |
|||
|
4-20 mA |
An electrical current output is generated ranging from 4 to 20 mA. |
All |
Can be added to many meters to adapt to external dataloggers. These are common outputs readable by many types of dataloggers. |
The signal generator may be an added expense to a meter. It does not include a display or datalogging on its own. Thus, it requires an additional datalogger and telemetry (for remote access). |
|
|
0-5 V |
An electrical voltage output is generated ranging from 0 to 5 V. |
All |
|||
|
Pulse output |
An electrical output is generated with pulses which can be DC (on/off) or AC. |
Many |
|||
|
Digital output |
A digital signal is output by the meter. Common standards include SDI-12, RS-232, and MODBUS. |
Many |
Can be read by many types of dataloggers. |
Digital output may be more expensive than other electrical signal options (above). |
|
|
Built-in datalogging |
The meter is equipped with a built-in datalogger. |
Transit time/ |
No external logger is needed. |
Less common. Data typically needs to be downloaded with a computer. Remote access may not be an option. |
Flow Meter Accuracy
The accuracy of flow measurements depends upon the meter technology, manufacturer, installation, maintenance, and other factors (Table 5). It is important to consider the accuracy of a meter before purchase. Select meters with no greater than ±2% flow error in the range of expected flow rates. Sensor accuracies will often be described as a percentage plus or minus the measured flow rate. Some accuracies are described in terms of a percentage of velocity measurement and a separate percentage of flow depth measurement (for example, doppler meters used for partially full flow measurement). A rough approximation is to combine those accuracies as follows:
Total Accuracy % = 100 - (1 - (Velocity Accuracy %) / 100) × (1 - (Depth Accuracy %) / 100) × 100
Example
A flow meter has a depth accuracy of ±2% and a velocity accuracy of ±5%. Compute the total accuracy.
The answer is:
total accuracy = 100 – (1% – 2% ÷ 100) × (1% – 5% ÷ 100) × 100 = 100 - (1 – 0.02) × (1 – 0.05) × 100 = 100 – 0.98 × 0.95 × 100 = 100 – 0.931 × 100 = 100 – 93.1 = 6.9%.
The total accuracy of the meter is ±6.9% of the reading. So, if the meter measured a flow of 100 gpm, the accuracy would be ±0.069 × 100 gpm = ±6.9 gpm. The actual flow could be anywhere from 93.1 gpm to 106.9 gpm.
Some accuracies are presented as a percentage of the full range, meaning the full sensor range. If the sensor range is 10 gpm to 1,000 gpm and the accuracy is ±1% of the full range, then the accuracy is (1,000 gpm – 10 gpm) × 1% ÷ 100 = 9.9 gpm. This accuracy is approximately ±1% at 1,000 gpm but nearly ±100% at 10 gpm. Some accuracies are also provided in absolute terms, like ±1 gpm or a combination of the above-stated methods.
It is important to understand that the accuracy of many types of sensors can drift, or decrease, over time. This is true for many types of flow meters. For example, Masasi and others (2017) found sensor drift in some types of ultrasonic sensors. Sensors that have moving parts are subject to bearing wear and subsequent calibration drift. Follow manufacturer recommendations for maintenance and recalibration.
Table 5. Comparison of Potential Flow Meter Accuracy and Equipment Cost
|
Flowmeter type |
Mount type |
Claimed accuracy1 |
Potential 2022 cost4 |
|
Magmeter |
Spool |
±0.2%–0.75%a |
$380–$450 per diameter incha |
|
Magmeter |
Insertion |
±0.5%–10%2,b |
$1,500–$2,500a |
|
Paddle wheel |
Insertion |
±3%–10%c |
~$1000a |
|
Propeller/Turbine |
Saddle |
±2%d |
$1,000 + $80 per diameter inchb,c |
|
Propeller/Turbine |
Weld-on saddle |
±2%d |
$180 per diameter inch, more for |
|
Propeller/Turbine |
Spool |
±2%d |
$370 per diameter inchb |
|
Ultrasonic |
Exterior |
±1%–1.5%3,e |
$7,100–$11,000a |
|
Ultrasonic |
Insertion |
±1%g |
~$7,200d |
|
Ultrasonic |
Interior wall |
±1%–2%f |
$8,200–$11,400d,e |
1As reported by the manufacturers. Accuracies may differ from the manufacturer’s statements (see Masasi et al., 2017). Accuracies should be obtained from a qualified, third-party testing facility. Sensors may also be subject to calibration drift. Manufacturers/sources included: aBadger Meter, FloCat, Instrumart; bGeorge Fischer Signet, Instrumart, Seametrics, McCrometer; cGeorge Fischer Signet, Instrumart; dDirect Pivot Parts, Geyser, Insrumart, McCrometer; eBadger Meter, Fuji Electric, Instrumart, Panametrics; fIn-Situ, Measuring and Control Equipment, Sontek; gIn-Situ, Measuring and Control Equipment. Information was retrieved November 2022.
2Depends on the flow rate and manufacturer.
3Masasi and others (2017) found the range to be much larger and to be biased low.
4Based on costs from online sources and quotes. Costs do not include installation, including pipe cutting, welding, flanges, half couplings, or other materials. Costs typically include signal output (for example, 4-20 mA), and many include totalizer displays. Only ultrasonic and area-velocity meter costs include data datalogging capability. The cost for a datalogger and telemetry can vary depending on the manufacturer and customization. For example, a datalogger may be less than $300 but may be $1,350 or more if telemetry is added. Telemetry service and data hosting services are often an additional annual cost. Sources include: aInstrumart; bDirect Pivot Parts; cMcCrometer, dIn-Situ; eSonTek. Costs are from November 2022.
Flow Meter Cost
The cost of flow meters depends upon the technology, mounting type, data collection system, manufacturer, installation, longevity, and maintenance. Maintenance and longevity information is difficult to obtain, but many equipment dealers can provide general information on these subjects. Table 5 contains a range of installation costs for different flow meter technologies.
Summary
When considering a pipeline flow meter, it is important to consider the meter technology and ensure proper flow conditions. When no other information is available, apply the 10-5 Rule. The meter’s accuracy should be no greater than ±2% of the flow as tested by a reputable third party. It is important to consider sensor accuracy drift and maintain the meter to minimize drift. Consult equipment dealers regarding the expected longevity of the flow meter under consideration. The cost of flow measurement includes not only the meter itself but also the cost of installation, maintenance, signal output, datalogging, remote access telemetry, and data hosting services. Considered both accuracy and cost when selecting a flow meter because the value of the right to use water in crop production is so great.
Disclaimers
All figures and photos are by Burdette Barker and require attribution.
References
-
Eisenhauer, D. E., Martin, D.L., Heeren, D. M. & Hoffman, G. J. (2021). Irrigation systems management. American Society of Agricultural and Biological Engineers. https://asabe.org/ism
-
Masasi, B., Frazier, R. S., & Taghvaeian, S. (2017). Review and operational guidelines for portable ultrasonic flowmeters [Fact sheet BAE-1535]. Oklahoma State University Extension.https://extension.okstate.edu/fact-sheets/review-and-operational-guidelines-for-portable-ultrasonic-flowmeters.html
-
McCrometer, Inc. (2021). Ultra mag electromagnetic flow meter: Installation, operation and maintenance manual [30119-03 Rev. 6.6]. https://www.mccrometer.com/ultra-mag/product-downloads?id=52003823655
-
Taghvaeian, S. (2017). Irrigation water flow measurement [Fact sheet BAE-1502]. Oklahoma State University Extension. https://extension.okstate.edu/fact-sheets/irrigation-water-flow-measurement.html
Published April 2023
Utah State University Extension
Peer-reviewed fact sheet
Authors
Burdette Barker Irrigation Specialist, Cody Zesiger, and Matt Yost


Cody Zesiger
Extension Assistant Professor | Agriculture & Natural Resources | Davis County

Related Research
2015 Costs and Returns for Flood Irrigated Alfalfa, Box Elder County
Enterprise budgets are the building blocks of a farm or ranch. They represent estimates of income and expenses for a specific period of time using a set of production practices and inputs for that enterprise.

2015 Costs and Returns for Irrigated Soft White Wheat, Box Elder County
Enterprise budgets are the building blocks of a farm or ranch. They represent estimates of income and expenses for a specific period of time using a set of production practices and inputs for that enterprise.

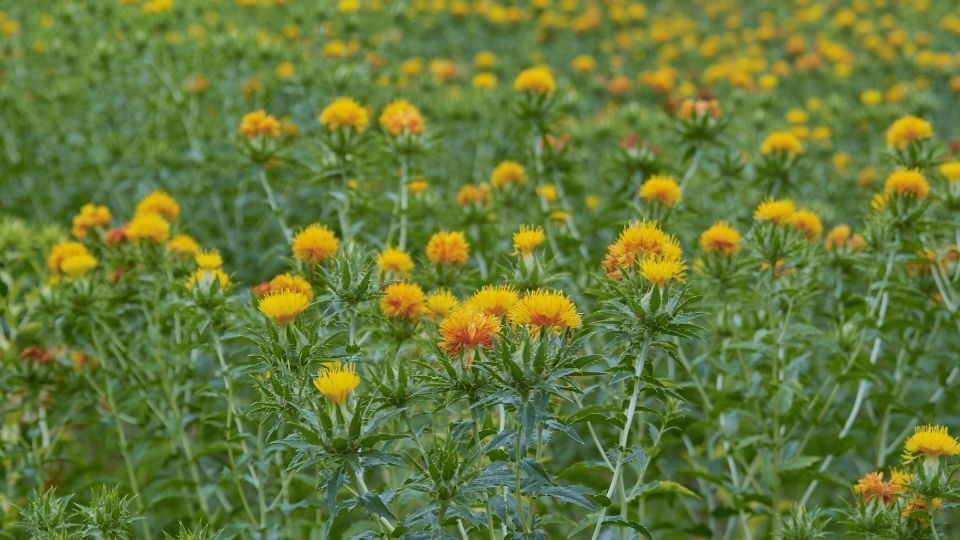
2019 Costs and Returns for Irrigated Safflower, Northern Utah
Enterprise budgets are the building blocks of a farm or ranch. They represent estimates of income and expenses for a specific period of time using a set of production practices and inputs for that enterprise. This research contains sample costs and return
2022 Costs and Returns for Non-irrigated Flax in Utah
Enterprise budgets are created to help a grower to understand all the costs and returns associated with producing a crop and are usually expressed on a per-unit basis, such as per acre.
4R’s of Irrigation Management
The research community and fertilizer industry have developed and utilized a framework termed “4R nutrient management” to help improve fertilizer stewardship. For decades, national and international organizations and institutes such as The Fertilizer Inst

50 Common Questions About Field Crops
Utah State University (USU) Extension strives to provide research-based information and knowledge to help agricultural producers. Producers often have questions about several aspects of field crop production. This article is not comprehensive of all ques
Accurate Irrigation Water Flow Measurement in Pipes
Accurate flow measurement is important to irrigation water management and water rights accounting and protection. Accurate flow measurement is essential in ensuring equitable water distribution to water rights holders and shareholders within irrigation co
Adopting Organic Wheat: Grower Motivations and Concerns
A recent study of wheat producers in the western United States found that wheat growers were actually transitioning out of organic production due to concerns about pest control and profitability. This fact sheet provides an overview of the study results b
Agricultural Irrigated Land and Irrigation Water Use in Utah
This article is a summary of several estimates of the extent of agricultural irrigation in Utah and some associated trends.

Agricultural Producers’ Motivations and Challenges With Improving Soil Health in Utah
This study examines Utah agricultural producers' motivations and challenges in adopting soil health practices. It highlights the lack of localized resources and transferable knowledge as barriers, while emphasizing producers' desire to gain insights, enha

Agriculture Water Use and Economic Value in the Great Salt Lake Basin
This fact sheet provides information about the following topics in the context of the Great Salt Lake and its basin: Great Salt Lake facts, Human effects on the size of the lake, Changes to population and land use, Agricultural water use, Agriculture and

Aphids in Alfalfa
Aphids belong in the order Hemiptera and family Aphididae. Aphids are common insects in field and forage crops, with at least six kinds in Utah alfalfa. Aphids can be distinguished from other insects in alfalfa with a hand lens. In general, aphids are sof
Barley yellow dwarf virus (BYDV)
Barley yellow dwarf virus (BYDV) is found worldwide. It infects small grains like barley, wheat, oats and rice as well as many wild grass species. There are two strains of the barley yellow dwarf virus: BYDV-MAV and BYDV-PAV.
Boom Sprayer Calibration for Pesticide Applications
To protect your investment in agricultural pesticides, a boom sprayer should be calibrated at the start of the season and whenever application conditions change. Also, sprayer output should be periodically checked throughout the season to assure proper ap
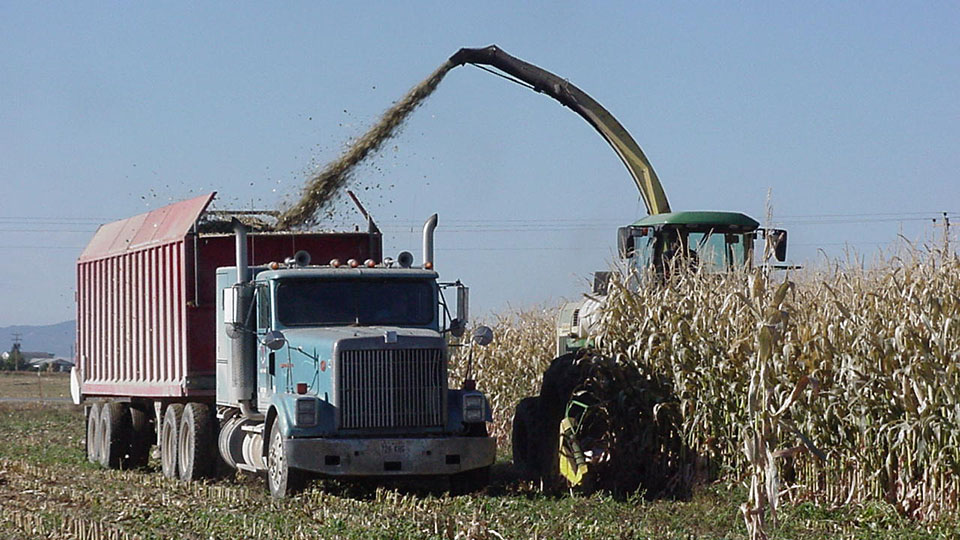
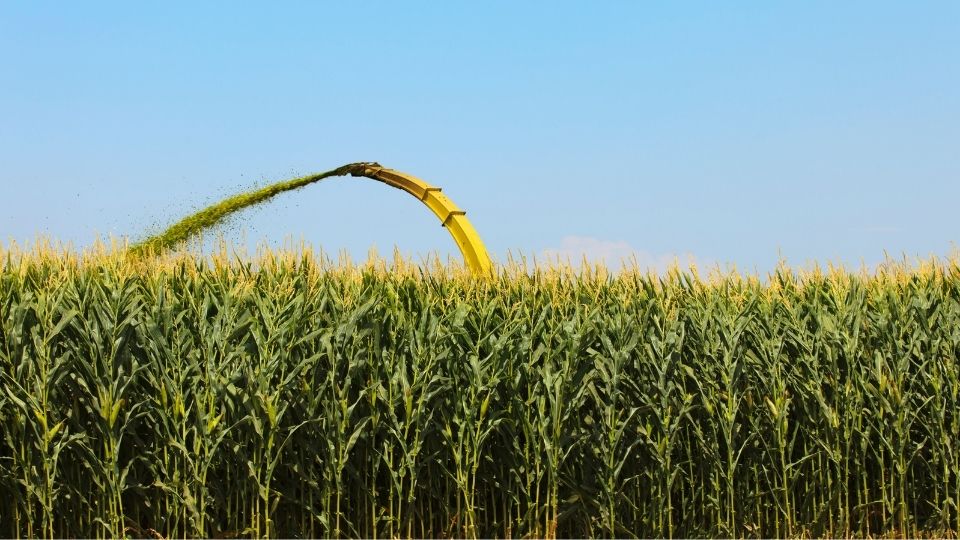
Buying and Selling Corn Silage or Other High Moisture Feeds: Value the Feed not the Water
Alfalfa is the most important crop in Utah, both in terms of acreage and revenue. Although often overlooked, one of the most critical decisions made in alfalfa production is determining which variety to plant. This report summarizes dry matter (DM) yields
Characteristics of Organic Wheat Growers
A recent study was conducted with wheat growers in the western U.S. which found notable differences in the grower and farm characteristics that influence organic adoption, including older age and the lack of importance of gender and farming experience. Th
Chopping and Storing Quality Corn Silage
Properly harvested and stored, corn silage is extremely palatable, superior to other forages in energy content, a great fiber source, and relatively consistent in quality. The high palatability of corn silage encourages feed intake which contributes to hi

Comparison of Three Traps Used for Pocket Gopher Management (Thomomys Bottae) in Alfalfa Fields
Valley pocket gophers (Thomomys bottae) are a common agricultural pest in many areas of Utah, Nevada and California. Pocket gophers predominantly eat roots, although they will pull vegetation into their burrows, and eat plants immediately adjacent to thei
Considerations for Crop Rotation from Alfalfa to Corn
The importance of rotating out of a declining alfalfa stand is well established. As the alfalfa stand ages, forage yield and quality decline, while weed, insect, and disease pressures increase.
Corn Earworm
In Utah, there are typically three generations of corn earworm (CEW) each year. The first generation of adults either come from overwintering pupae (southern and central Utah) or migrate into northern Utah. The adult moth is tannish brown with a 1 1/2 inc
Corn Silage Variety Performance
This report summarizes on-farm performance of irrigated silage corn hybrids at Benson (Cache County) in 2006. The site is at 4439 ft elevation and has a long-term average of 2800 corn growing degree days (50/86° F) per year. Hybrids were seeded with a six
Costs and Returns for Non-Irrigated Safflower
Enterprise budgets are the building blocks of a farm or ranch. They represent estimates of income and expenses for a specific period of time using a set of production practices and inputs for that enterprise. Tables in this research is intended to be a gu

Costs and Returns for Roundup Ready™ Grain Corn
Enterprise budgets are the building blocks of a farm or ranch. They represent estimates of income and expenses for a specific period of time using a set of production practices and inputs for that enterprise. This research contains sample costs and return

Costs and Returns for Roundup Ready™ Silage Corn
Enterprise budgets are the building blocks of a farm or ranch. They represent estimates of income and expenses for a specific period of time using a set of production practices and inputs for that enterprise. This research contains sample costs and return
County-Level View of Irrigation Trends in Utah and the West
As water demand and scarcity increase simultaneously over the coming decades, water managers and growers will need to optimize water use on their irrigated lands. These challenges have been especially noticeable as the Western U.S.faces a prolonged “megad
Cover Crops for Utah
The purpose of this fact sheet is to provide the current state of knowledge on cover crop management for Utah based on USU research and local grower experience.

Crop Advisor Approaches to Soil Health Advising and Opportunities for Improvement
The report highlights that crop advisors in Utah and Idaho are increasingly addressing soil health, though barriers like cost, lack of localized information, and disagreements about soil health practices persist. Advisors from the NRCS are the most active

Crop Revenue Coverage 2007 Commodity Insurance Fact Sheet
Crop Revenue Coverage(CRC), provides revenue protection against a yield loss, a price decline, or a combination of both. CRC is available for these crop and counties Beaver, Box Elder, Cache, Carbon, Davis, Duchesne, Emery, Garfield, Iron, Juab, Millard,
Defense Against Drought
Utah’s climate can often be harsh and unpredictable. As the nation’s second driest state, Utah is commonly subject to droughts. Extensive statewide droughts have often lasted 5 to 6 years. It is imperative that farmers are well prepared to defend against
Deficit Irrigation of Pastures
Deficit irrigation is any irrigation level that does not meet the crop’s full evapotranspiration (ET) demand, meaning evaporation from plant and soil surface and transpiration through plant growth.
Diagnostic Testing for Nitrogen Soil Fertility
Environmental concerns over nitrate contamination of ground water, and the desire of land managers to increase the efficiency of their fertilizer investment, can both be satisfied more completely through diagnostic testing for nitrogen (N) soil fertility.
Downy Mildew of Alfalfa
Downy mildew is an obligate parasite. Even though they look like fungi they are not. They belong to the Oomycota and are more closely related to algae than true fungi. The most common alfalfa downy mildew species in the USA is Peronospora trifoliorum. In
Drought Tolerance Guide for Alfalfa in Utah
Crop variety selection is one of the most important choices on the farm. Crop genetics determine a significant portion of the yield potential and resource use efficiency. Crop types and genetics that use water more efficiently will become increasingly imp
Drought Tolerance Guide for Corn in Utah
Crop variety selection is one of the most important choices on the farm. Crop genetics determine a significant portion of the yield potential and resource use efficiency. Crop types and genetics that use water more efficiently will become increasingly imp
Drought Tolerance Guide for Small Grains in Utah
Crop variety selection is one of the most important choices on the farm. Crop genetics determine a significant portion of the yield potential and resource use efficiency.
Dwarf Bunt in Winter Wheat
The disease first appeared in Utah in the early 1930s in Cache County near the city of Paradise. The disease was soon found in Box Elder County near Hansel Valley. The outbreak of dwarf bunt became so severe that it affected other crops, such as barley.
Easy Calibration for Backpack and Canister (Handheld) Sprayers
If sprayers are not properly calibrated, it can result in over or under-application of chemicals, causing damage, reduced pest control, and potential safety concerns. Making the effort to properly mix chemicals and calibrate sprayers can save money and in
Easy Calibration for Boom Sprayers
Making the effort to properly mix chemicals and calibrate sprayers can save money and headaches in the long run. This fact sheet provides simple guidelines for calibrating boom sprayers.
Economic Feasibility of Solar Photovoltaic Irrigation Systems
The Great Basin is primarily located in Nevada, western Utah, and small sections of southern Oregon and Idaho. The Great Basin is noted for its arid conditions and high percentage of publically owned land. The potential for solar energy generation in the
Energy Conservation with Irrigation Water Management
Irrigators in Utah experienced rapidly increasing energy costs from the mid 1970s to the late 1980s. These costs remain relatively high. Those who are pumping from deep wells are particularly interested in ways to cut back on energy use without doing away

Evapotranspiration and Precipitation Data for Calculating Irrigation Water Requirements in Utah
In this fact sheet, we calculated average reference evapotranspiration and precipitation data for multiple locations in Utah, USA. To accomplish this, we collected the data from the Utah Climate Center and compiled it to show an average of 20 years of dat
Fertigation Facts
The purpose of this fact sheet is to provide general information on forms of fertigation for primary plant nutrient, fertigation timing, and fertigation economics.
Grass Pasture Response to Water and Nitrogen
The objective of this project is to study the response of pasture grass varieties to weather, irrigation, and fertility in a field experimental plot at a high elevation. The water variable is accomplished with a line source sprinkler irrigation system. Tw
Growing Safflower in Utah
Northern Utah growers produced approximately 23 million pounds of safflower second only to California in U.S. production.
Guide to Irrigation Sprinkler Packages for Pivots and Laterals
Guide to Irrigation Sprinkler Packages for Pivots and Laterals
Guide to Pivot Track Management
Center pivot irrigation systems are the most popular form of irrigation in the western United States. A significant problem with center pivots is wheel track rutting. Deep wheel tracks can cause overirrigation because the pivot moves slower than intended
How Good is Your Water Measurement?
Accurate water measurement is essential to maintaining equity of water delivery within an irrigation company or water districts. Good management of our scarce water resource is dependent upon quantifying supplies and uses with accurate measurement techniq