Irrigation Water Loss and Recovery in Utah
When deciding which irrigation systems to adopt, permit, or promote, it is important to consider how their efficiency and losses affect the water balance of Utah’s watersheds and drainage basins. Irrigators have no control over precipitation and only limited control of surface waters entering and leaving the state (Figure 1), as most of those are controlled by legal agreements. However, Utah’s water managers, elected officials, and water users can consider how surface water flows and groundwater storage is affected by using more efficient irrigation systems.
Sprinkler, surface, or drip irrigation systems each have trade-offs in irrigation application efficiency, cost, and other factors. While some irrigation systems can be more efficient than others, the destination of consumptive uses, or “lost water,” is a vital consideration for long-term water balance management. Some irrigation system types have losses that are potentially more recoverable compared to others. To make comparisons between systems, this fact sheet1 will define irrigation application efficiency, describe the destinations of irrigation water losses, and discuss how the fraction of recoverable water losses differ for various irrigation delivery systems and what that means for the overall water balance in Utah.
Highlights
- Irrigation systems (sprinkler, surface, and drip) have different application efficiencies typically ranging from 50%-99%.
- Application water “losses” are different for each irrigation system type; losses include evaporation, runoff, deep percolation, and wind drift.
- Recovery, return flow or reuse of lost water also varies among irrigation systems and needs to be considered in relation to application efficiency when evaluating and selecting irrigation systems.
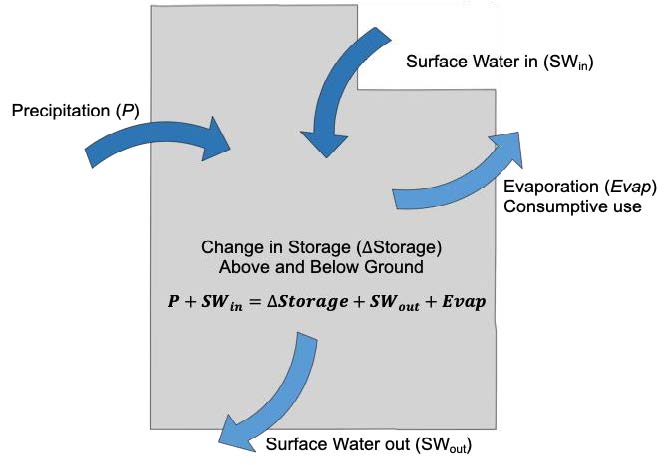
Figure 1. Simplified Depiction of Utah’s Water Balance
Note. Considering the long-term water balance of Utah as a whole, irrigators and water managers have more control of irrigation and tillage, affecting change in water storage and consumptive use.
Irrigation Application Efficiency
Irrigation application efficiency (Ea) can be defined as:
Ea = irrigation water stored in the root zone ÷ irrigation water delivered to the field
Ea is a useful calculation because it allows for comparison among different irrigation systems (Table 1) regardless of the source of “lost” water. It is also important to note Ea is also dependent upon system design, soils, management, and maintenance. The term water loss is used here to describe applied irrigation water that either does not infiltrate into the soil (sprinkler droplet wind drift, evaporation, or surface runoff) or drains below the crop root zone (deep percolation) (Figure 2). Deep percolation associated with salt leaching requirements is considered a loss in the above definition, though it is considered a beneficial water use (Heermann & Solomon, 2007). Rather than considering soil surface evaporation as a “loss,” in the above definition of Ea, the water evaporated from the soil surface is part of evapotranspiration—in other words, consumptive water use.
Tillage is also a factor that affects water loss and overall Ea. It is used for crop establishment and weed control but is a source of evaporative soil water loss. Conventional tillage practices, including plowing and disking, disturb the soil, temporarily increasing evaporation and water infiltration. Conservation tillage, on the other hand, including no-till, reduced, and minimum tillage, disturbs less soil and reduces evaporative losses (O’Brian & Daigh, 2019). While tillage is an important consideration for overall water balance, it is not the focus of this paper.
Table 1
Average Irrigation Application Efficiency (Ea) Various Some Irrigation Systems
| Ea | Irrigation systems and conditions |
|---|---|
| 60%-80% | Line-source sprinkler systems, such as hand line or wheel line. |
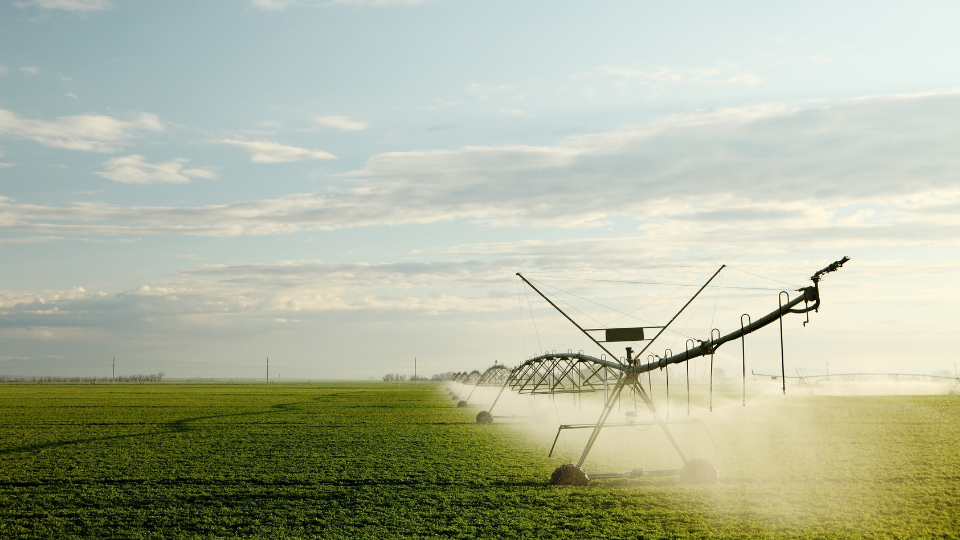
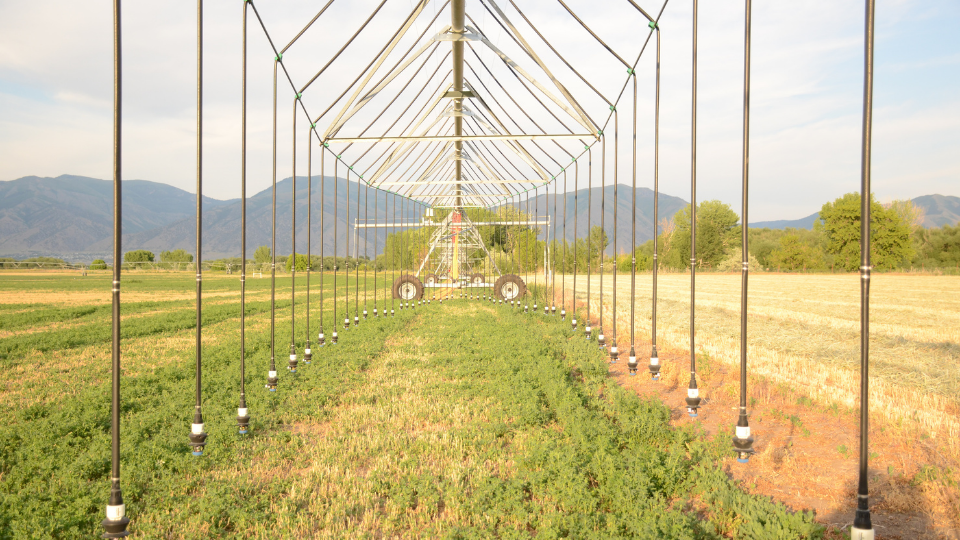
| 80%-97% | Center pivot systems, including low elevation spray application (LESA) or low energy precision application (LEPA). |
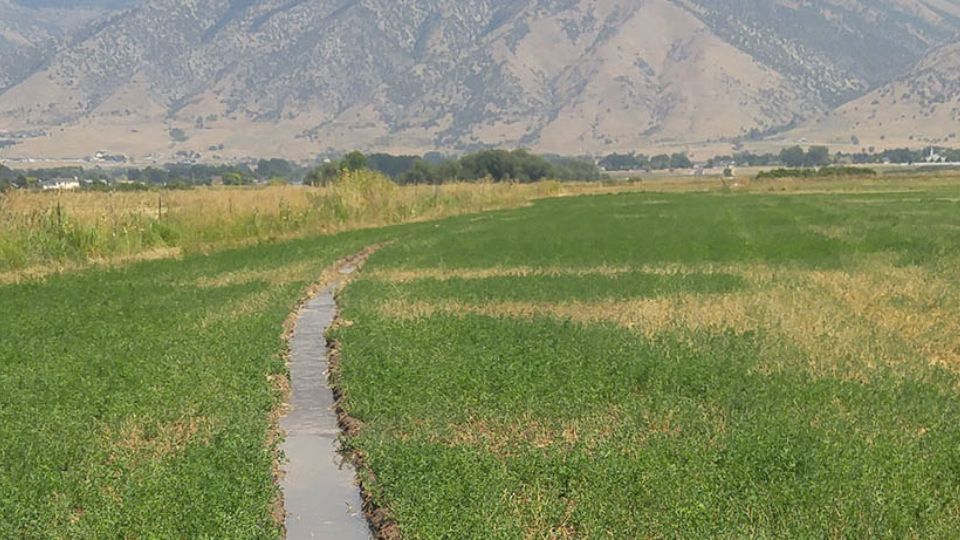
| 40%-90% | Surface irrigation (depending on the system, soils, and management). |
| ≥ 90% | Drip systems (deployed on the surface, subsurface, or mounted on a pivot, i.e., mobile drip), dependent upon design, maintenance, and management. |
References: Alam, M. (1997); IAEF (2010); Hanson, B. (2004); Brouwer et al. (1989); Burt, C. M. (1995); Burt et al. (2000); Irmak et al. (2011); Kranz, B. (2020); Peters, T. R. & McMoran, D. (2009); Rogers et al. (1997); Sarwar et al. (2019); Solomon, K. H. (1988); Stetson, L. E. & Mecham, B. Q. (2011).
Irrigation Water Losses
Wind Drift and Evaporation
In the dry climates of Utah, wind drift and evaporation from water droplets are almost exclusive to sprinkler systems (Figure 2A). These losses occur between the time the water leaves the sprinkler nozzle and when the remaining water reaches the soil. These losses are usually measured using catch cans on the soil surface and calculated as the difference between the applied depth based on the system flow rate and the depth of water caught in the catch cans. Because large portions of these losses leave the fields as water vapor, they are not always visible and may be “out of sight and out of mind.” However, these water losses can be significant, and evaporation is a non-recoverable loss. Wind drift and evaporation losses ranging from close to zero to as high as 40%–50% have been reported (see references in Table 2), depending on the sprinkler type, height, pressure, and most importantly, the weather. These losses are climate-dependent.
Table 2
Typical Utah Water Losses Through Wind Drift and Evaporation
| Ea | Irrigation systems and conditions |
|---|---|
| 35%-40% | Traveling big guns and pivot end guns. |
| 25%-30% | Impact sprinklers on hand line or wheel lines. |
| 15%-20% | Center pivot mid-elevation spray-application sprinklers. |
| ≥ 5% | LESA or LEPA sprinklers/applicators on center pivots. |
References: Alam, M. (1997); IAEF (2010); Hanson, B. (2004); Brouwer et al. (1989); Burt, C. M. (1995); Burt et al. (2000); Irmak et al. (2011); Kranz, B. (2020); Peters, T. R. & McMoran, D. (2009); Rogers et al. (1997); Sarwar et al. (2019); Solomon, K. H. (1988); Stetson, L. E. & Mecham, B. Q. (2011).

Figure 2. Potential Water Losses From Three Irrigation System Types
Note. Potential water losses may include runoff, deep percolation (caused by non-uniformity), spray losses (evaporation and wind drift), and evaporation from a wet canopy. The primary potential water loss from:
(A) Sprinkler irrigation includes wind drift and evaporation (spray) and deep percolation due to non-uniform irrigation or inadequate irrigation scheduling.
(B) Surface irrigation includes deep percolation and runoff.
(C) Drip irrigation is deep percolation resulting from non-uniformity in emitter flow rates, as depicted in the figure.
Wetted Canopy Evaporation
The amount of evaporation from a wetted crop canopy depends on the canopy size, percentage of the canopy that is wetted, and weather conditions such as temperature, humidity, and air movement. Researchers have found that canopy water losses can be about 4% after each irrigation (Melvin & Martin, 2018). This loss can be minimized by irrigating less frequently with increased water applied per irrigation event. However, this strategy is limited by the soil infiltration rate and water holding capacities. Wetted canopy losses are avoided with surface irrigation, drip systems (Figures 2B and 2C), and LEPA because they do not wet the crop canopy. There is evidence that water evaporating from a wetted canopy partially suppresses evapotranspiration, effectively increasing the Ea (Tolk et al., 1995). Aside from this suppression, canopy evaporation is a consumptive (non-recoverable) loss. When considering using irrigation systems that do not wet the canopy, other important irrigation-related uses may not be possible, including foliar application of fertilizers (fertigation) and pesticides applications(chemigation).
Deep Percolation
Deep percolation occurs when more water infiltrates into the soil than can be stored in the root zone. It is a source of water loss in most irrigation systems, but it is especially prevalent in surface irrigation systems (Figure 2B). This excess water moves downward through the soil profile and drains deeper than the crop’s root zone. Therefore, the crop can no longer access this water. Deep percolation can include water used to meet the salt leaching requirement. Although leaching is defined as a loss here, it is sometimes a necessary component of crop production. Deep percolation water is no longer useful for growing the crop, but it is not a consumptive loss and is potentially recoverable as it moves into the groundwater and eventually remerges as springs or is pumped from wells for reuse. Deep percolation can also be collected in drains or in surface water bodies. However, deep percolated water is typically of lower quality than the source water because of salt, nutrient, and pesticide leaching or dissolved solutes from the underlying geology. This water quality degradation can limit the potential for reuse. That said, return flows from deep percolated water are potentially recoverable, although not always upstream by the original grower who applied the irrigation water. In many cases, downstream water rights are based on return flow.
Deep percolation more than salt leaching requirements primarily results from irrigation mismanagement or poor system uniformity. Poor irrigation system uniformity occurs when an irrigation system does not apply an equal amount (depth) of water to all areas of a field. This may cause over or under irrigation in some or much of a field. No irrigation system is perfectly uniform, so a certain amount of deep percolation loss is expected. However, surface irrigation can be subject to greater deep percolation losses since it takes time for water to move across a field (Figure 2B). The top of the field may have water infiltrating and deep percolation for many hours before the bottom or middle of the field receives adequate water for crop growth. Water losses to deep percolation in surface irrigation can be as high as 50%–70%, particularly at the top of a field and/or the bottom if water is allowed to pond while trying to adequately irrigate the middle of the field. Flat or steeply sloped fields generally have higher losses
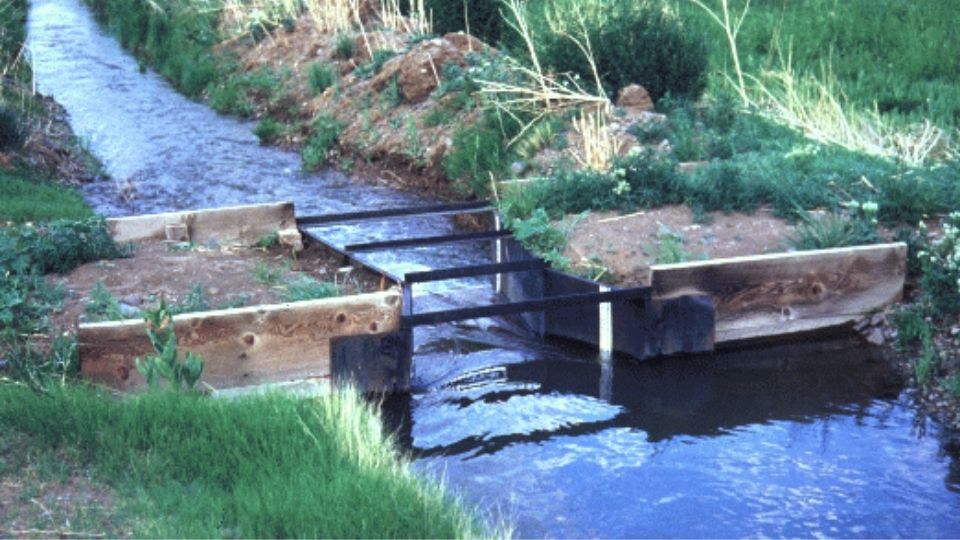
Runoff
Unlike the other large losses (evaporation and deep percolation), runoff is visible, and most irrigators can easily see and manage it. Although runoff water quality is often degraded due to nutrient and sediment loading from running across fields, it is often collected in streams, ponds, or drainage ditches and is reused downstream for irrigation, recreation, or wildlife habitat.
Potentially Recoverable and Non-Recoverable Irrigation Water
Water losses from irrigation can be classified as recoverable and non-recoverable:
- Recoverable water losses = deep percolation and runoff.
- Non-recoverable water losses = wetted crop canopy evaporation and wind drift.
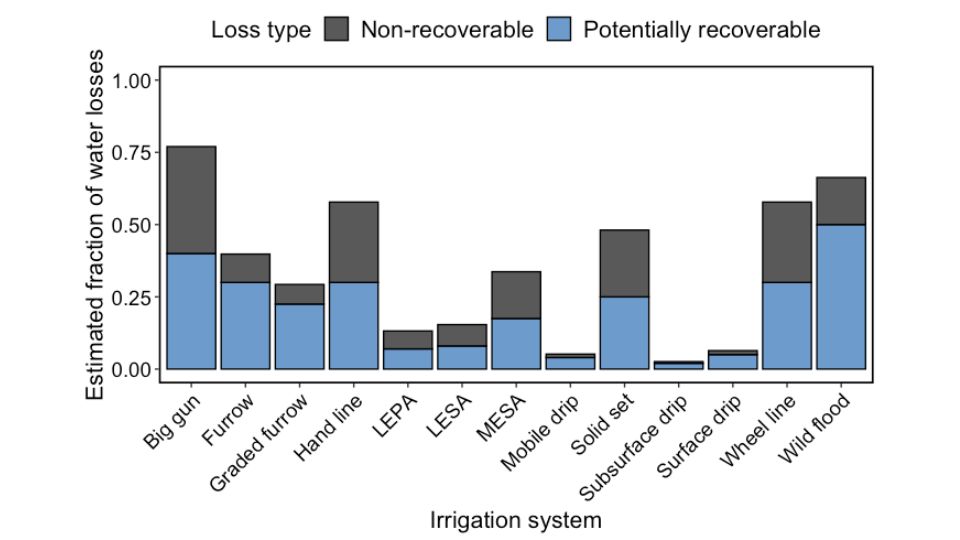
Based on these definitions, recoverable is synonymous with return flow and non-recoverable is synonymous with consumptive use, which also includes the water consumed by the crop (evapotranspiration). In Utah, sprinkler-based systems, such as big guns, hand lines, wheel lines, and solid sets, have larger estimated nonrecoverable losses than other sprinkler systems like LESA, LEPA, or MESA (Figure 3).2 In contrast, relative to the sprinkler-based systems, surface- and drip-based systems have greater potentially recoverable losses than non-recoverable irrigation water losses.
These two classes of losses can also be described using a ratio of potentially recoverable losses (PRl):
PRI = recoverable losses ÷ non-recoverable losses
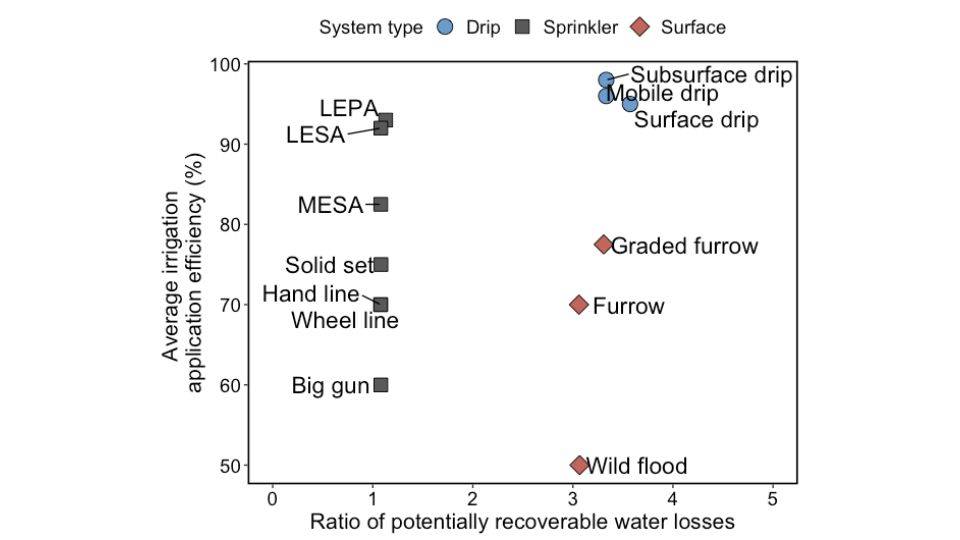
This ratio can be used to describe the amount of irrigation water losses that contribute to groundwater recharge or return flow to surface water bodies. A low 1:1 ratio indicates a system loses as much recoverable as non-recoverable water. In contrast, a system with a higher 3:1 ratio will potentially have three times as much recoverable water than non-recoverable (Figure 4). For example, although wild flood surface irrigation has greater total losses reflected by a low Ea than wheel line sprinklers (Figure 3), wild flood does have a higher PRl ratio than sprinkler-based systems (Figure 4). This means that while sprinkler-based systems such as wheel line may have higher Ea ratio than wild flood, surface flood systems have a higher PRl ratio, indicating a greater potential for recoverable water. Depending on the point of view, this may have a more beneficial impact on Utah’s overall water balance. When planning, promoting, or permitting irrigation system technology improvements, a key concern is the trade-off between the increased Ea ratio and the decreased PRl ratio. This concerns centers on potentially losing the of benefit of groundwater recharge, surface water flows, and return flow versus increased efficiency and decreased consumptive use losses.
The Big Picture
Overall, considering Utah's water balance and reducing non-recoverable losses, lower Ea surface irrigation may not always be a negative choice because a notable fraction of losses from surface irrigation may be recoverable. Though undesirable in the short-term and from a water delivery and supply capacity point-of-view, these losses may be less impactful on groundwater recharge and instream flow in the long-term. When growers upgrade surface irrigation to sprinkler irrigation systems, they often see better yields. This is the result of the ability to irrigate more frequently and uniformly. However, sprinklers also lose more water to evaporation from wind, spray drift, and frequent canopy wetting. In contrast, surface irrigation water losses are primarily deep percolation and field runoff. Because of these 8 factors, converting farms’ irrigation systems from surface to sprinklers, may not result in more water becoming available for use within Utah.
Conclusion
Each irrigation system type has benefits and drawbacks viewed from the perspective of a grower, a water manager, or other stakeholders. Although there are more efficient irrigation systems, based on the fraction of recoverable losses, some fields and areas in Utah with declining aquifers may be best served by continuing to use less efficient surface irrigation systems, depending on the considered trade-offs, needs, and constraints of a particular area. Therefore, water users, planners, and managers should consider both Ea and PRl recoverable losses when designing, managing, and modifying irrigation systems. The fraction of recoverable losses presented here is a helpful calculation for comparing the efficiencies, performance, and water loss of various irrigation systems and an area’s unique water needs.
Notes
Acknowledgments
This material is based upon work that is supported by the National Institute of Food and Agriculture, U.S. Department of Agriculture, under award number 2021-38640-34695 through the Western Sustainable Agriculture Research and Education program under project number [SW22-941]. USDA is an equal opportunity employer and service provider. Any opinions, findings, conclusions, or recommendations expressed in this publication are those of the author(s) and do not necessarily reflect the view of the U.S. Department of Agriculture.
References
- Alam, M. (1997, February 4). Irrigation efficiencies of surface systems. In Central Plains Irrigation Short Course and Exposition Proceedings, Colby, KS. Colorado State University Libraries.
- Brouwer, C., Prins, K., & Heibloem, M. (1989). Irrigation water management: Irrigation scheduling. In Training Manual No. 4. Food and Agriculture Organization. http://www.fao.org/tempref/agl/AGLW/fwm/Manual4.pdf.
- Burt, C. M. (1995). The surface irrigation manual. Waterman Industries.
- Burt, C. M., Clemmens, A. J., Bliesner, R., Merriam, J. L., & Hardy, L. (2000). Selection of irrigation methods for agriculture. American Society of Civil Engineers. https://doi.org/10.1061/9780784404621.
- Hanson, B., Schwankl, L., & Fulton, A. (2004). Scheduling irrigations: When and how much water to apply. Division of Agriculture and Natural Resources, University of California.
- Heermann, D. F., & Solomon, K. H. (2007). Chapter 5: Efficiency and uniformity. In G. J. Hoffman, R. G. Evans, M. E. Jensen, D. L. Martin, & R. L. Elliot (Eds.), Design and Operation of Farm Irrigation Systems (2nd ed.). American Society of Agricultural and Biological Engineers.
- Irrigation Association Education Foundation (IAEF). (2010). Principles of irrigation (2nd ed). Irrigation Association.
- Irmak, S., Odhiambo, L. O., Kranz, W. L., & Eisenhauer, D. E. (2011). Irrigation efficiency and uniformity, and crop water use efficiency [Fact sheet EC732]. University of Nebraska – Lincoln Extension. https://digitalcommons.unl.edu/cgi/viewcontent.cgi?article=1455&context=biosysengfacpub.
- Kranz, B. (2020). Irrigation chapter 8 - Irrigation efficiencies. In Irrigation Home Study Course. University of Nebraska – Lincoln. https://passel2.unl.edu/view/lesson/bda727eb8a5a/8.
- Melvin, S., & Martin, D. (2018). In-canopy vs. above-canopy sprinklers: Which is better suited to your field? In Proceedings of the 30th Annual Central Plains Irrigation Conference (pp. 157–165). Institute of Agriculture and Natural Resources, Cropwatch. University of Nebraska – Lincoln.
- O’Brien, P. L., & Daigh, A. L. M. (2019). Tillage practices alter the surface energy balance – A review. Soil and Tillage Research, 195. https://doi.org/10.1016/j.still.2019.104354.
- Peters, R. T., & McMoran, D. (2008). Boom-type carts vs. big-guns in northwestern Washington. Proc. Int. Irrigation Show, 27–38.
- Rogers, D. H., Lamm, F. R., Mahbub, A., Trooien, T. P., Clark, G. A., Barnes, P. L., & Kyle, M. (1997). Efficiencies and water losses of irrigation system. Irrigation Management Series, Kansas State University Extension.
- Sarwar, A., Peters, R. T., Mehanna, H., Amini, M. Z., & Mohamed, A. Z. (2019). Evaluating water application efficiency of low and mid elevation spray application under changing weather conditions. Agricultural Water Management, 221, 84–91. https://doi.org/10.1016/j.agwat.2019.04.028.
- Solomon, K. H. (1988). Irrigation notes: Irrigation system selection, irrigation systems and water application efficiencies. Center for Irrigation Technology, California State University-Fresno. http://cati.csufresno.edu/cit/rese.
- Stetson, L. E., & Mecham, B. Q. (2011). Irrigation (6th ed.). Irrigation Association.
- Tolk, J. A., Howell, T. A., Steiner, J. L., Krieg, D. R., & Schneider, A. D. (1995). Role of transpiration suppression by evaporation of intercepted water in improving irrigation efficiency. Irrigation Science, 16(2), 89–95. https://pubag.nal.usda.gov/download/1102/pdf.
Published August 2022
Utah State University Extension
Peer-reviewed fact sheet
Authors
Bradley Crookston, Troy Peters, Matt Yost, and Burdette Barker

Matt Yost
Agroclimate Specialist
PSC Dept

Burdette Barker
Irrigation
Related Research
2015 Costs and Returns for Flood Irrigated Alfalfa, Box Elder County
Enterprise budgets are the building blocks of a farm or ranch. They represent estimates of income and expenses for a specific period of time using a set of production practices and inputs for that enterprise.
4R’s of Irrigation Management
The research community and fertilizer industry have developed and utilized a framework termed “4R nutrient management” to help improve fertilizer stewardship. For decades, national and international organizations and institutes such as The Fertilizer Inst
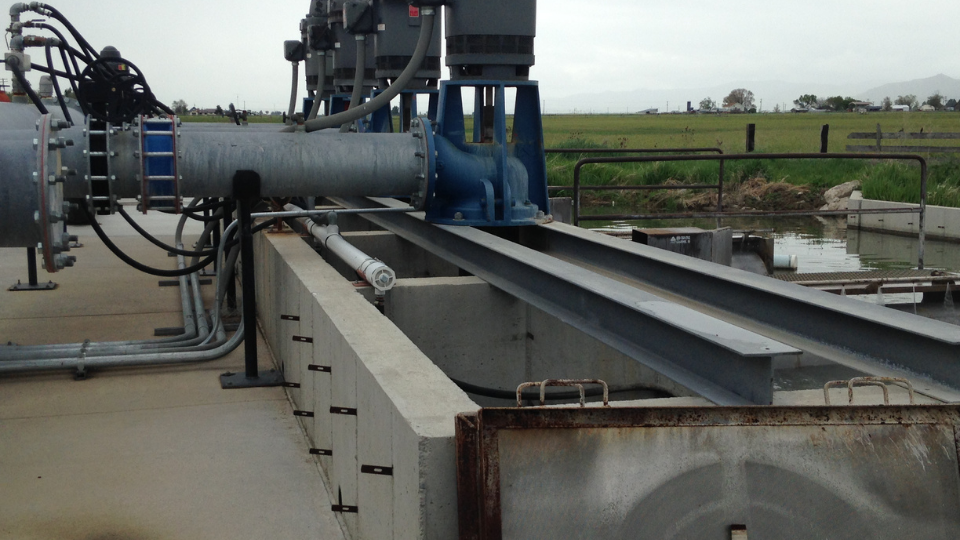
Accurate Irrigation Water Flow Measurement in Pipes
Accurate flow measurement is important to irrigation water management and water rights accounting and protection. Accurate flow measurement is essential in ensuring equitable water distribution to water rights holders and shareholders within irrigation co

Agricultural Producers’ Motivations and Challenges With Improving Soil Health in Utah
This study examines Utah agricultural producers' motivations and challenges in adopting soil health practices. It highlights the lack of localized resources and transferable knowledge as barriers, while emphasizing producers' desire to gain insights, enha
Aphids in Alfalfa
Aphids belong in the order Hemiptera and family Aphididae. Aphids are common insects in field and forage crops, with at least six kinds in Utah alfalfa. Aphids can be distinguished from other insects in alfalfa with a hand lens. In general, aphids are sof
Boom Sprayer Calibration for Pesticide Applications
To protect your investment in agricultural pesticides, a boom sprayer should be calibrated at the start of the season and whenever application conditions change. Also, sprayer output should be periodically checked throughout the season to assure proper ap

Comparison of Three Traps Used for Pocket Gopher Management (Thomomys Bottae) in Alfalfa Fields
Valley pocket gophers (Thomomys bottae) are a common agricultural pest in many areas of Utah, Nevada and California. Pocket gophers predominantly eat roots, although they will pull vegetation into their burrows, and eat plants immediately adjacent to thei
Considerations for Crop Rotation from Alfalfa to Corn
The importance of rotating out of a declining alfalfa stand is well established. As the alfalfa stand ages, forage yield and quality decline, while weed, insect, and disease pressures increase.
County-Level View of Irrigation Trends in Utah and the West
As water demand and scarcity increase simultaneously over the coming decades, water managers and growers will need to optimize water use on their irrigated lands. These challenges have been especially noticeable as the Western U.S.faces a prolonged “megad
Cover Crops for Utah
The purpose of this fact sheet is to provide the current state of knowledge on cover crop management for Utah based on USU research and local grower experience.

Crop Advisor Approaches to Soil Health Advising and Opportunities for Improvement
The report highlights that crop advisors in Utah and Idaho are increasingly addressing soil health, though barriers like cost, lack of localized information, and disagreements about soil health practices persist. Advisors from the NRCS are the most active

Defense Against Drought
Utah’s climate can often be harsh and unpredictable. As the nation’s second driest state, Utah is commonly subject to droughts. Extensive statewide droughts have often lasted 5 to 6 years. It is imperative that farmers are well prepared to defend against
Deficit Irrigation of Pastures
Deficit irrigation is any irrigation level that does not meet the crop’s full evapotranspiration (ET) demand, meaning evaporation from plant and soil surface and transpiration through plant growth.
Downy Mildew of Alfalfa
Downy mildew is an obligate parasite. Even though they look like fungi they are not. They belong to the Oomycota and are more closely related to algae than true fungi. The most common alfalfa downy mildew species in the USA is Peronospora trifoliorum. In
Drought Tolerance Guide for Alfalfa in Utah
Crop variety selection is one of the most important choices on the farm. Crop genetics determine a significant portion of the yield potential and resource use efficiency. Crop types and genetics that use water more efficiently will become increasingly imp
Economic Feasibility of Solar Photovoltaic Irrigation Systems
The Great Basin is primarily located in Nevada, western Utah, and small sections of southern Oregon and Idaho. The Great Basin is noted for its arid conditions and high percentage of publically owned land. The potential for solar energy generation in the
Energy Conservation with Irrigation Water Management
Irrigators in Utah experienced rapidly increasing energy costs from the mid 1970s to the late 1980s. These costs remain relatively high. Those who are pumping from deep wells are particularly interested in ways to cut back on energy use without doing away
Fertigation Facts
The purpose of this fact sheet is to provide general information on forms of fertigation for primary plant nutrient, fertigation timing, and fertigation economics.
Guide to Irrigation Sprinkler Packages for Pivots and Laterals
Guide to Irrigation Sprinkler Packages for Pivots and Laterals
Guide to Pivot Track Management
Center pivot irrigation systems are the most popular form of irrigation in the western United States. A significant problem with center pivots is wheel track rutting. Deep wheel tracks can cause overirrigation because the pivot moves slower than intended
How Good is Your Water Measurement?
Accurate water measurement is essential to maintaining equity of water delivery within an irrigation company or water districts. Good management of our scarce water resource is dependent upon quantifying supplies and uses with accurate measurement techniq
Irrigated Alfalfa Variety Performance, 2011-2014; North Logan, Utah
Alfalfa is the most important crop in Utah, both in terms of acreage and revenue. Although often overlooked, one of the most critical decisions made in alfalfa production is determining which variety to plant. This report summarizes dry matter (DM) yields
Irrigation Canal Lining?
Irrigation canals placed in native soil or lined with earth can have seepage water losses varying from 20 percent to more than 50 percent. Well designed, new compacted earth lined canals can have reduced seepage losses similar to concrete lined channels.
Irrigation Water Loss and Recovery in Utah
When deciding which irrigation systems to adopt, permit, or promote, it is important to consider how their efficiency and losses affect the water balance of Utah’s watersheds and drainage basins. Irrigators have no control over precipitation and only limi
Irrigation Water Quality Sampling Guide
The suitability of a water source for irrigation depends on the water quality, and some sources may be altogether unsuitable for practical use.
Managing Saline and Sodic Soils and Irrigation Water
Salt is important in plant and soil management. Excessive salt concentrations in soil can cause water to be less available to plants because of the osmotic forces of salt in the soil water. Excessive concentrations of some salt ions can also be toxic to p
Managing Soil pH for Crop Production in Calcareous-Alkaline Soil
In semiarid soils of the Western U.S., altering soil pH is not easily accomplished nor straightforward. Recall that pH is a measure of the acidity or alkalinity of a substance. More specifically, Utah’s soil pH range can be 1,000 times more acidic or alka
Measuring and Building Soil Health
Scientific communities have researched and debated the issues and benefits of soil sustainability and conservation for decades. From those efforts, “soil health” has emerged as the educational face of efforts to protect and improve the quality and product
Mobile Drip Irrigation for Pivots and Laterals
New technologies like MDI have the potential to improve irrigation efficiency thereby increasing water available to the crop and conserving water by reducing loss. If you are considering MDI on your farm, it will be important to carefully review its poten
On-Farm Research Guide
This how-to guide will cover benefits and best practices for conducting successful on-farm research.
Precision Irrigation Guide for Center Pivots
Precision irrigation is a process involving technology and specialized equipment to improve the efficiency and effectiveness of agriculture irrigation management. This management process is beneficial in allocating water based on spatial variability throu
Selecting Irrigated Alfalfa Varieties
Learn how to select the best alfalfa variety for your operation by understanding key factors like yield potential, fall dormancy, winter hardiness, and pest resistance. This USU Extension guide helps Utah growers make informed, profitable decisions for lo

Single Compost Application Benefits for Organic Dryland Wheat Production
A long-term Utah study shows that a one-time livestock compost application can improve soil health, moisture retention, and dryland wheat yields for more than two decades. The results highlight compost’s lasting, non-nutritive benefits for improving droug
Soil Sampling Guide for Crops
Why conduct soil sampling for crops? The answer is simple and intuitive for most involved in agriculture. Regular soil sampling, testing, and associated guidance on fertilization and soil amendments help develop and maintain more productive and healthy
Strategies for Deficit Irrigation of Forage Crops
Deficit irrigation strategies with varying effectiveness can be employed in many cases to maximize production and profit. These strategies can include modifying irrigation schedules, concentrating irrigation to critical crop growth stages, reducing rates,
Ten Considerations for Solar-Powered Irrigation in Utah
Generating power from solar energy used to be one of the most expensive options in Utah. This scenario is changing. According to the American Council on Renewable Energy (ACORE, 2021), the cost of solar power production went down by 90% between 2009 and 2
Ten Reasons Why Alfalfa is Highly Suitable for the West
it is critical to weigh the many reasons why alfalfa is actually a quite suitable crop for the West. Below are 10 of the key reasons why alfalfa is suitable in western regions:
The Ten Most Common Mistakes in Using No-Till
Interest in no-till (NT) crop production practices has increased greatly among Utah farmers and ranchers in recent years. The primary benefits of implementing a cropping system with little or no tillage includes improved soil quality (improved soil moistu
Understanding Irrigation Water Optimization
It is important to consider the possible hydrologic impacts of irrigation optimization efforts to avoid implementing practices that have little appreciable effect relative to the desired outcome. Examples of desired outcomes include increasing supply reli
Understanding Pesticide Risks: Toxicity and Formulation
Pesticides are substances that control unwanted organisms. A pesticide can be used to prevent, destroy, repel, or mitigate pests. Common pest organisms include insects, plants, fungi, bacteria, plant-parasitic nematodes, viruses, snails and slugs, and nui

Utah Producers and Soil Health: Statewide Survey Results
This report summarizes a 2024 survey of Utah producers, highlighting their strong support for soil health, varied adoption of practices, and gaps in knowledge. It emphasizes the need for region-specific information and outreach to enhance soil health mana

Utah Surface Irrigation Water Optimization Opportunities and Barriers
This peer-reviewed fact sheet from Utah State University Extension summarizes a statewide survey of surface irrigators, highlighting current practices, barriers, and opportunities for water optimization in Utah agriculture. It emphasizes the importance of
Variable Frequency Drives for Irrigation Pumps
A VFD can make sense in a variety of irrigation applications. Here are 6 of the major applications where one might consider a VFD (also see Henry and Stringham, 2013 and USDA-NRCS, 2010):
Water Rights in Utah
If you are connected to a municipal system, your water is probably categorized as “culinary or municipal water” and is used for everything from drinking and bathing to washing the car to watering tomatoes. However the Utah Division of Water Rights takes a
25 Rules of Thumb for Field Crops
University Extension services are widely known for scientific information on best practices for field crop production. Many Extension experts commonly offer the same tips or "rules of thumb" to growers. This article is certainly not a comprehensive list o
Identification and Management of Scotch Thistle (Onopordum acanthium L.) in Pastures, Rangelands, and Non-Crop Settings
Scotch thistle (Onopordum acanthium) is an invasive species native to Eurasia. It was likely introduced into North America during the late 19th century (Young & Evans, 1969). Due to the plant’s size and prickles, a stand can damage pasture productivity, r
Identifying and Managing Dyer's Woad (Isatis tinctoria) in Pastures, Rangelands, and Non-Crop Settings
Dyer's woad (Isatis tinctoria) was introduced into Utah during the mid-19th century as a source of indigo dye. The plant escaped cultivation and has spread across rangelands, foothills, and other sites throughout the Intermountain West.
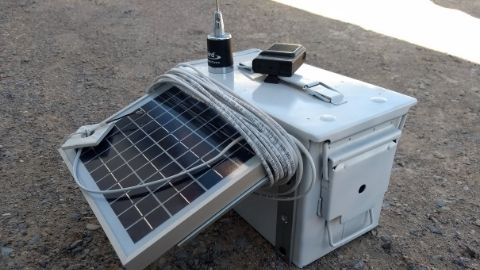
Irrigation Advance Sensors Are Having Large Impacts in Surface Irrigation
There are many good things about surface irrigation, but the labor requirements and large water withdrawals can diminish its feasibility in situations with limited access to labor or water. In this fact sheet, we will describe two of these systems current