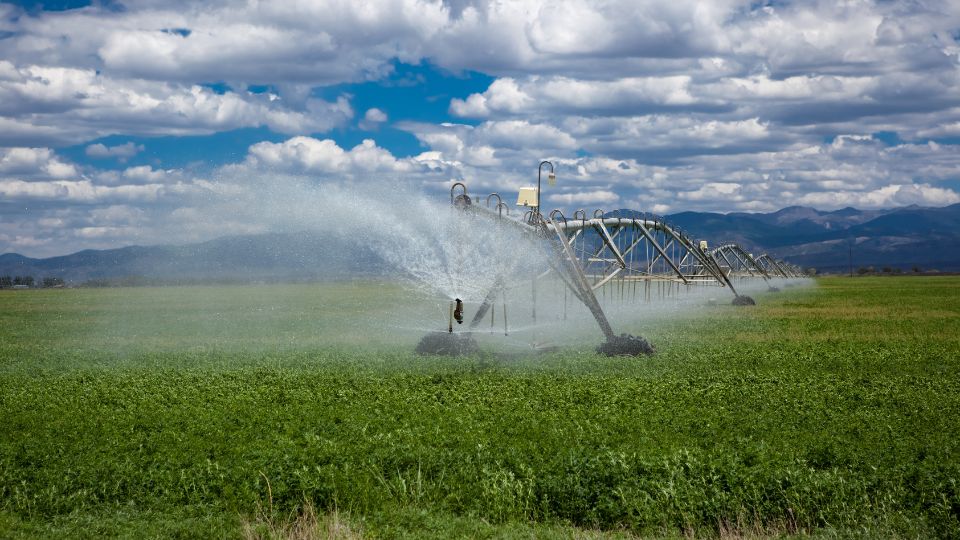
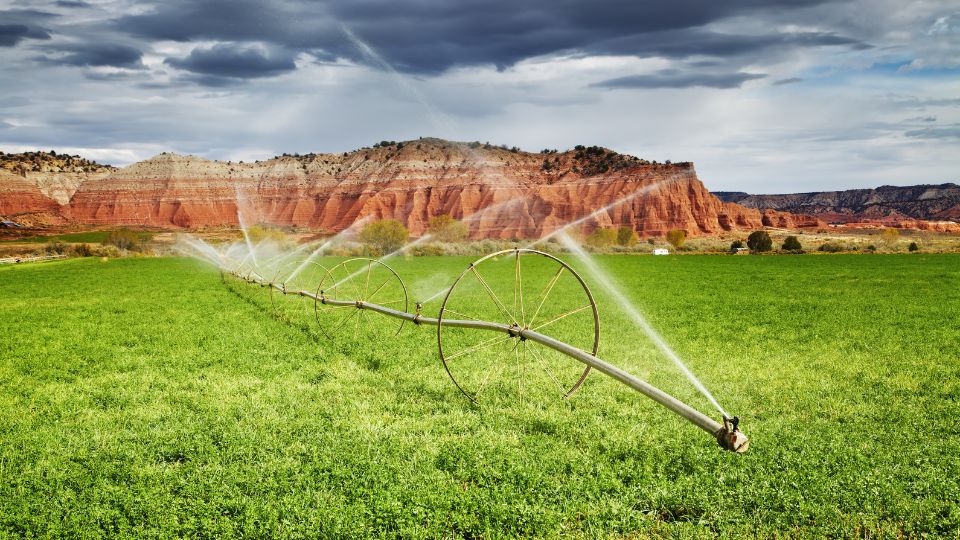
County-Level View of Irrigation Trends in Utah and the West
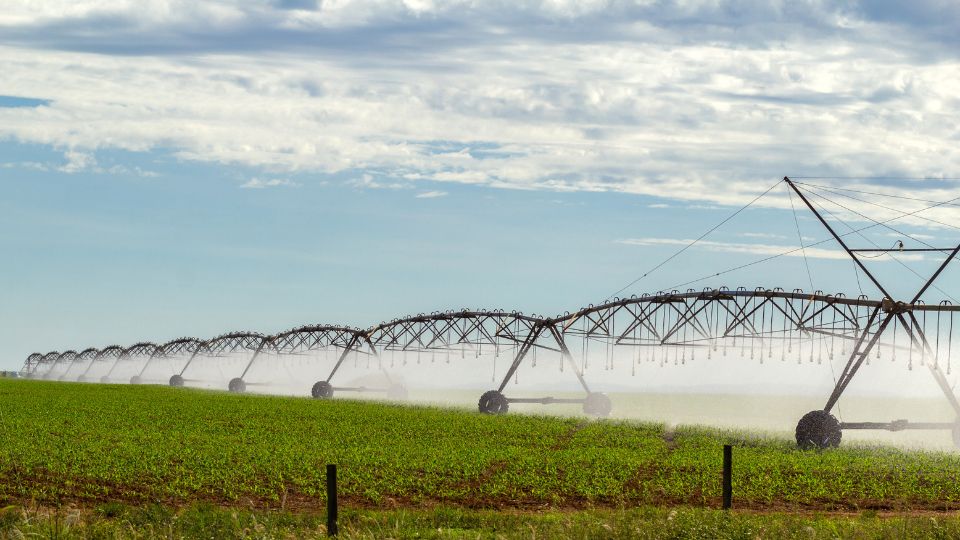
As water demand and scarcity increase simultaneously over the coming decades, water managers and growers will need to optimize water use on their irrigated lands. These challenges have been especially noticeable as the Western U.S.faces a prolonged “megadrought” and growers prepare for potential, or declared, water shortages and cuts. For agriculture to persist in the West, wemust effectively use increasingly limited and contested water supplies, while providing growers with economically viable livelihoodoptions and limiting negative environmental consequences (Borsato et al., 2020; Rosa et al., 2019).
Understanding how growers maintain high yields in arid, water-stressed places while conserving water is of key importance for the future of U.S.agriculture in the West. Tracking irrigation changes as they relate to farm(er) characteristics is difficult because of the lack of long-term, spatially and temporallyconsistent datasets describing water use across irrigated operations.Data from irrigation surveys of the U.S. Department of Agriculture(USDA) National Agricultural Statistics Service (NASS, 2021), which provide the most detailed and comprehensive data on irrigation behaviors and water use in the U.S., are only released to the public at statescales. While these analyses are useful for understanding broad trends and relationships in irrigation technology adoption, their scope makes it difficult to develop irrigation and water conservation research, education, or management initiatives that are targeted to growers’ specific needs beyond on-farm technology.
Highlights
- Irrigation productivity (crop yield ÷ irrigation water applied) differs by crop, county, year, and other categories.
- Irrigation does not always respond dynamically to drought.•Growers report a diversity of information sources,with neighborsand universityas top-used sources.
- "Condition of the crop”was the top-cited method for irrigation scheduling and signals large opportunities to improve irrigation scheduling with advanced tools such as soil sensors.
- The most commonly citedbarriers to water efficiencyimprovements were “low priority”and “inability to finance.”
We explored water use management and trends in irrigated agriculture in the U.S.West using operator-level USDA-NASS Farm and Ranch Irrigation Survey (FRIS)/Irrigation and Water Management Survey (IWMS) data aggregated for the first time to the county instead of statescale. Our hope is that this study will guide water managers in developing regional conservation programs, inform extension and research initiatives related to irrigation, promote grower-informed water conservation education,and provide researchers with key information regarding if, how, and why growers consider water conservation in irrigation decision-making.
Methods
We analyzed confidential FRIS and IWMS datasets from NASS to visualize irrigation and agricultural production changes. Where possible (when count ≥ 6) these farm-level data are aggregated to the county scale, the finest resolution at which these U.S. farm-level data can be shared based on USDA restrictions. Using county-level data allows us to visualize, understand, and interpret the spatial and temporal complexities of regional and national agricultural trends.
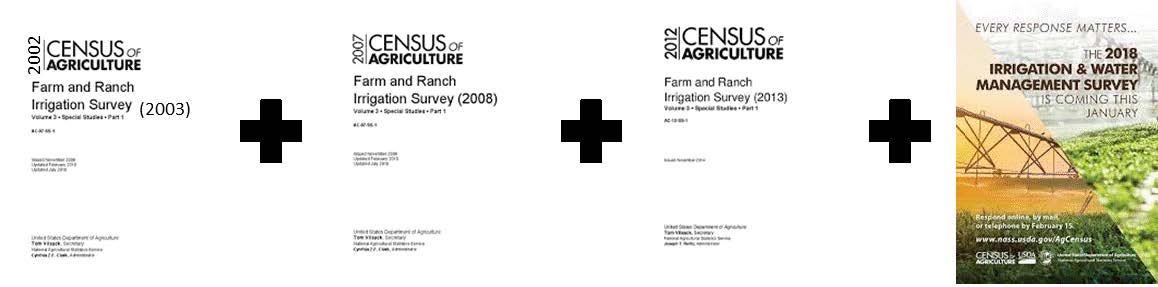
We synthesized and merged data from the 2003, 2008, and 2013 FRIS and the 2018 IWMS into a single dataset of surveyed operators of irrigated farms.
FRIS and IWMS data is collected at the farmer level and tabulated, reported, and publicly available at the state scale. We purchased access to these data at the farm operator level and securely accessed these data remotely.
After the dataset was merged and cleaned, we calculated irrigation productivity (IP), or the water used per crop unit harvested, by dividing the estimated average yield (in pounds/acre) by the estimated average water used (acre-feet) in any county year. In other words, it was the yield divided by irrigation or water diversion amount.

The IP data and several other questions contained in the merged NASS surveys were used to answer the following eight questions. In many cases, we examined trends both byyear (2003, 2008, 2013, and 2018) andacross the four survey years.For most of the results below, we discuss trends across all four survey years for simplicity. Many of the trends did vary by year. Additional data, displayed in supplemental figures, are provided in the Appendix. For more details on the study, please visit the 2022 Journal of Environmental Management article, "Water in the West" by Schumacher, Yost, Burchfield, and Allen.
1.How does irrigation productivity vary?
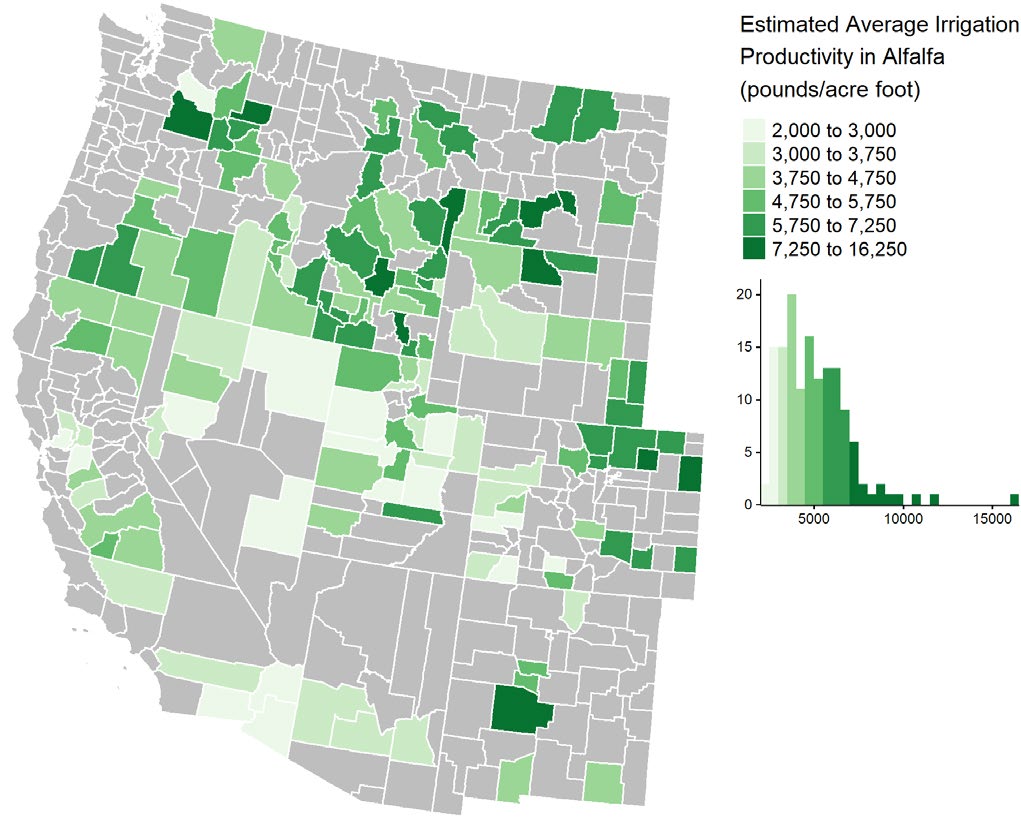
In 2018, irrigation productivity, or the water used per crop unit harvested, was highly variable across Western counties. In alfalfa, irrigation productivity in 142 counties ranged from 2,350pounds/acre-foot in Lincoln, Nevada, to 16,220 pounds/acre-foot in Bannock, Idaho (Figure 1A). This range was not as great in Utah, where it was between 2,000 and 3,750 pounds/acre-foot in many counties, with data up to over 5,000 pounds/acre-foot in Wayne County. It was not clear why Wayne County was greater than other counties.
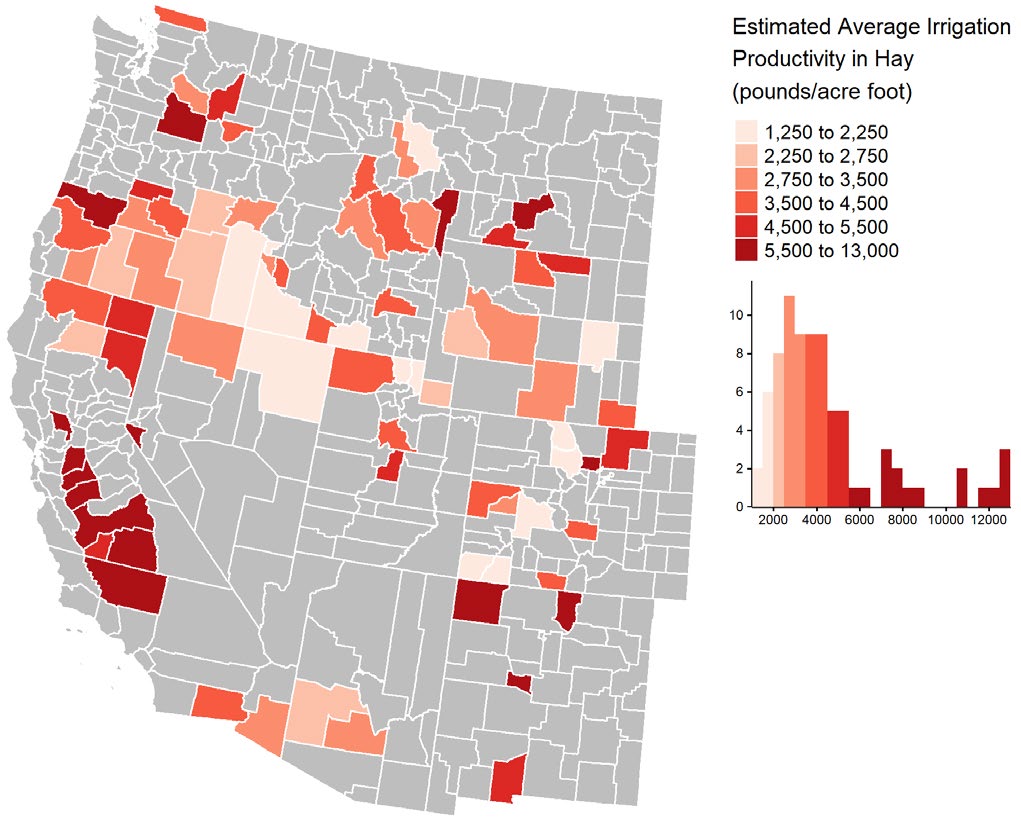
In hay, irrigation productivity in 80 counties ranged from 1,300 pounds/acre-foot in Cassia, Idaho,to 12,880 pounds/acre-foot in Stanislaus, California (Figure 1B). Only five Utah counties had data for hay,and the range was large—from an average of 1,750 pounds/acre-foot in Cache and Rich counties up to an average of 5,000 pounds/acre-foot in Sanpete County.
In 2018, growers had the greatest irrigation productivity in northeastern Colorado and in southern Montana in alfalfa (Figure 1A) and in California’s Central Valley in hay (Figure 1B). Over the entire study period (2003–2018), counties in eastern Colorado (Figure 1A), California’s Central Valley, western Montana and Oregon, southern Idaho, and western Montana utilized water most efficiently in corn grain, hay, wheat, and alfalfa, respectively.
Irrigation productivity in corn silage was the most variable across crops and years(data not shown). Corn silage irrigation productivity variedfrom a median of 4,000 pounds/acre-footin Arizona in 2008 to 13,030 pounds/acre-footin Montana in 2013. Median irrigation productivity was the most consistent in alfalfa, where the least in-state difference was 50 pounds/acre-foot in Nevada between 2008 and 2013. Because influential environmental and irrigation management factors could not be accounted for, use these trends in irrigation productivity, which reflect temporal and spatial trends in crop yield and water applied, with caution.
2. Has irrigation productivity changed over time?
Trends in irrigation productivity were variable across space, time, and crops (see full datasets and summaries). For instance, in alfalfa irrigation, productivity has doubled in Socorro, New Mexico, since 2003; in Rio Grande, Colorado, however, irrigation productivity in 2018 was a third of what it was in 2003. This high variability points to the need for county-and crop-specific data and water management guidelines.
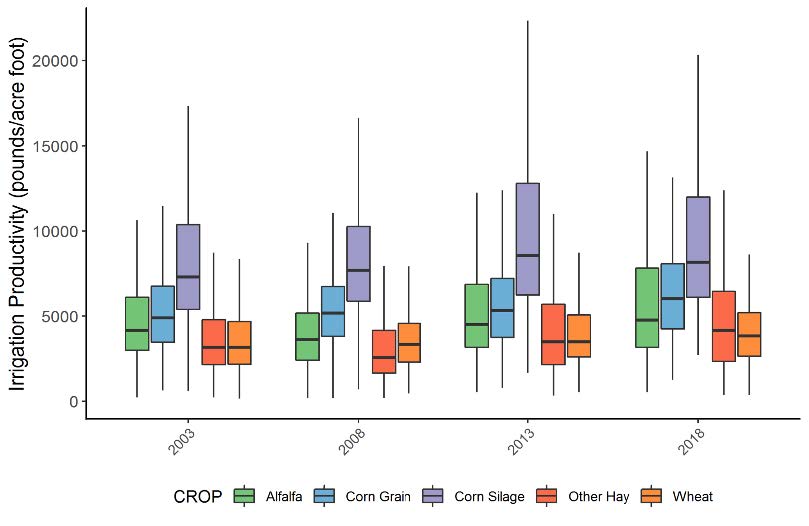
Though there is county-level variability, in general, irrigated yields in alfalfa, hay, wheat, corn silage, and corn grain have increased slightly from 2003 to 2018 across the West. As measured by irrigation productivity, efficiency in production across years is greatest in corn silage, followed by corn grain, alfalfa, wheat, and other hay (Figure 2).
3. Do farmers adjust irrigation due to drought?
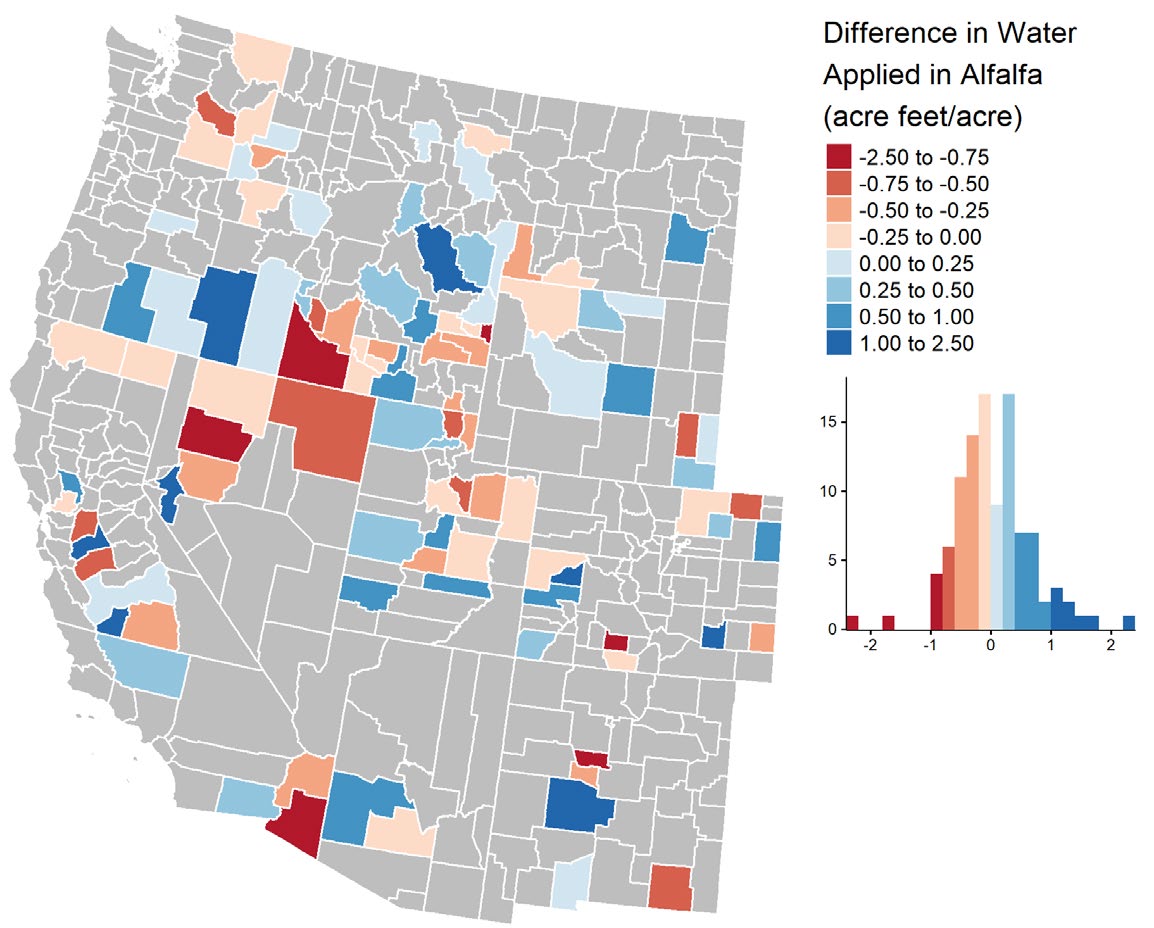
In 2013, the U.S. West faced an intensifying drought (Swain et al., 2014); in California, for instance, statewide accumulated precipitation throughout the calendar year was 34% less than average, causing water agencies to announce a total halt on agricultural water distribution to irrigators in 2014 (California Department of Water Resources, 2014; U.S. Bureau of Reclamation, 2014). In many counties across the 11 western-most states, this drought posed unprecedented challenges to water availability and, therefore, agricultural productivity. In contrast, 2018 was an average to below-average rainfall year across the region (National Centers for Environmental Information, 2019). Interestingly, the difference in water applied by growers between an extreme drought and a more average year is not entirely consistent with our expectation that irrigators would apply more water in response to extreme drought. In 48%, 58%, 55%, 62%, and 42% of counties reporting water applied toalfalfa (Figure 3), corn grain, corn silage, hay, and wheat, respectively, growers applied more water in 2013 than in 2018. The trend across the West was consistent with the trend in Utah. Of14 Utah counties with data, six reported greater water applications in an average water year (2018) compared to a dry year (2013).
Mitigating Western U.S. drought effects with irrigation water is feasible, but it is only as effective as water availability and water turns allow. Of the 104 counties with reportable alfalfa data in both years, 50 reported more water applied in 2013 than in 2018, with the remaining 54 counties reporting less. Thus, about half irrigated above or below 2013 levels, potentially due to limited water available for diversion or the turn-based system of irrigation in agriculture. This suggests a diverse and often limited ability to adapt irrigation management to drought in this region.
4. Which information sources are used the most?

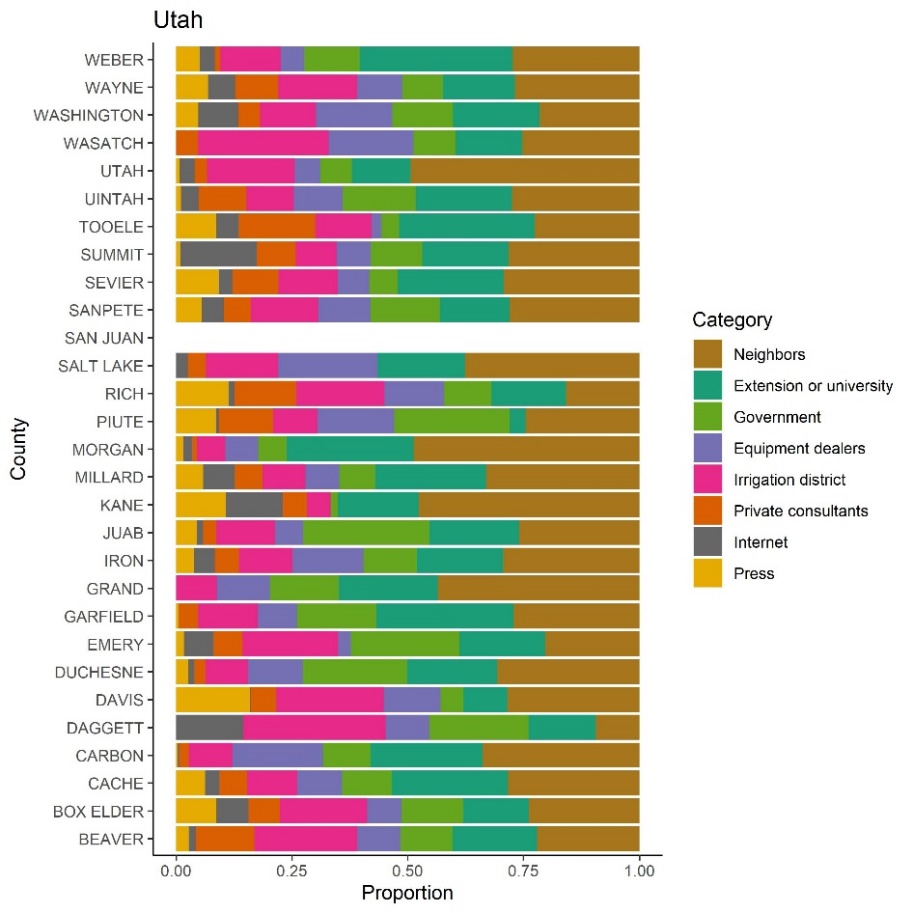
Between 2003–2018, farmers across 11 western states relied primarily on information from neighboring farmers to reduce irrigation costs or conserve water used for irrigation (Figure 4). The second most important source of information was extension agents or university specialists, highlighting the importance of both local knowledge and expert information networks in irrigation decision-making. The trends observed across the West were similar to trends in Utah, where the major source was neighbors with a nearly even split among three other sources (Extension, government, and irrigation districts).
The proportion of responses indicates that irrigators’ information sources vary at the state and county levels. For instance, in some states, information from irrigation equipment dealers is more important than that from extension agents, but in New Mexico, irrigation equipment dealers are consistently less utilized than other information sources.In Washington, very few irrigators source their information from government specialists, but in some Arizona and New Mexico counties, over 30% of irrigators rely on these sources when making irrigation decisions fortheir crops. The large diversity and variability in preferred irrigation information sources highlights the need for more public and private organization coordination to provide enhanced irrigation information. Finally, these data point to the importance of farmer networks and the need to further develop and use these networks to advance water optimization.
5. Which scheduling methods are used the most?
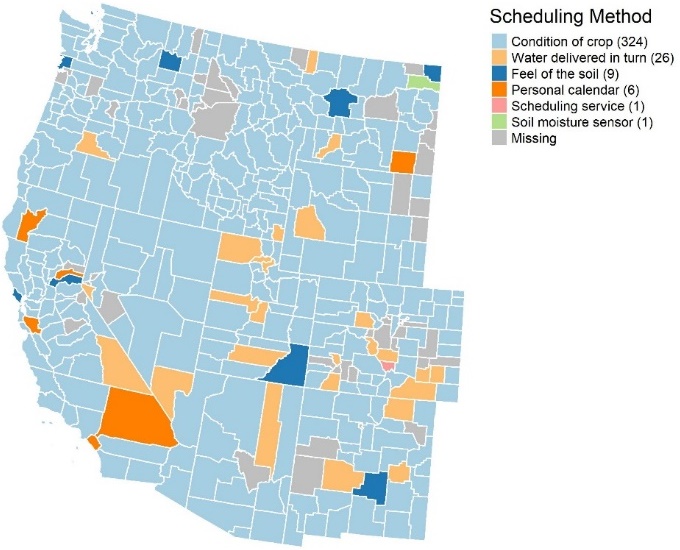
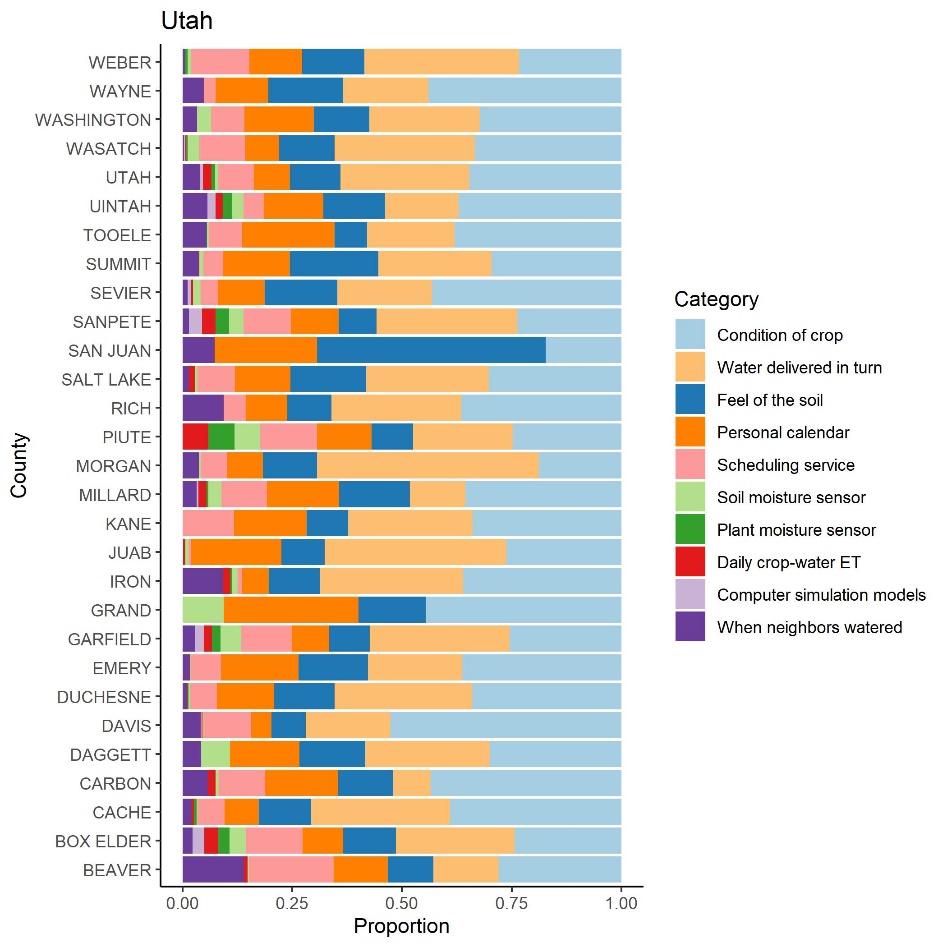
Between 2003–2018, farmers across 11 western states overwhelmingly scheduled water use based on the condition of their crops (Figure 5). Using condition of the crop to schedule irrigation is problematic because when water stress is visible, yield loss has already occurred and often cannot be recovered. This suggests large opportunities to improve irrigation scheduling with advanced techniques that monitor the soil moisture or water potential. This was further evidenced by the fact that very few irrigators reported usingsoil moisture-sensing devices. The 2018 map of irrigation scheduling methods did show enhanced use of soil moisture sensors, but it was still among the least used methods for irrigation scheduling.
The second most important scheduling method across the region was turn-based, whereby irrigators use water when it’s delivered, a “no choice” method. The turn system is unique to some parts of the Western U.S.and gives irrigators limited choices as towhenthey water their crops. This method was more prevalent on the southern half of this region than the northern half—including Utah,where sixof 29 counties cited this as the major method (Figure 5). Although water turns are practiced in many areas, there maystill be many opportunitiesto usetechniques to adjust the rate and sometimes the timing of irrigation.
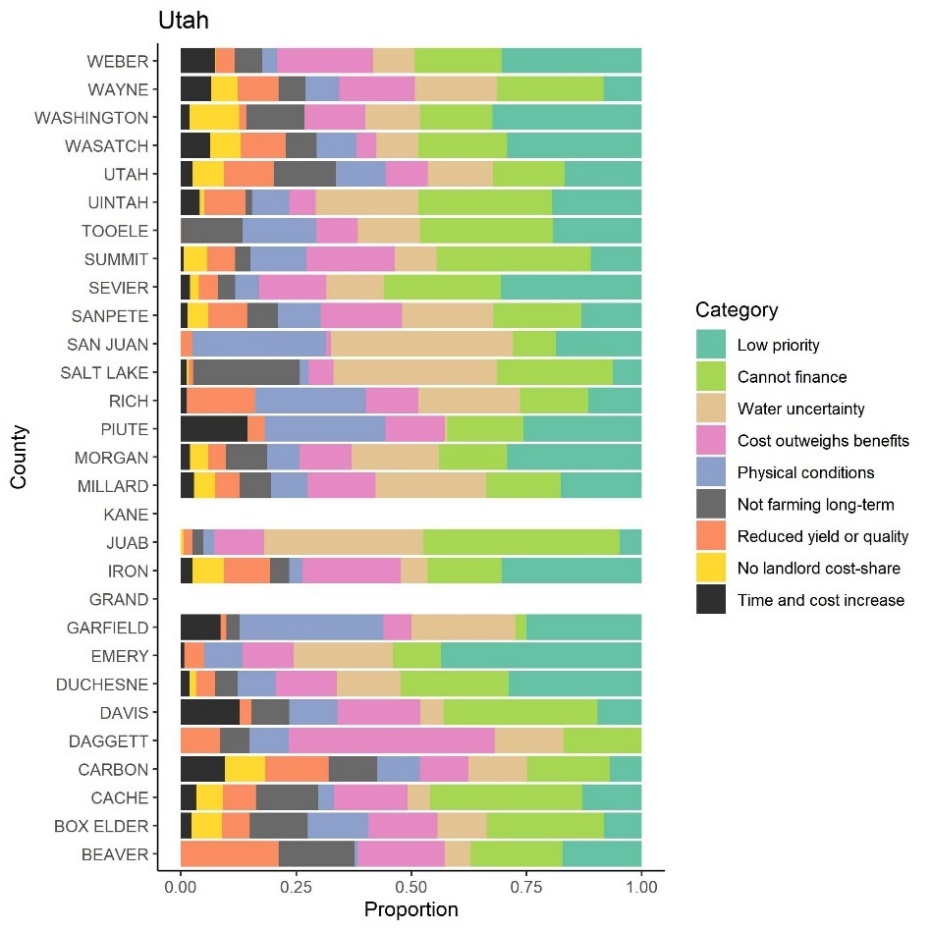
6. What are the largest barriers to irrigation improvements?
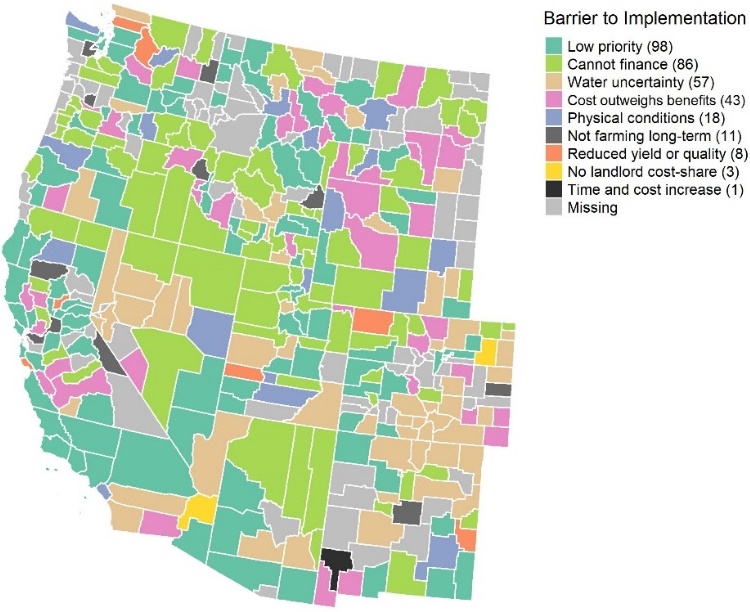
Between 2003–2018, farmers in the 11 western-most statesfound financing and prioritizing improvements as the largest barriers to implementing improvements in their irrigation systems (Figure 6). Interestingly, irrigators consistently noted uncertainty about future water availability as a third major contributor to their decisions not to implement improvements that may reduce energy costs or conserve water. Without the promise of consistent water availability, why invest thousands of dollars in new equipment and technologies to conserve?
Barriers encountered by irrigators varied at the state and county levels and by year. For instance, in 2018 (not shown), irrigators in Arizona rarely cited risk of reduced yield or poorer quality crops as a barrier to implementing irrigation improvements; in New Mexico and Washington, however, this barrier is cited as a top concern. Contrastingly, some barriers are consistently cited across states and counties. One such barrier is that improvements will not reduce costs enough to recover implementation expenses. These local barriers should assist water planners and irrigators seeking to effectively finance and make irrigation investments.
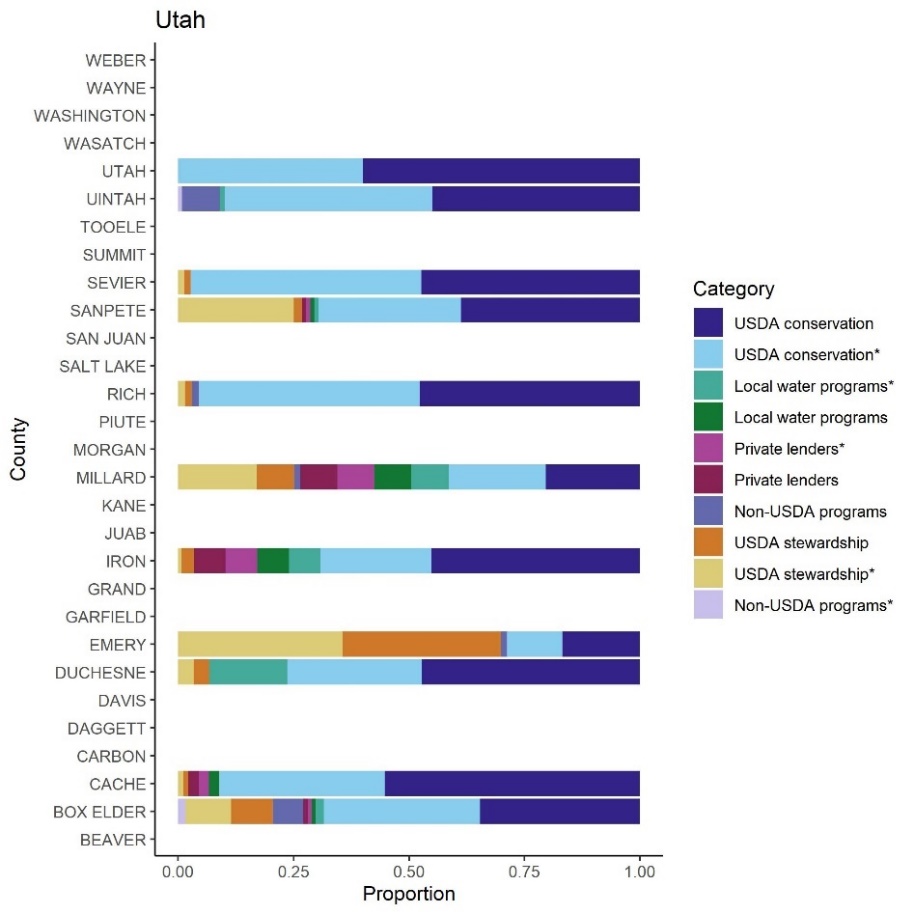
7. What are the largest bridges to irrigation improvements?
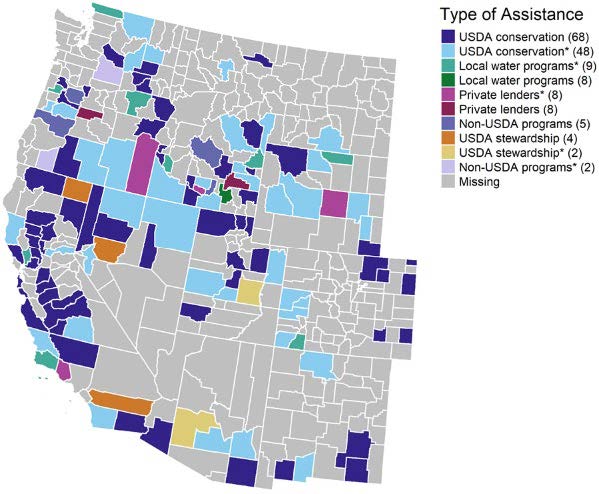
Bridges to irrigation improvements were only recorded by farmers that indicated they had made irrigation and/or drainage improvements above regular maintenance in the past five years with the aid of technical and/or financial assistance. Assistance is low in many areas, so there is a lot of missing data. From 2003–2018, farmers overwhelming cited both financial and technical USDA programs for water conservation and environmental improvements as bridges, or support, for implementing improvements to their irrigation systems (Figure 7). Interestingly, the importance of USDA programs (e.g., CTA, EQIP, RCPP, WHIP, and CIG) for financial and technical support was relatively consistent across counties and states. This was also true in Utah where seven of 11 counties with data stated that USDA conservation programs were the major source. Some counties in some years stand out as anomalies to this general rule. In 2018, in Napa, California, for instance (data not shown), irrigators reported using only non-USDA federal programs, or Bingham, Idaho, where irrigators relied heavily on private businesses and state programs.
8. Does assistance acceptance influence barriers to conservation?
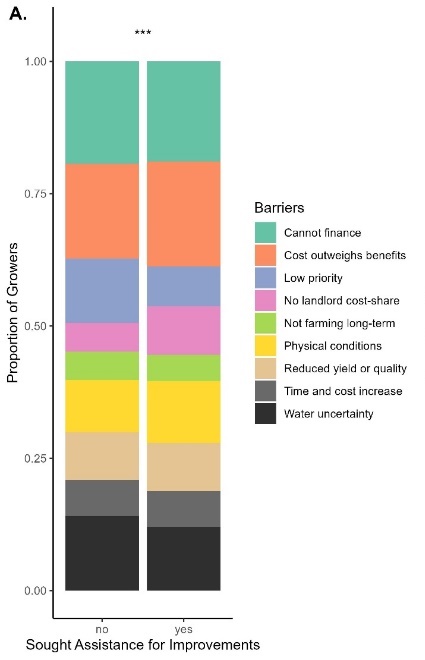
Not all growers implementing improvements sought financial or technical assistance between 2003–2018. Though “financing” was cited as one of the greatest barriers to implementing irrigation improvements on Western operations, many growers did not use available financial resources from the USDA or other federal, state, or private programs (Figure 8). Growers that implemented improvements on their operation and received assistance to do so cited “prioritizing improvements” as a barrier about half as often as growers who did not seek out or receive assistance, suggesting that ready access to assistance may decrease barriers to implementing improvements that increase efficiency and save water. Though most other barriers cited were consistent among growers who received or did not receive assistance, growers receiving assistance for improvement implementation cited their landlord’s unwillingness to help in the cost of implementation as a barrier twice as often as growers who did not receive assistance.
Summary
We found notable spatial and temporal variability in Western irrigation practices, with neighboring counties often exhibiting large differences in efficiency, water use, and crop yields, as well as in the sources of information, scheduling methods, and technological improvements employed. This analysis addresses a critical need: to gather and disseminate irrigation information at local and regional scales regarding how growers irrigate their crops, steps growers are taking to use water efficiently, and barriers growers face to conserving water. We found that:
- Irrigation productivity varies greatly over time and space.
- Water applications do not always respond dynamically to drought.
- Irrigation productivity differs significantly across multiple water use, delivery, and other categories.
- Growers report an incredible diversity of information sources, scheduling methods, and barriers and bridges to implementing improvements.
These county-level data should help water managers more accurately and sensitively assist growers.
References
- Borsato, E., Rosa, L., Marinello, F., Tarolli, P., & D’Odorico, P. (2020). Weak and strong sustainability of irrigation: A framework for irrigation practices under limited water availability. Frontiers in Sustainable Food Systems, 1–16. https://doi.org/10.3389/fsufs.2020.00017
- California Department of Water Resources (CADWR). (2014, January 31). DWR drops state water project allocation to zero, seeks to preserve remaining supplies: Severe drought leads to worst-ever water supply outlook. www.water.ca.gov. Retrieved July 20, 2021, from https://www.lvmwd.com/home/showpublisheddocument?id=3860.
- National Agricultural Statistics Service (NASS). (2021). Surveys: Census of irrigation. U.S. Department of Agriculture. Retrieved May 24, 2021, from USDA - National Agricultural Statistics Service - Surveys - Irrigation and Water Management
- National Centers for Environmental Information. (2019). State of the climate: National climate report for annual 2018. National Oceanic and Atmospheric Administration (NOAA). Retrieved May 24, 2021, from https://www.ncdc.noaa.gov/sotc/national/201813.
- Rosa, L., Chiarelli, D. D., Tu, C., Rulli, M. C., & D’odorico, P. (2019). Global unsustainable virtual water flows in agricultural trade. Environmental Research Letters, 14(11). https://doi.org/10.1088/1748-9326/ab4bfc
- Swain, D. L., Tsiang, M., Haugen, M., Singh, D., Charland, A., Rajaratnam, B., & Diffenbaugh, N. S. (2014). The extraordinary California drought of 2013–2014: Character, context, and the role of climate change. Bulletin of the American Meteorological Society, Insitute of the Environment & Sustainability, University of California – Los Angeles.
- United States Bureau of Reclamation (USBR). (2014, February 21). Reclamation announces initial 2014 Central Valley Project water supply allocation. Retrieved July 20, 2021, from https://www.usbr.gov/newsroom/newsroomold/newsrelease/detail.cfm?RecordID=46045
Appendix: Supplemental Figures
Published September 2022
Utah State University Extension
Peer-reviewed fact sheet
Authors
Matt Yost, Britta Schumacher, LuRee Johnson, Emily Burchfield, and Burdette Barker

Matt Yost
Agroclimate Specialist
PSC Dept

Burdette Barker
Irrigation
Related Research
4R’s of Irrigation Management
The research community and fertilizer industry have developed and utilized a framework termed “4R nutrient management” to help improve fertilizer stewardship. For decades, national and international organizations and institutes such as The Fertilizer Inst
Accurate Irrigation Water Flow Measurement in Pipes
Accurate flow measurement is important to irrigation water management and water rights accounting and protection. Accurate flow measurement is essential in ensuring equitable water distribution to water rights holders and shareholders within irrigation co
Agricultural Irrigated Land and Irrigation Water Use in Utah
This article is a summary of several estimates of the extent of agricultural irrigation in Utah and some associated trends.
Agriculture Water Use and Economic Value in the Great Salt Lake Basin
This fact sheet provides information about the following topics in the context of the Great Salt Lake and its basin: Great Salt Lake facts, Human effects on the size of the lake, Changes to population and land use, Agricultural water use, Agriculture and
County-Level View of Irrigation Trends in Utah and the West
As water demand and scarcity increase simultaneously over the coming decades, water managers and growers will need to optimize water use on their irrigated lands. These challenges have been especially noticeable as the Western U.S.faces a prolonged “megad
Defense Against Drought
Utah’s climate can often be harsh and unpredictable. As the nation’s second driest state, Utah is commonly subject to droughts. Extensive statewide droughts have often lasted 5 to 6 years. It is imperative that farmers are well prepared to defend against
Deficit Irrigation of Pastures
Deficit irrigation is any irrigation level that does not meet the crop’s full evapotranspiration (ET) demand, meaning evaporation from plant and soil surface and transpiration through plant growth.
Drought Tolerance Guide for Alfalfa in Utah
Crop variety selection is one of the most important choices on the farm. Crop genetics determine a significant portion of the yield potential and resource use efficiency. Crop types and genetics that use water more efficiently will become increasingly imp
Drought Tolerance Guide for Corn in Utah
Crop variety selection is one of the most important choices on the farm. Crop genetics determine a significant portion of the yield potential and resource use efficiency. Crop types and genetics that use water more efficiently will become increasingly imp
Drought Tolerance Guide for Small Grains in Utah
Crop variety selection is one of the most important choices on the farm. Crop genetics determine a significant portion of the yield potential and resource use efficiency.
Economic Feasibility of Solar Photovoltaic Irrigation Systems
The Great Basin is primarily located in Nevada, western Utah, and small sections of southern Oregon and Idaho. The Great Basin is noted for its arid conditions and high percentage of publically owned land. The potential for solar energy generation in the
Energy Conservation with Irrigation Water Management
Irrigators in Utah experienced rapidly increasing energy costs from the mid 1970s to the late 1980s. These costs remain relatively high. Those who are pumping from deep wells are particularly interested in ways to cut back on energy use without doing away

Evapotranspiration and Precipitation Data for Calculating Irrigation Water Requirements in Utah
In this fact sheet, we calculated average reference evapotranspiration and precipitation data for multiple locations in Utah, USA. To accomplish this, we collected the data from the Utah Climate Center and compiled it to show an average of 20 years of dat
Grass Pasture Response to Water and Nitrogen
The objective of this project is to study the response of pasture grass varieties to weather, irrigation, and fertility in a field experimental plot at a high elevation. The water variable is accomplished with a line source sprinkler irrigation system. Tw
Guide to Irrigation Sprinkler Packages for Pivots and Laterals
Guide to Irrigation Sprinkler Packages for Pivots and Laterals
How Good is Your Water Measurement?
Accurate water measurement is essential to maintaining equity of water delivery within an irrigation company or water districts. Good management of our scarce water resource is dependent upon quantifying supplies and uses with accurate measurement techniq
Irrigation Canal Lining?
Irrigation canals placed in native soil or lined with earth can have seepage water losses varying from 20 percent to more than 50 percent. Well designed, new compacted earth lined canals can have reduced seepage losses similar to concrete lined channels.
Irrigation Water Loss and Recovery in Utah
When deciding which irrigation systems to adopt, permit, or promote, it is important to consider how their efficiency and losses affect the water balance of Utah’s watersheds and drainage basins. Irrigators have no control over precipitation and only limi
Irrigation Water Quality Sampling Guide
The suitability of a water source for irrigation depends on the water quality, and some sources may be altogether unsuitable for practical use.
Irrigation of Safflower in Northern Utah
Most safflower in Northern Utah and Southern Idaho is grown under dryland conditions; however, irrigated safflower can provide higher yields and increase net returns. The objectives of the studies were to determine impact of irrigation on safflower yield
Managing Saline and Sodic Soils and Irrigation Water
Salt is important in plant and soil management. Excessive salt concentrations in soil can cause water to be less available to plants because of the osmotic forces of salt in the soil water. Excessive concentrations of some salt ions can also be toxic to p
Managing Soil pH for Crop Production in Calcareous-Alkaline Soil
In semiarid soils of the Western U.S., altering soil pH is not easily accomplished nor straightforward. Recall that pH is a measure of the acidity or alkalinity of a substance. More specifically, Utah’s soil pH range can be 1,000 times more acidic or alka
Mobile Drip Irrigation for Pivots and Laterals
New technologies like MDI have the potential to improve irrigation efficiency thereby increasing water available to the crop and conserving water by reducing loss. If you are considering MDI on your farm, it will be important to carefully review its poten

Precision Irrigation Guide for Center Pivots
Precision irrigation is a process involving technology and specialized equipment to improve the efficiency and effectiveness of agriculture irrigation management. This management process is beneficial in allocating water based on spatial variability throu
Sodic Soils in Utah
Sodic soils are soils with excess sodium. Sodic soils are encountered with increasing frequency in Utah, usually in the lower, flatter areas of our valleys. Sodic soils probably developed over many years when the water table was high and the soils were to
Soil Sampling Guide for Crops
Why conduct soil sampling for crops? The answer is simple and intuitive for most involved in agriculture. Regular soil sampling, testing, and associated guidance on fertilization and soil amendments help develop and maintain more productive and healthy
Strategies for Deficit Irrigation of Forage Crops
Deficit irrigation strategies with varying effectiveness can be employed in many cases to maximize production and profit. These strategies can include modifying irrigation schedules, concentrating irrigation to critical crop growth stages, reducing rates,
Ten Considerations for Solar-Powered Irrigation in Utah
Generating power from solar energy used to be one of the most expensive options in Utah. This scenario is changing. According to the American Council on Renewable Energy (ACORE, 2021), the cost of solar power production went down by 90% between 2009 and 2
Understanding Irrigation Water Optimization
It is important to consider the possible hydrologic impacts of irrigation optimization efforts to avoid implementing practices that have little appreciable effect relative to the desired outcome. Examples of desired outcomes include increasing supply reli
Variable Frequency Drives for Irrigation Pumps
A VFD can make sense in a variety of irrigation applications. Here are 6 of the major applications where one might consider a VFD (also see Henry and Stringham, 2013 and USDA-NRCS, 2010):
Water Rights in Utah
If you are connected to a municipal system, your water is probably categorized as “culinary or municipal water” and is used for everything from drinking and bathing to washing the car to watering tomatoes. However the Utah Division of Water Rights takes a
25 Rules of Thumb for Field Crops
University Extension services are widely known for scientific information on best practices for field crop production. Many Extension experts commonly offer the same tips or "rules of thumb" to growers. This article is certainly not a comprehensive list o
Irrigation Advance Sensors Are Having Large Impacts in Surface Irrigation
There are many good things about surface irrigation, but the labor requirements and large water withdrawals can diminish its feasibility in situations with limited access to labor or water. In this fact sheet, we will describe two of these systems current