Agricultural Irrigated Land and Irrigation Water Use in Utah
Introduction
Utah is considered the second driest state in the United States (Utah Division of Emergency Management [UDEM], 2022). The average precipitation for 1981–2020 was 14 inches per year in Utah1 (PRISM Climate Group [PRISM], 2021). As a result, much of the agriculture and horticulture in Utah depends upon irrigation. This article is a summary of several estimates of the extent of agricultural irrigation in Utah and some associated trends.
Irrigated Agricultural Lands in Utah
It is difficult to determine with certainty the total irrigated agricultural area of Utah. For example, should that include only land currently irrigated? Should land not presently irrigated but that has been irrigated in the past and will be in the future be included?
Several estimates of irrigated land in Utah exist from official sources. The source with the longest record is the U.S. Department of Agriculture - National Agricultural Statistics Service (USDA-NASS), which has included data on irrigation in Utah since the 1890 Census of Agriculture. Over time, the Census of Agriculture has included varying data related to irrigation. Since 1979, USDA-NASS has published what is now known as the Irrigation and Water Management Survey in conjunction with the Census of Agriculture published every five years. As the name suggests,
Highlights
- The amount of irrigated agricultural land in Utah has been relatively constant at approximately 1.1 to 1.2 million acres since the Great Depression.
- Agricultural irrigation water withdrawals
and consumptive water use have been
relatively constant over the last several
decades, with possible declines in
diversions in the last decade. - Sprinkler irrigation is now the most
common method of agricultural irrigation in terms of area irrigated. - Over 80% of irrigated agricultural lands in Utah are used to produce alfalfa, pasture, or other hay crops.
the data presented in the Irrigation and Water Management Survey are based on surveys rather than measurements. The U.S. Geological Survey (USGS) has also published estimates of irrigated land since 1985 as part of its Estimated Use of Water in the United States reports, which are also published every five years. In addition to these federal sources, the Utah Division of Water Resources (UDWRe) maintains a geospatial database of irrigated land in Utah, which is currently available for 2020 through the Utah Geospatial Resource Center (UGRC, 2022). Finally, Utah State University (USU) Extension also conducted irrigated acreage surveys during the mid-1990s to mid-2000s. Data from these sources were compiled to understand the overall trend in irrigated area in Utah (Figure 1).
Based on the USDA-NASS data, there was a steady increase in irrigated land in Utah from 1890 to 1920. Then, there was a possible decrease in irrigated land during the Depression years. Following that period, irrigated land has remained relatively consistent near 1.1 million acres, according to USDA-NASS numbers. The USGS estimated a mean of about 1.3 million acres of irrigated land in the last three decades. The USU Extension estimates from 1995 to 2000 are also about 1.3 million acres. Based on the UDWRe data (UGRC, 2022), there were about 1.35 million acres of irrigated agriculture in 2020, though some data in that dataset are known to not represent irrigated land. The 2007 survey by USU Extension included 1.47 million acres of irrigated land, which is the largest quantity of any in the compiled data.
The variability of the results presented in Figure 1 is evidence of the uncertainty involved in quantifying the total irrigated area of Utah. This variability results from differences in quantification methods, interannual variability, etc. However, many of the estimates are close, and it is reasonable that Utah’s active irrigated agricultural area may be approximately 1.1 to 1.2 million acres (1,700–1,900 square miles). By comparison, Utah’s total land area is about 82,200 square miles (Census Bureau, 2018). Therefore, about 2.1% to 2.8% of Utah’s land is irrigated agriculture. In turn, Utah contains about 2.2% of the total 3.5 million square miles of land in the U.S.2 Based on the 2018 Irrigation and Water Management Survey, there were about 60 million acres of irrigated agricultural land in the United States. Utah had about 2.1% of the total irrigated land in the U.S. Consequently, Utah ranked 15th among states in irrigated area. Neighboring states of Idaho, Colorado, and Wyoming all had more irrigated land, while Arizona, Nevada, and New Mexico had less.
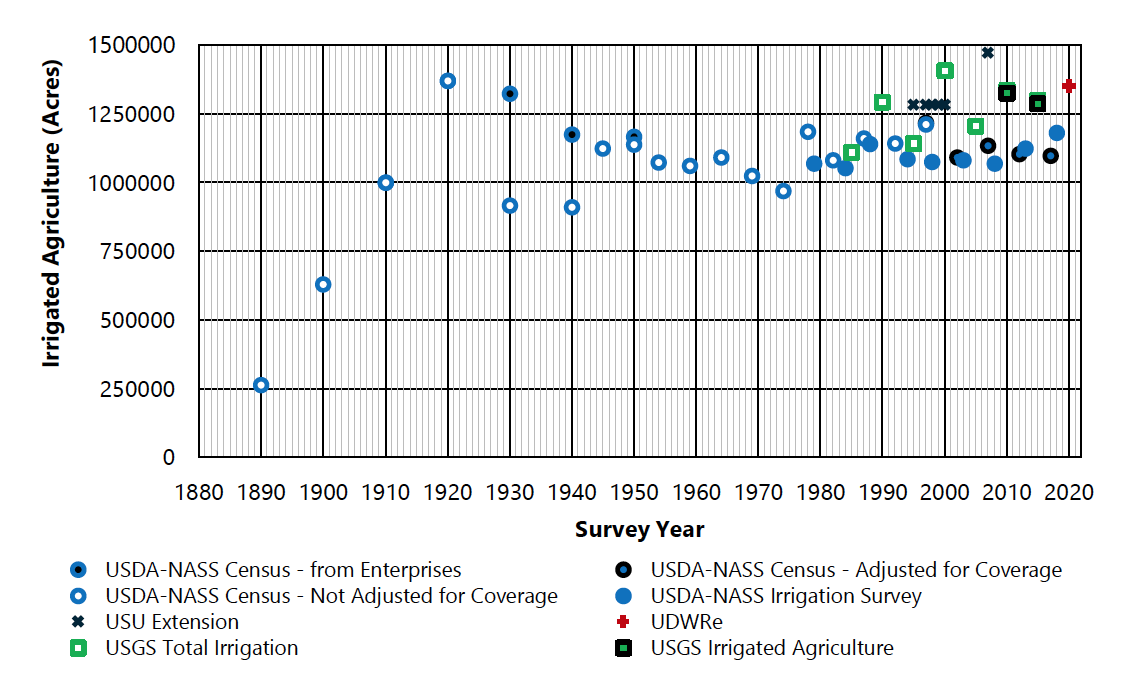
Note. The USGS total irrigation may include some golf courses.
Distribution of Irrigated Agricultural Lands in Utah
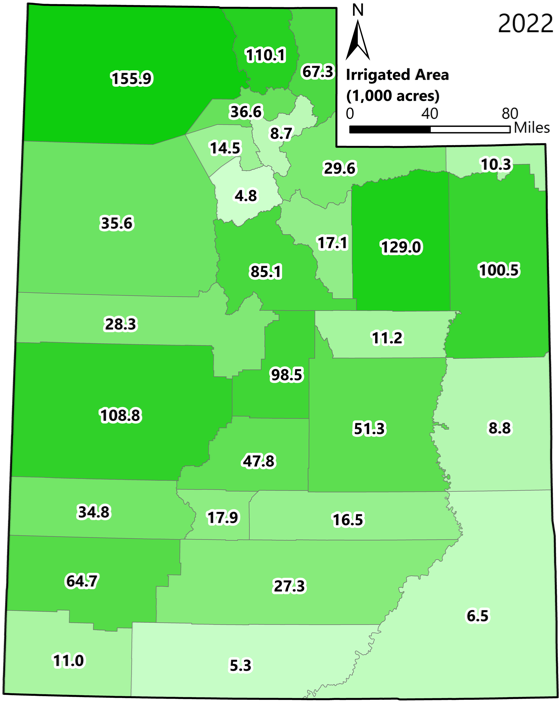
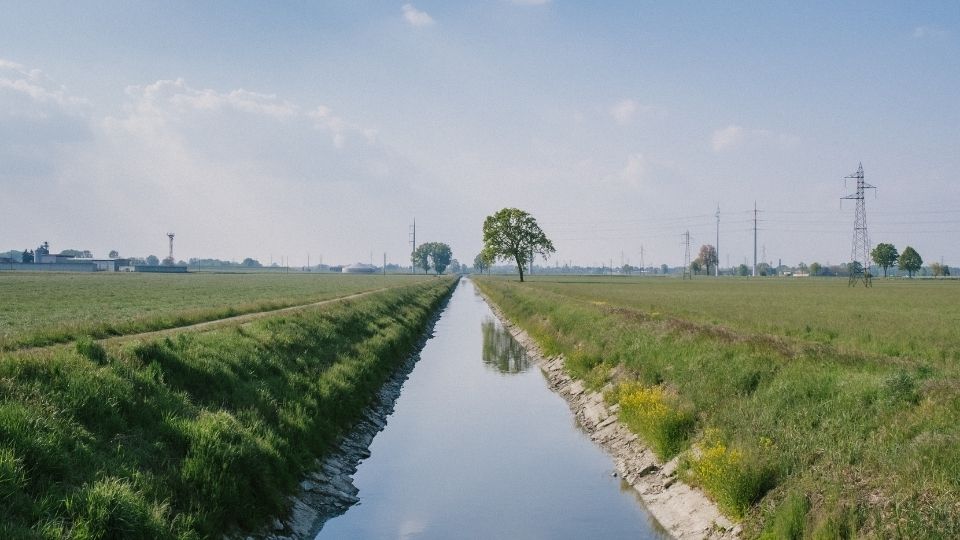
Utah’s distribution of irrigated land is constrained by topography, climate, soils, water availability, and infrastructure. Much of Utah is mountainous and is, therefore, too high in elevation or too steep for irrigation. High elevations are comparatively cool and restrict agricultural production. Soil depth, soil chemistry, presence of rocks, etc., can also limit the land’s arability. Much of the irrigation in Utah is concentrated in valley bottoms where surface water exists (Figure 2). The West Desert and the Eastern Plateau are relatively devoid of irrigated agriculture.
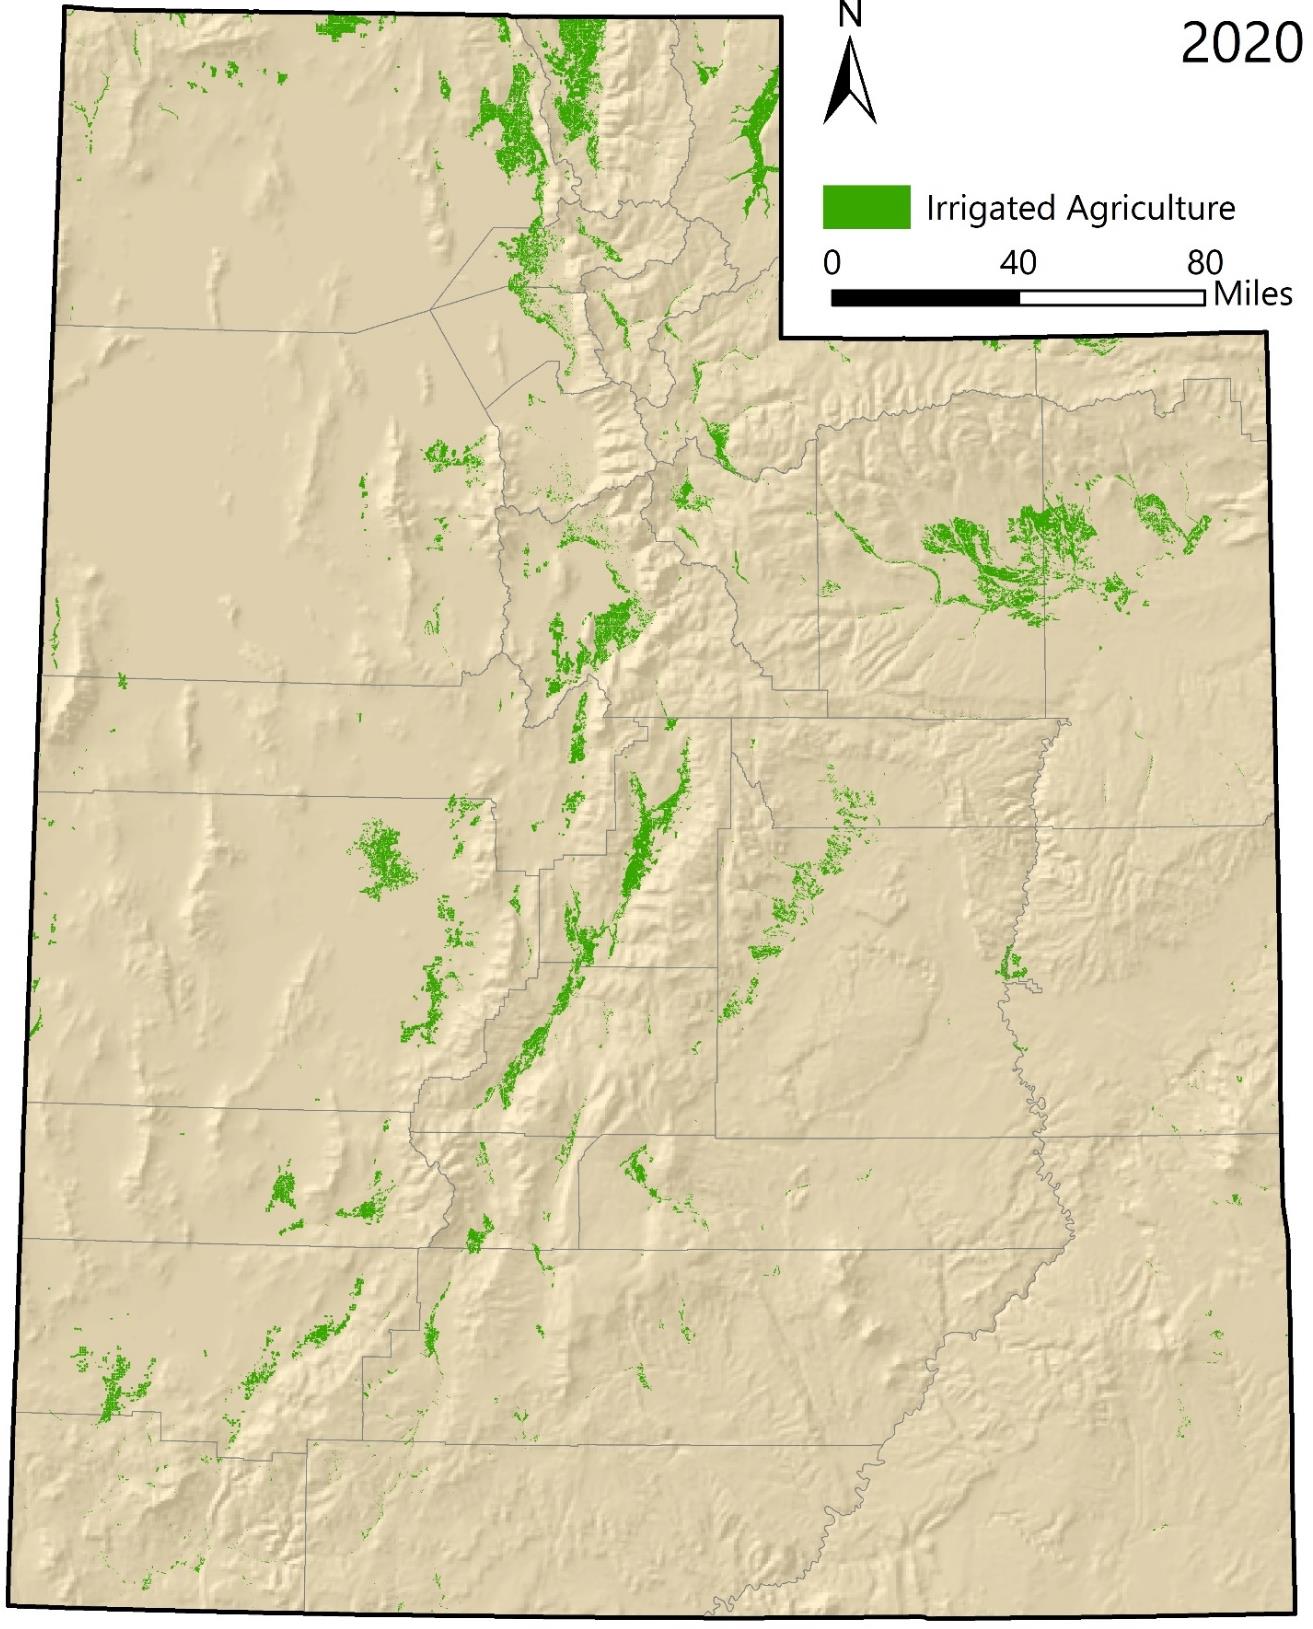
Note. Some lands on the map are known to not be irrigated.
Sources: UGRC (2022), Natural Resources Conservation Service (NRCS) (2009a, 2009b), and USGS (2022).
County-level irrigated land data have been collected by the USGS since 1985. At that time, Box Elder County had the largest estimated amount of irrigated land at about 108,000 acres and Grand County had the least at about 3,900 acres (Figure 3). In 2015, the USGS reported 146,000 acres of irrigated land in Box Elder County, again the largest of any county. The county with the least irrigated land in 2015 was Salt Lake County with 6,100 acres. The increase in acreage from 1985 to 2015 may not be a true representation of trends in agricultural irrigation (see Figure 1). For example, Box Elder County irrigated land was similar in the 1989-1999 UDWRe analysis as in 2022.
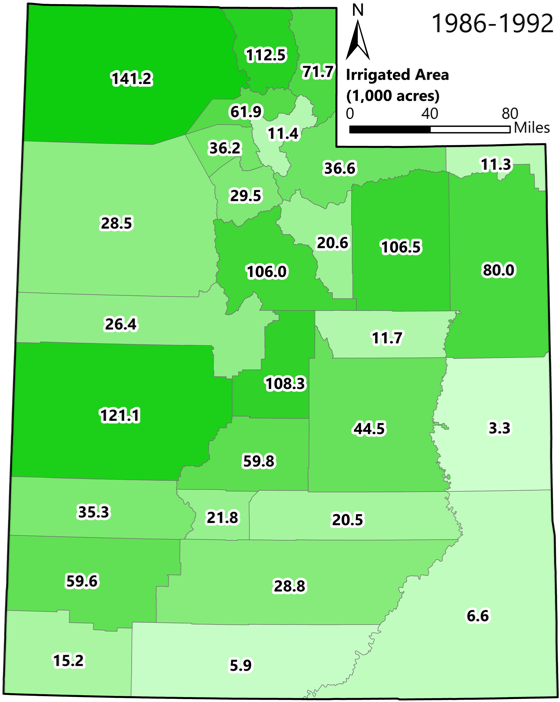
Note. The 1985 data may include some golf courses.
Agricultural Irrigation Methods in Utah
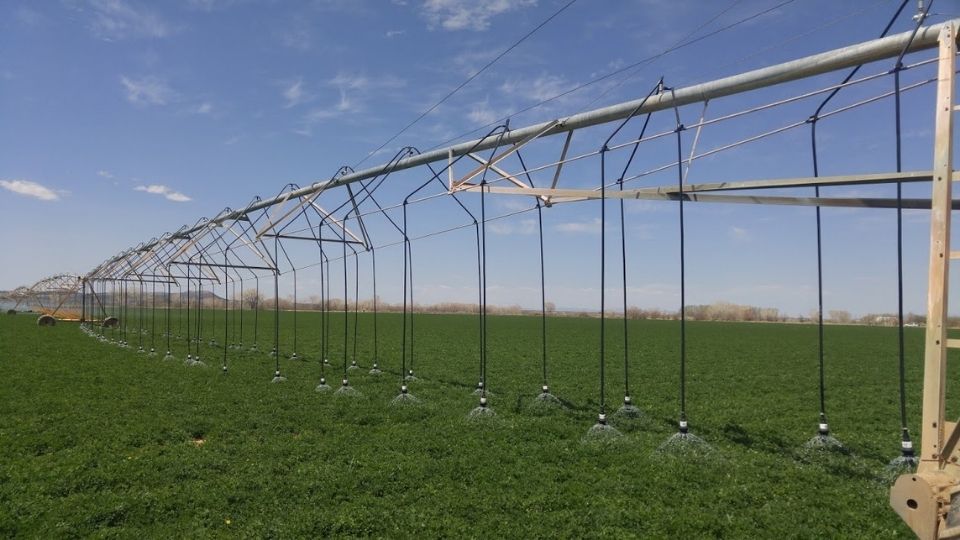
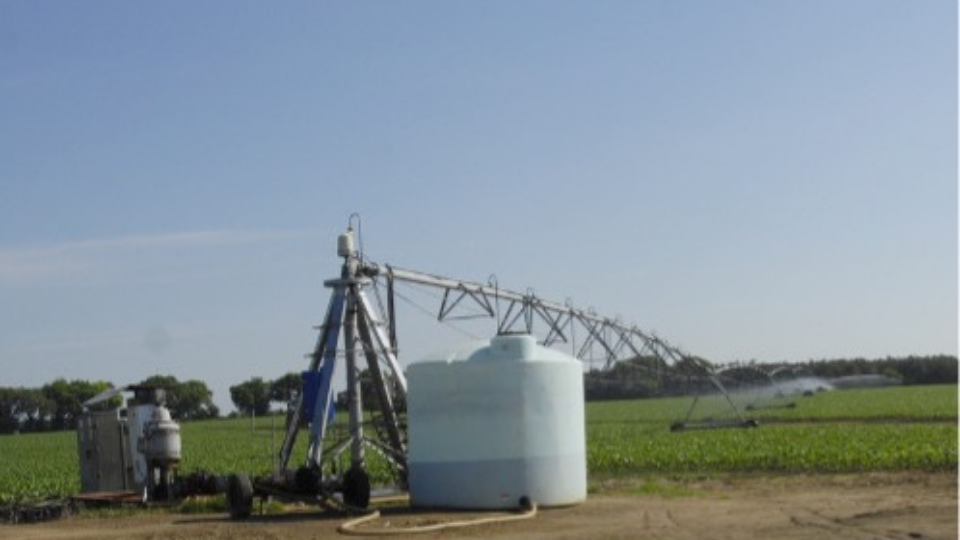
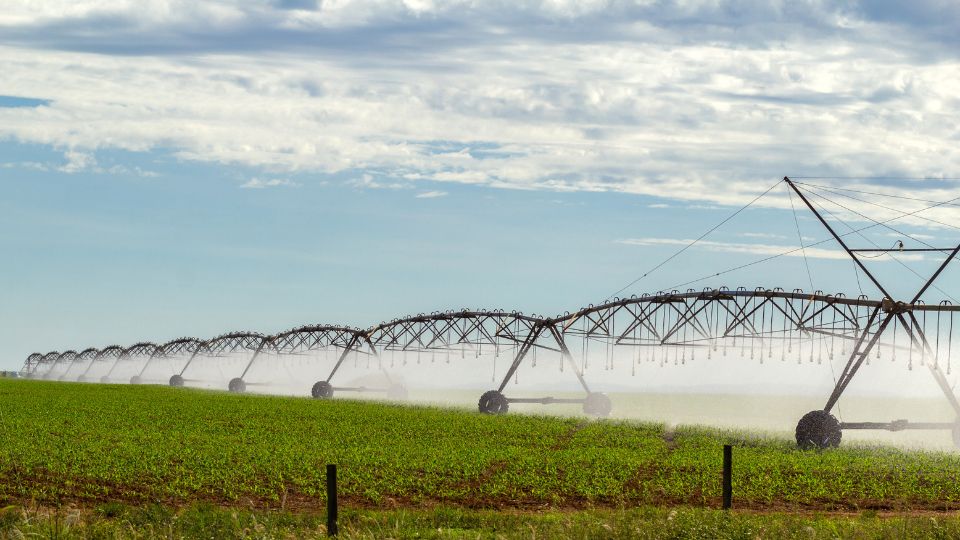
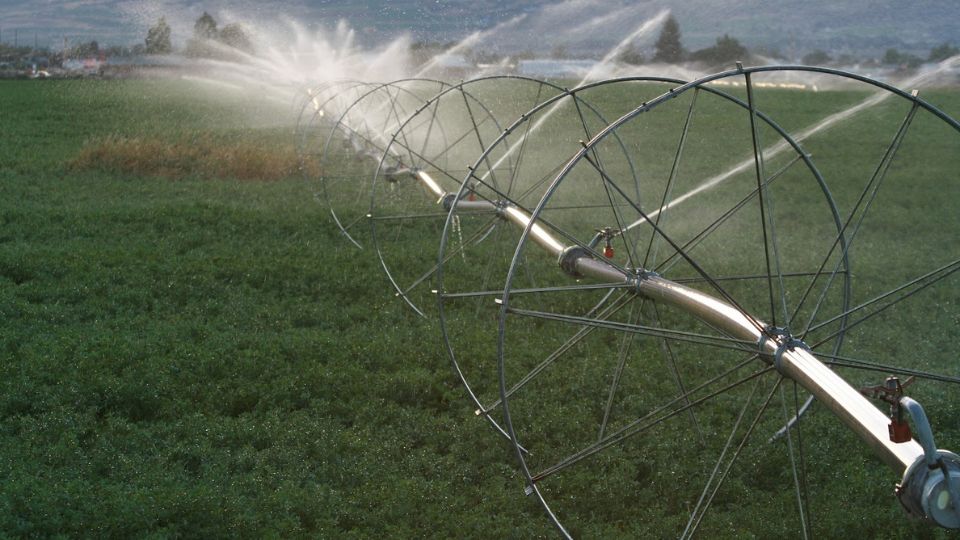
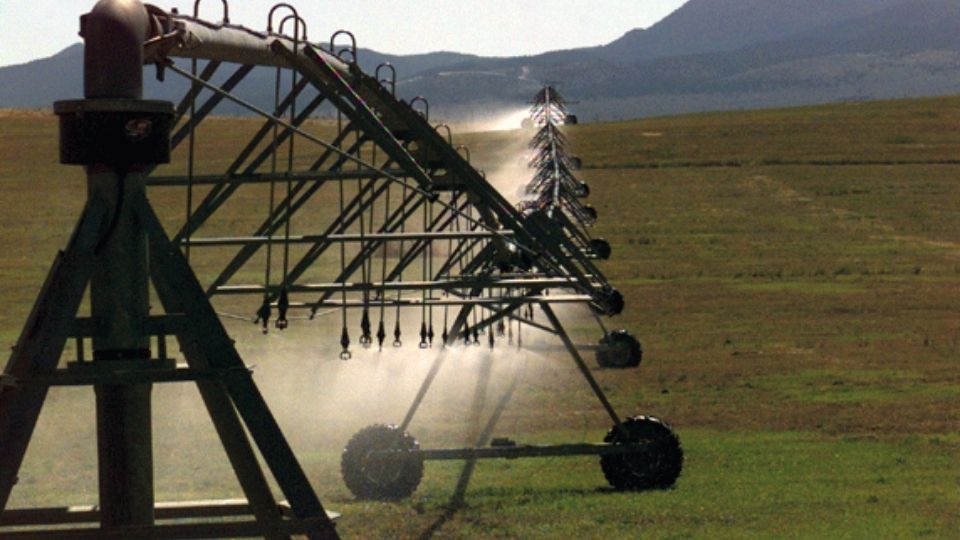
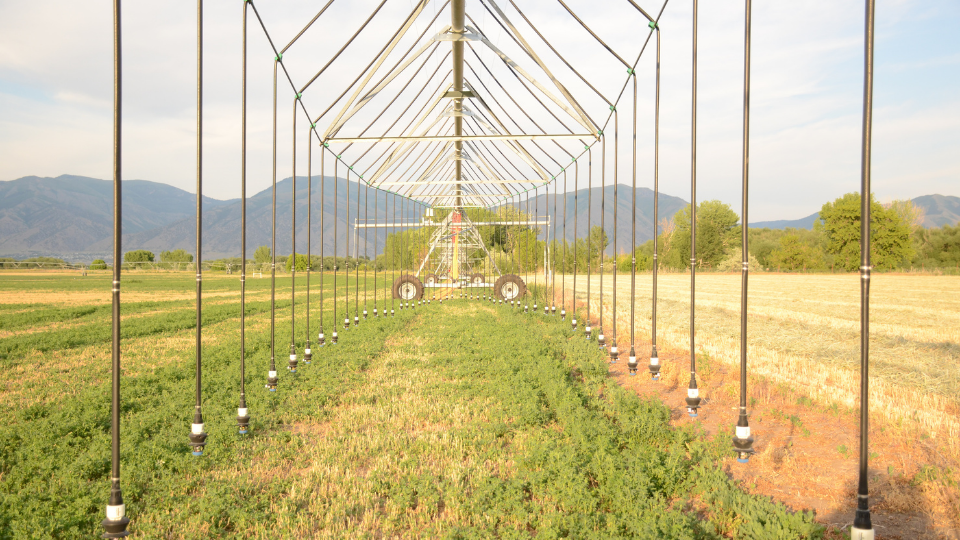
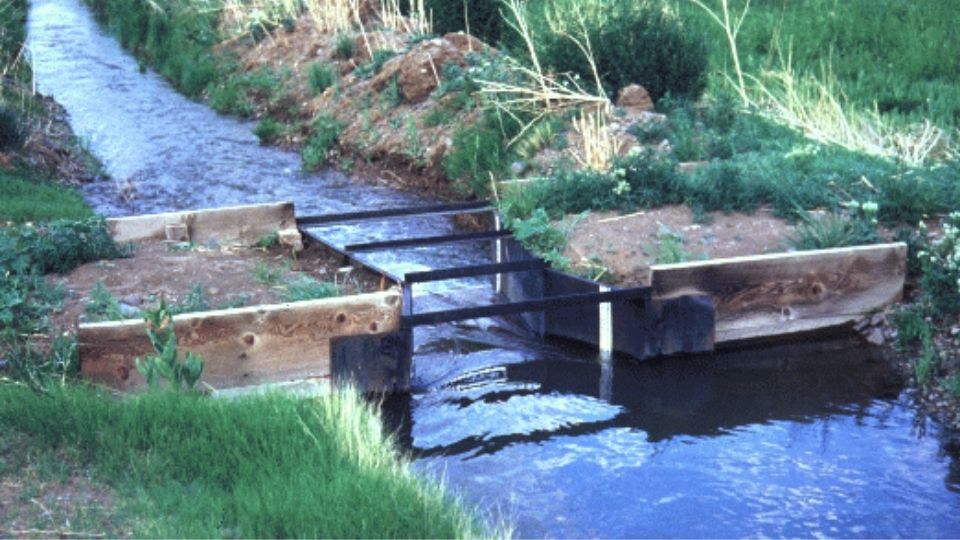
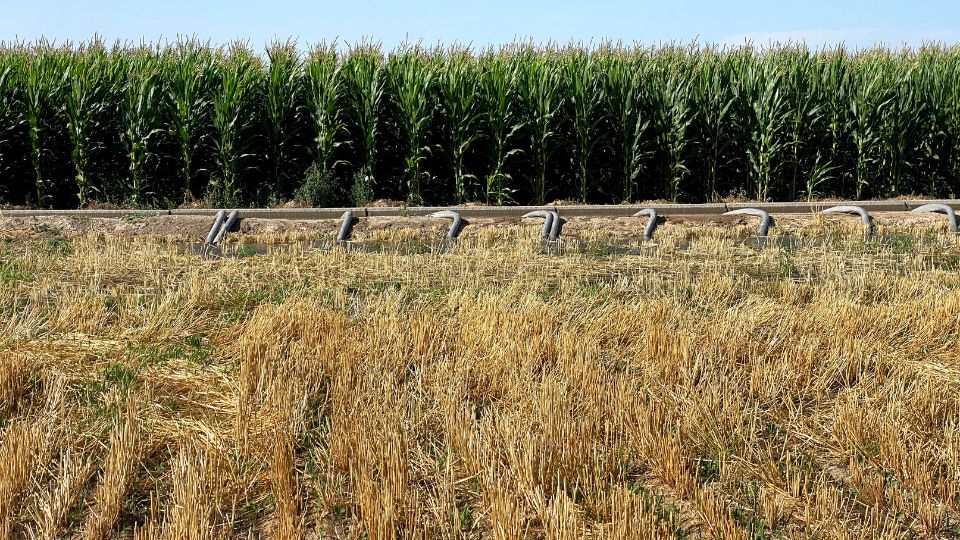
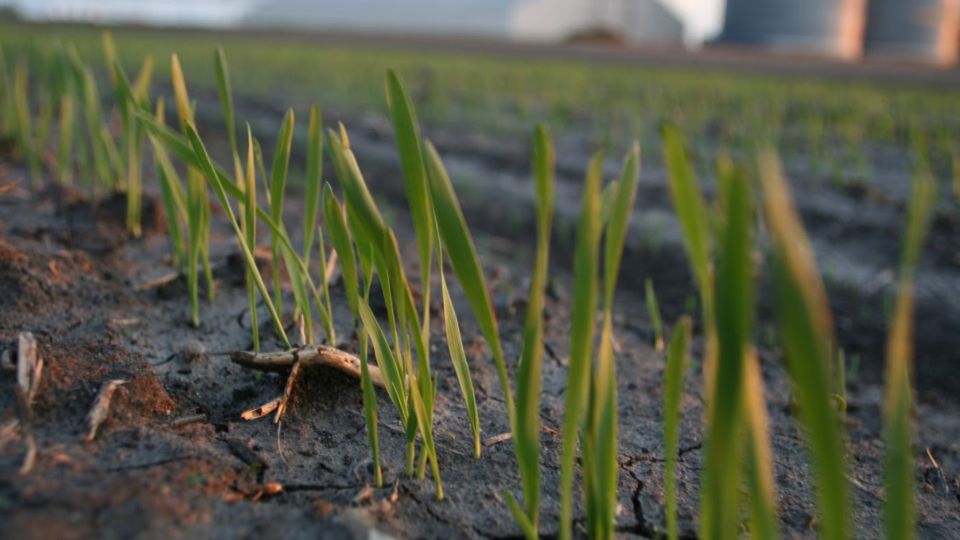
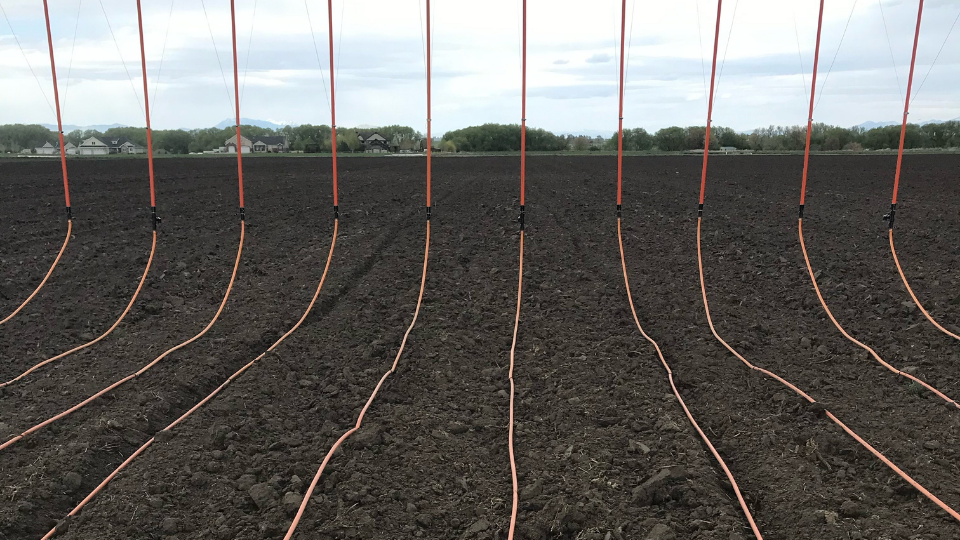
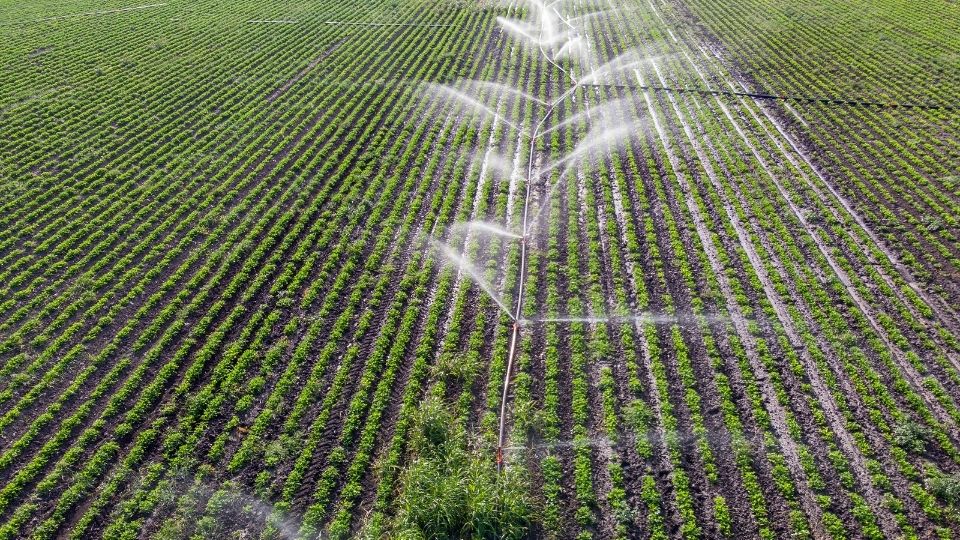
Utah agricultural lands are irrigated using various methods, including surface methods (e.g., furrow, basin, wild flooding), sprinkler methods (e.g., center pivots, wheel line systems, hand line sprinklers), and others, like subirrigation and drip. Many of the irrigated lands in Utah have been irrigated for a century or more. Early irrigation development occurred near surface water sources and in areas serviceable by human-made canals. These lands were first irrigated using surface irrigation methods or subirrigation, which involves controlling the water table to irrigate crops from below. Over time, pump technologies developed that enabled expanded development of groundwater resources and water conveyance uphill. The increased adoption of such technologies is evident in data reported by USDA-NASS (Figure 4). Sprinkler technologies were also developed that allowed for irrigating lands unsuitable for surface irrigation.
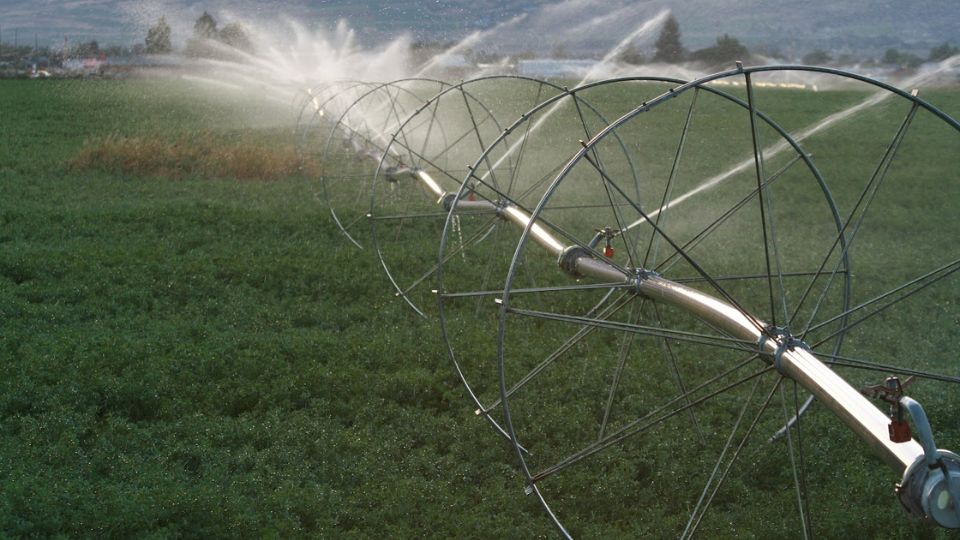
With the advent of sprinklers and the gradual increase in sprinkler-irrigated land came a corresponding decrease in surface irrigation in Utah (Figure 5). USDA-NASS first reported sprinkler use in 1950, which corresponds to a timeframe when significant improvements had been made in sprinkler irrigation (Keller & Bliesner, 2000). In 1950, there were an estimated 1,770 acres of sprinkler-irrigated agricultural land in Utah (less than 0.2% of the state’s irrigated area). By 2013, more land was irrigated by sprinklers than by surface irrigation. As of the 2018 survey, land irrigated by sprinklers was about 666,000 acres (56% of Utah’s irrigated agricultural land). These same trends are evident, though less clear, when the other datasets (USGS, USU, UDWRe) are considered (Figure 6).
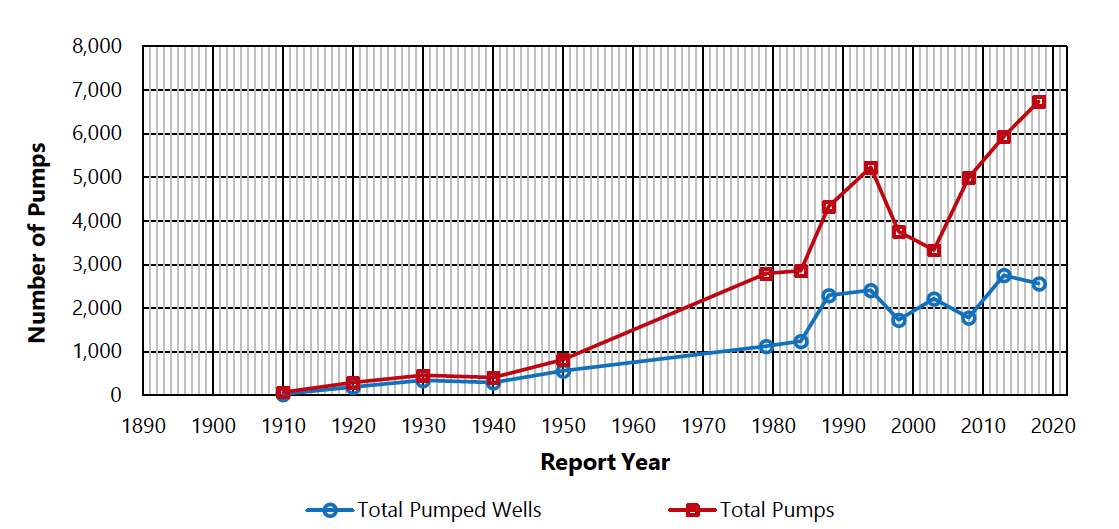
Note. Total pumps in 1910 is for total pumping plants.
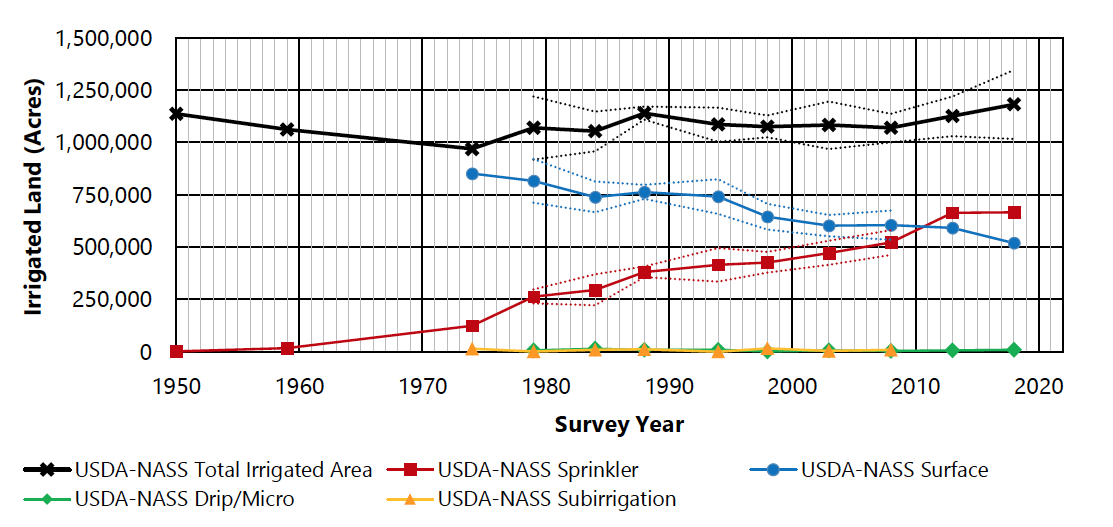
Note. Dashed lines represent 95% confidence intervals for the plotted values. Subirrigation was included in surface irrigation starting in 2013. Some areas were irrigated using multiple methods.
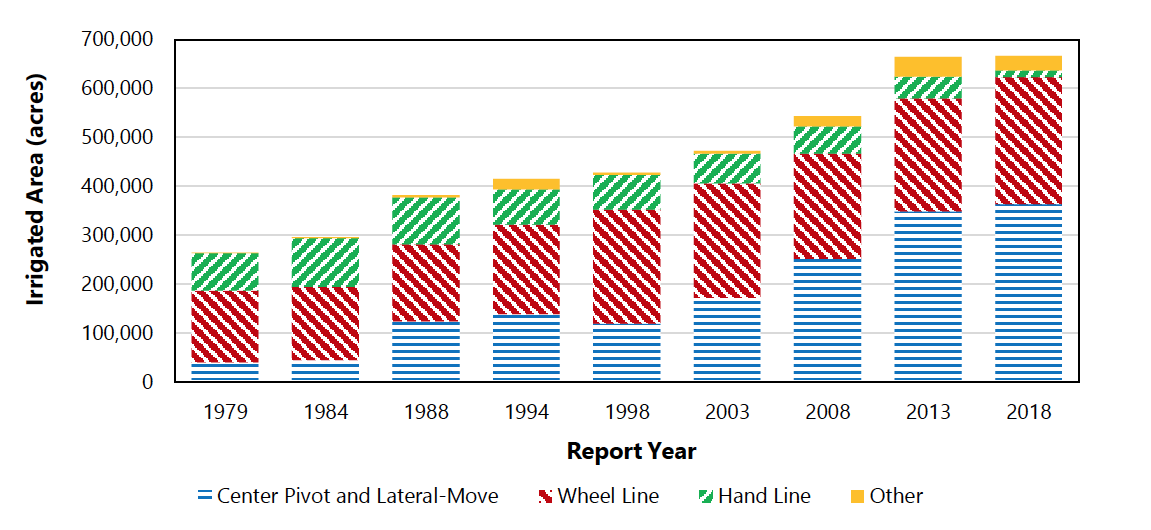
USDA-NASS began reporting subtotals for land irrigated using different sprinkler methods in 1979. From that time until the late 1990s, the growth in sprinkler-irrigated area was from a combination of increased wheel line, center pivot, and lateral-move irrigation (Figure 7). Since the late 1990s, the increase in area irrigated by sprinkler systems has been in center pivot and lateral-move systems. This has been associated with a decline in hand line systems. Decreased labor requirements and, more recently, remote access for center pivots are likely drivers of these changes.
As of 2018, USDA-NASS estimated that Utah had the second largest amount of land under wheel line systems of any state, behind only Idaho. This area represents about 14% of the total land under wheel line systems in the U.S. In the same year and survey, Utah had about 3% of the total area irrigated by hand line systems in the U.S., ranking sixth overall. Utah ranked far less for center pivots, solid sets, or big guns.
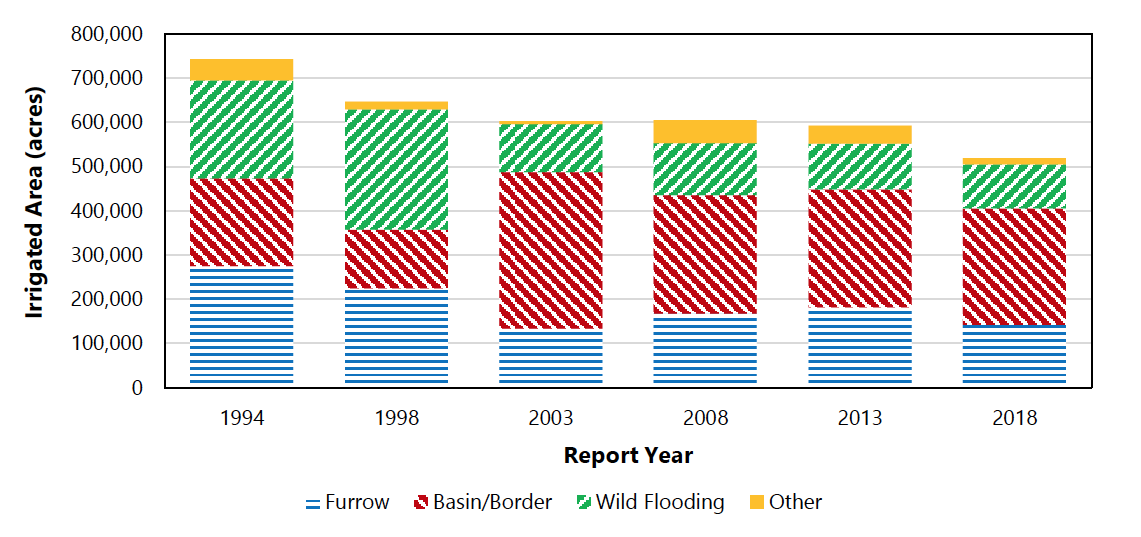
Changes in types of surface irrigation have been less evident than for sprinkler systems. However, USDA-NASS data shows a general decline in furrow irrigation and wild flooding over the past few decades (Figure 8). Utah ranked eighth among states for wild flooding, with about 5% of the total such area in the U.S. Utah had about 3% of the U.S. area of both border/basin irrigation and furrow irrigation.
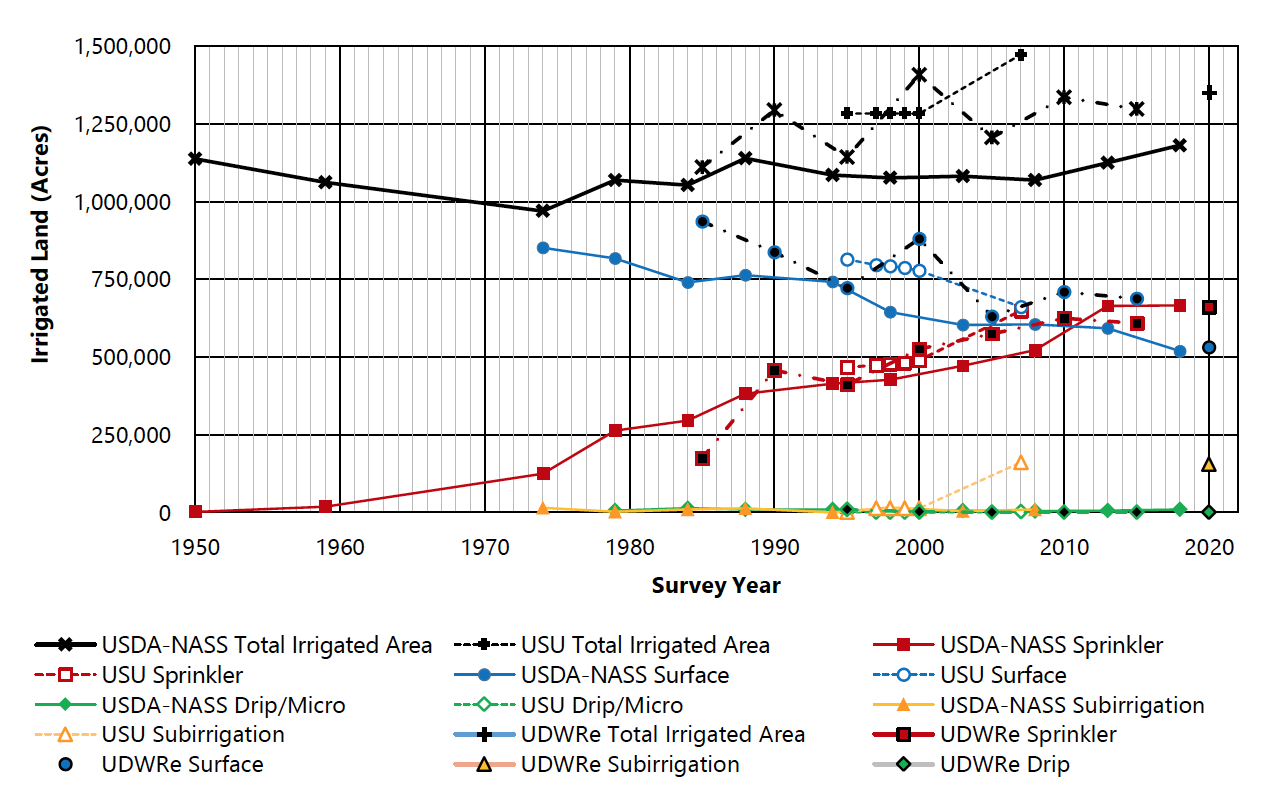
Notes. For USDA-NASS, subirrigation was included in surface irrigation starting in 2013. Some areas were irrigated using multiple methods for USDA-NASS. This is not the case for the other three estimates. The jump in subirrigation in the 2007 USU data is likely a change in survey methodology and may include land that was not considered irrigated in previous USU surveys. The USGS data may include some golf courses.
Note. Wheel-move acreage for 1994 and prior includes other types of “mechanical move” sprinklers. “Other” includes big guns and solid sets along with the USDA-NASS “Other” classification.
Note. “Other” includes subirrigation in 2013 and 2018.
Agricultural Irrigation Withdrawals in Utah
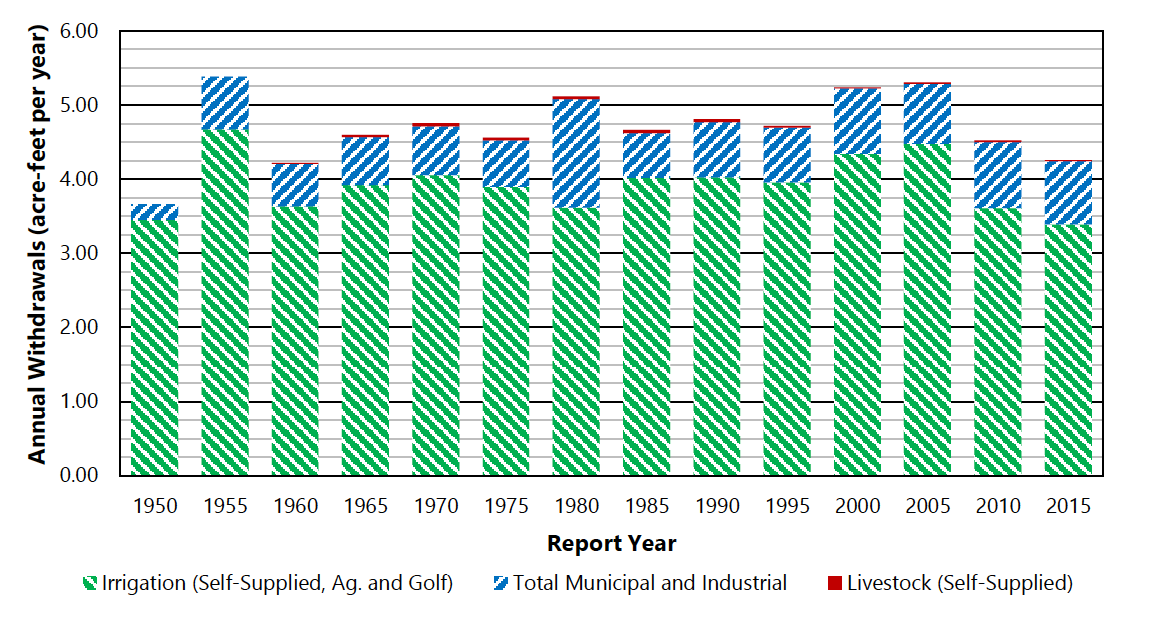
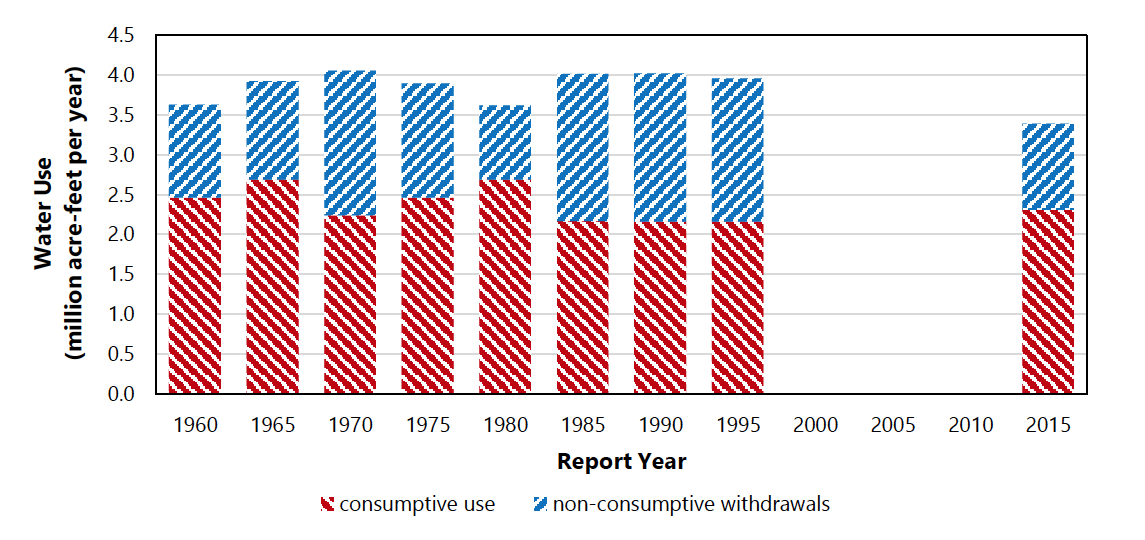
The USGS has reported estimated irrigation withdrawals (diversions or groundwater pumping) for Utah since 1950. Data included golf courses for at least some of those years. Overall, there was little change in agricultural water use from 1950 to 2015 (Figure 9). There has been, however, an increase in municipal and industrial withdrawals. No clear trend exists in the municipal and industrial withdrawals because of the comparatively large municipal and industrial withdrawal in 1980 resulting from large public supply and industrial withdrawals. Based on these data, irrigation (including some golf courses) has accounted for an average of 84% of Utah’s total withdrawals since 1950 and 80% in 2015. This fraction was reduced to 75% more recently, based on Utah’s Coordinated Action Plan for Water, 2022.
Note. Only freshwater withdrawals are included.
Distribution of Agricultural Irrigation Withdrawals in Utah
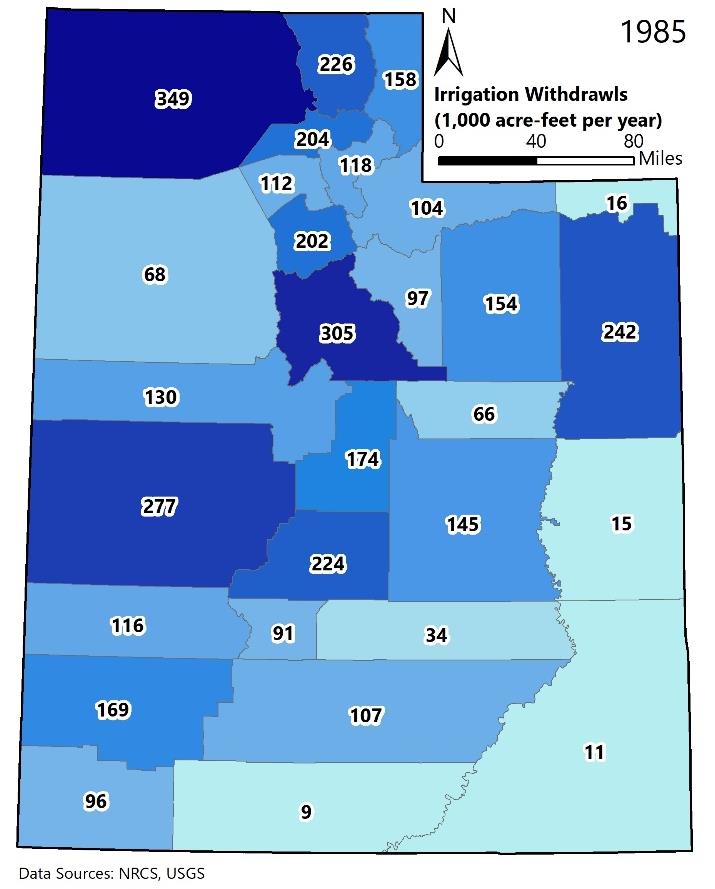
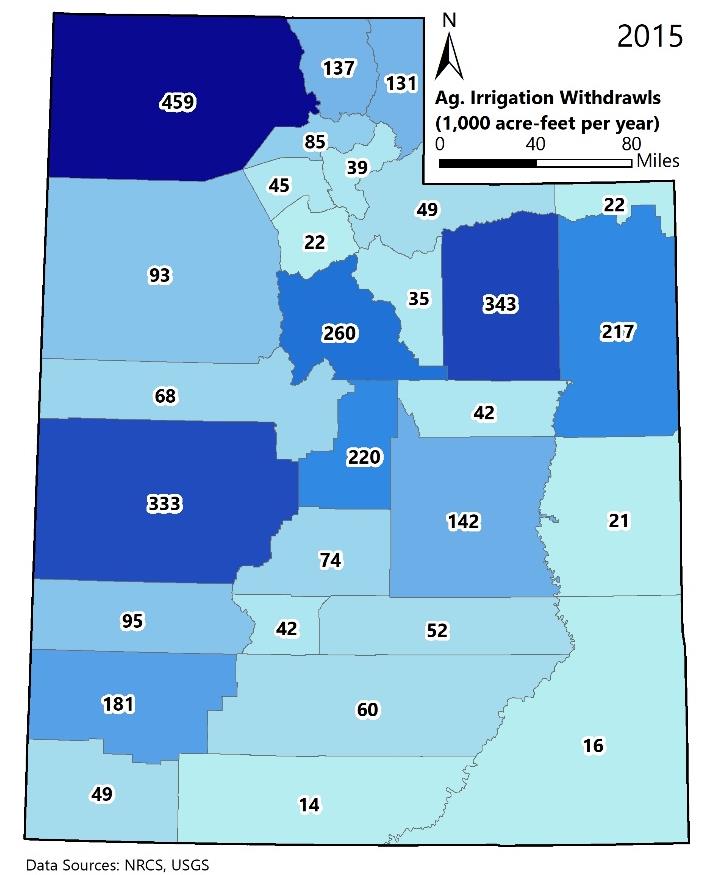
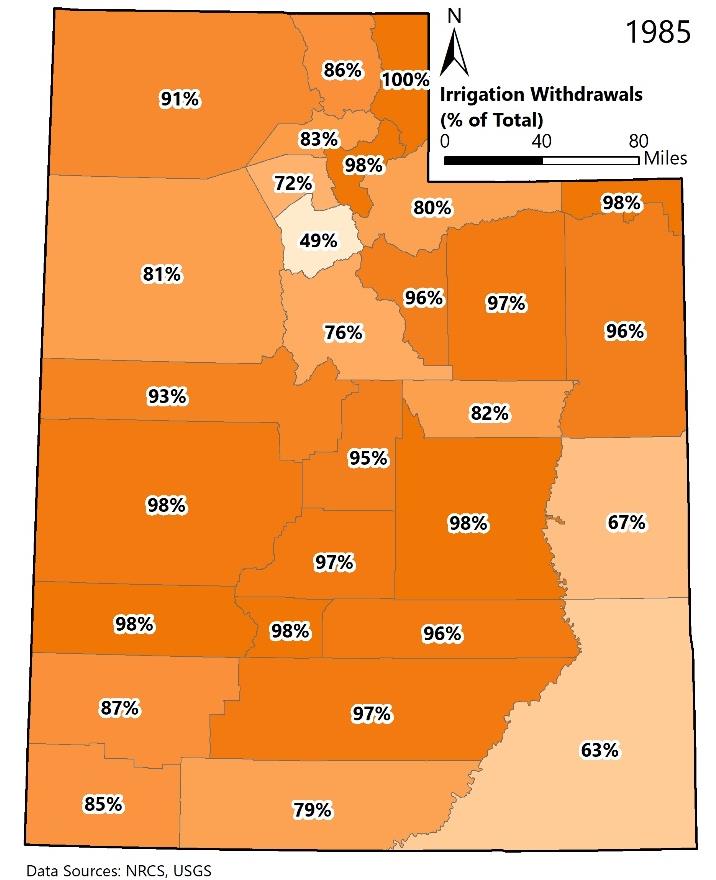
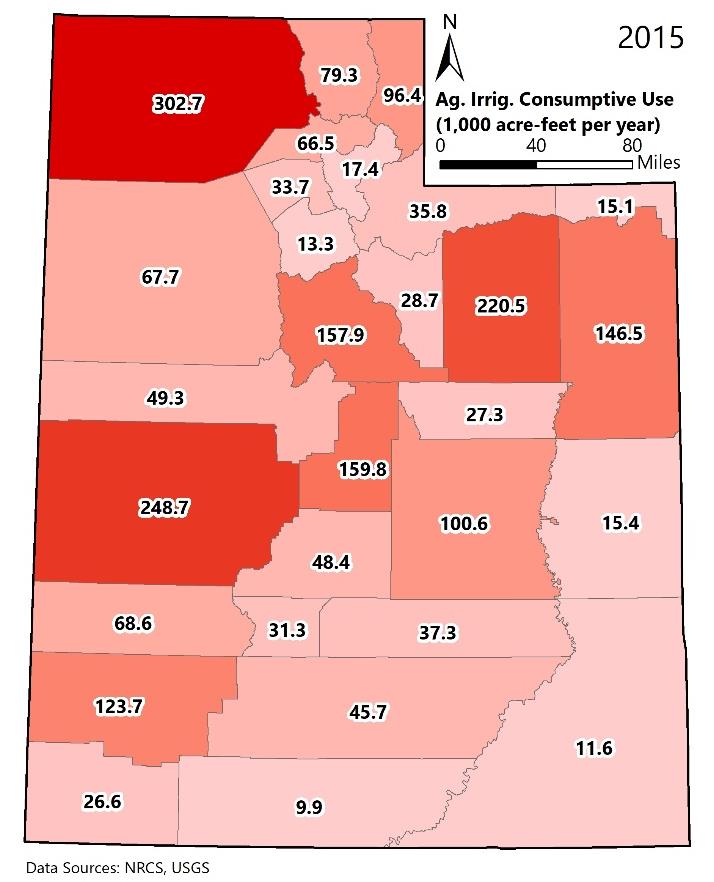
The distribution of withdrawals reported by the USGS for agricultural irrigation in Utah is correlated with the irrigated acreage, though not perfectly. In 1985, the county with the largest total withdrawal for irrigation was Box Elder at 349,000 acre-feet per year and the county with the least was Kane with 9,000 acre-feet per year (Figure 10). An acre-foot is about 325,850 gallons. In 2015, Box Elder had the greatest total irrigation withdrawal for agriculture with 459,000 acre-feet. Kane, again, had the smallest total agricultural irrigation withdrawal with 14,000 acre-feet that year.
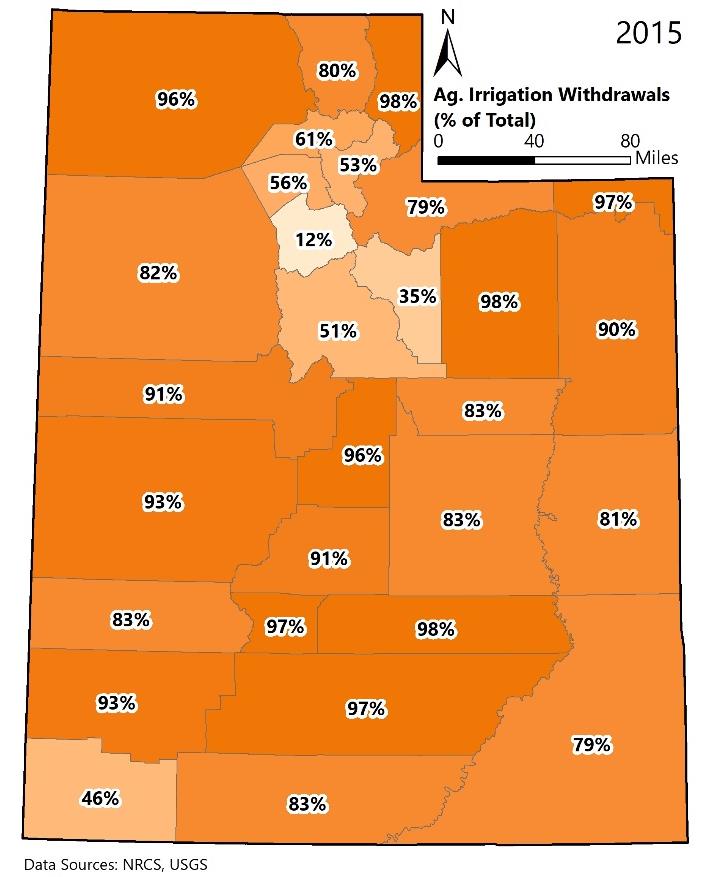
The relative changes in irrigation withdrawals are more evident when considered as a fraction of the total withdrawal for each county (Figure 11). In 1985, 49% of the total withdrawals for Salt Lake County were for irrigation. In 2015, that fraction had been reduced to 12% for agricultural irrigation and 18% when golf course irrigation was considered. The largest decreases in the percentage of total withdrawals used for agricultural irrigation were along the Wasatch Front and in Morgan, Wasatch, and Washington counties. This decrease is expected because those areas are hot spots for urban growth in the state. Some changes evident in Figure 11 between 1985 and 2015 relate to the 1985 map including some golf courses, while the 2015 map is only agriculture. Golf course irrigation was about 6% of total withdrawals in Davis, Salt Lake, and Washington counties in 2015 and about 3% in Summit and Weber counties. The rest of the counties had a smaller fraction.
Note. The 1985 data may include some golf courses.
Note. The 1985 data may include some golf courses.
Consumptive Use of Agricultural Irrigation Water in Utah
In addition to the overall water withdrawal for irrigation, it is important to understand the fraction of that withdrawal consumptively used. Consumptive use is the loss of water from a hydrologic system. Most commonly, for irrigation, consumptive use is considered to be evapotranspiration of irrigation water into the atmosphere. Evapotranspiration is a combination of water evaporation and plant transpiration. Evapotranspiration from precipitation is not included. The USGS has provided estimates of consumptive use from irrigation since 1960 (Figure 12). Since 1960, consumptive use has accounted for an estimated average of about 62% of irrigation withdrawals in Utah, with an estimated 68% in 2015. It should be noted that methods used to estimate consumptive use have changed over the years.
Note. Estimates may include some golf courses, which accounted for about 1% of both presented values in 2015.
Distribution of Agricultural Irrigation Consumptive Use in Utah
The distribution of consumptive use among Utah counties was similar to that of irrigation withdrawals in 1985 and 2015 (Figure 13).
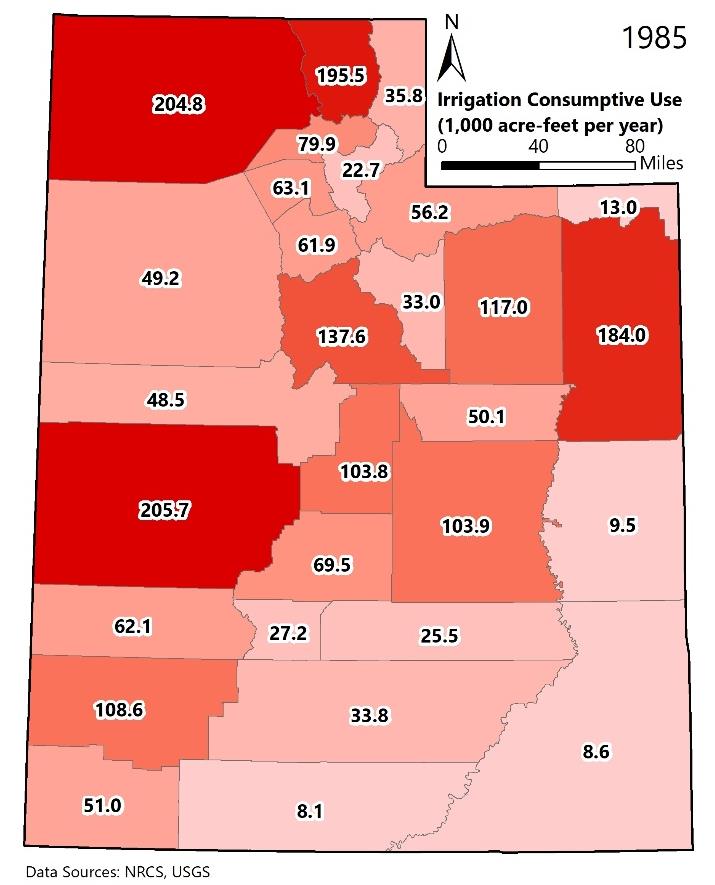
Note. The 1985 data may include some golf courses.
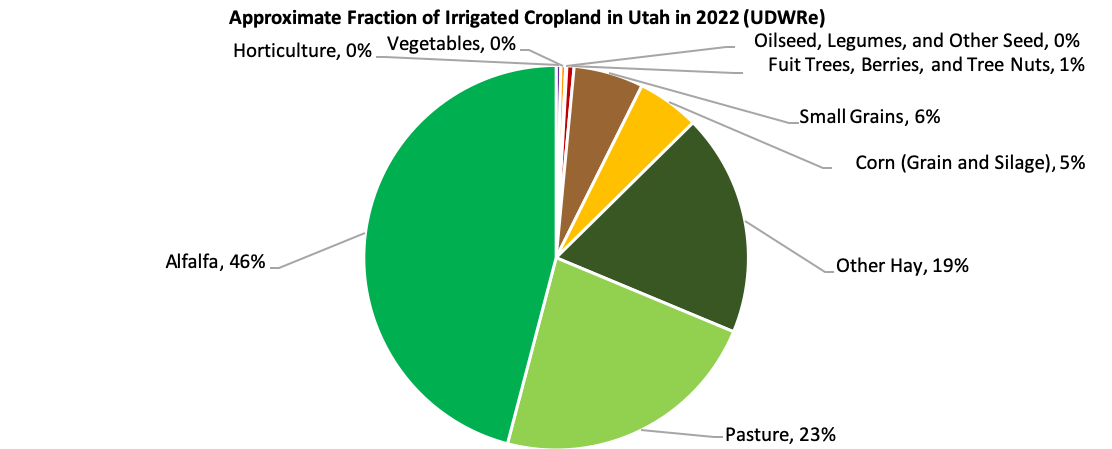
Irrigated Crops in Utah
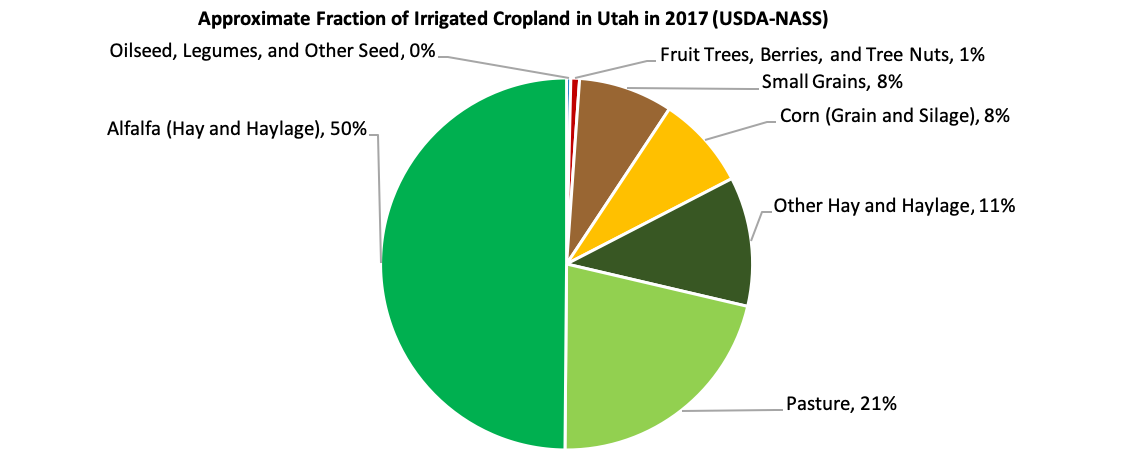
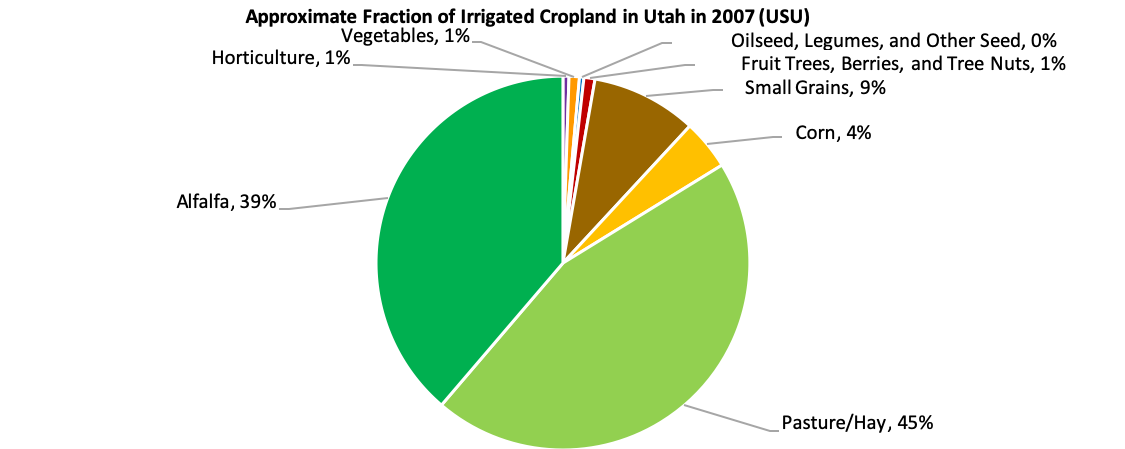
In Utah, alfalfa, other hay crops, and pasture account for over 80% of the total irrigated area (Figure 14). Roughly 15% of the irrigated area was in corn and small grains. All other crops, including orchards and vegetable crops, accounted for the remaining few percent of the irrigated agricultural area in Utah. The approximately 20% of Utah irrigated cropland that is pasture has been relatively stable between 19% and 28% since 1950 according to USDA-NASS data. The statewide irrigated crop mix reflects the significant role that livestock plays in Utah agriculture and the subsequent need for forage. Alfalfa is a dominant crop in Utah also because of the relatively high-quality alfalfa hay that can be produced in Utah compared to some other places, and for many other reasons. Furthermore, many areas of Utah are too high in elevation to grow much besides pasture and hay crops. Much of the land that was favorable for fruit and vegetable crops in Utah has been converted to urban uses. Additionally, many agricultural markets have concentrated in certain high-producing areas of the country. This has reduced the available market for some crops.
Summary
Irrigation is an important feature of agriculture in Utah. The distribution of irrigated land and irrigation water use varies across the state, based on water availability, topography, and soils. In recent years, sprinkler irrigation has overtaken surface methods as the dominant irrigation method, based on irrigated area, in Utah. About 75% to 80% of water withdrawals in Utah are for irrigation, with about 68% of that water being consumptive use. Alfalfa, other hay crops, and pasture are grown on about 80% of the irrigated agricultural lands in Utah.
Notes
1 Based on this dataset, Utah ranked third behind Nevada and Arizona, in that order.
2 In the 2020 U.S. Census, Utah’s population was 3.27 million people, which was just less than 1% of the 33.1 million total for the U.S. (Census Bureau, 2021).
References
- Governor’s Office of Planning and Budget (GOPB). (2022). Utah’s coordinated action plan for water. State of Utah Governor’s Office of Planning and Budget. https://gopb.utah.gov/waterplan/.
- Keller, J., & Bliesner, R. D. (2000). Sprinkle and trickle irrigation. The Blackburn Press.
- Natural Resources Conservation Service (NRCS). (2009a). Processed TIGER 2002 counties + NRCS additions [Geospatial dataset]. U.S. Department of Agriculture. Retrieved from https://datagateway.nrcs.usda.gov/
- Natural Resources Conservation Service (NRCS). (2009b). Processed TIGER 2002 counties + NRCS additions dissolve [Geospatial dataset]. U.S. Department of Agriculture. Retrieved from https://datagateway.nrcs.usda.gov/
- PRISM Climate Group (PRISM). (2014). 30-year normals [Gridded dataset; data created October 29, 2021]. Oregon State University. Retrieved May 13, 2022, from https://prism.oregonstate.edu/normals/.
- U.S. Census Bureau (Census Bureau). (2018). Cartographic boundary files – shapefile (2018 state 500k). https://www.census.gov/geographies/mapping-files/time-series/geo/carto-boundary-file.html
- U.S. Census Bureau (Census Bureau). (2021). 2020 population and housing state data. U.S. Census Bureau. Retrieved May 13, 2022, from https://www.census.gov/library/visualizations/interactive/2020-population-and-housing-state-data.html.
- U.S. Geological Survey (USGS). (2022). National elevation dataset [Geospatial dataset]. Retrieved from U.S. Department of Agriculture Natural Resources Conservation Service. https://datagateway.nrcs.usda.gov/
- Utah Division of Emergency Management (UDEM). (2022). Drought. In Utah Hazard Mitigation. Utah Division of Emergency Management. Retrieved May 20, 2022, from https://hazards.utah.gov/drought/.
- Utah Geospatial Resource Center (UGRC) (2022). Water related land use 2020 [Geospatial dataset]. Utah Department of Natural Resources Division of Water Resources. https://gis.utah.gov/data/planning/water-related-land/.
Published November 2022 (Revised July 2023)
Utah State University Extension
Peer-reviewed fact sheet
Authors
Burdette Barker, Matt Yost, and Cody Zesiger

Burdette Barker
Irrigation

Matt Yost
Agroclimate Specialist
PSC Dept

Cody Zesiger
Extension Associate Professor | Agriculture & Natural Resources | Davis County
Agriculture and Natural Resources
Related Research
4R’s of Irrigation Management
The research community and fertilizer industry have developed and utilized a framework termed “4R nutrient management” to help improve fertilizer stewardship. For decades, national and international organizations and institutes such as The Fertilizer Inst
Accurate Irrigation Water Flow Measurement in Pipes
Accurate flow measurement is important to irrigation water management and water rights accounting and protection. Accurate flow measurement is essential in ensuring equitable water distribution to water rights holders and shareholders within irrigation co
County-Level View of Irrigation Trends in Utah and the West
As water demand and scarcity increase simultaneously over the coming decades, water managers and growers will need to optimize water use on their irrigated lands. These challenges have been especially noticeable as the Western U.S.faces a prolonged “megad
Defense Against Drought
Utah’s climate can often be harsh and unpredictable. As the nation’s second driest state, Utah is commonly subject to droughts. Extensive statewide droughts have often lasted 5 to 6 years. It is imperative that farmers are well prepared to defend against
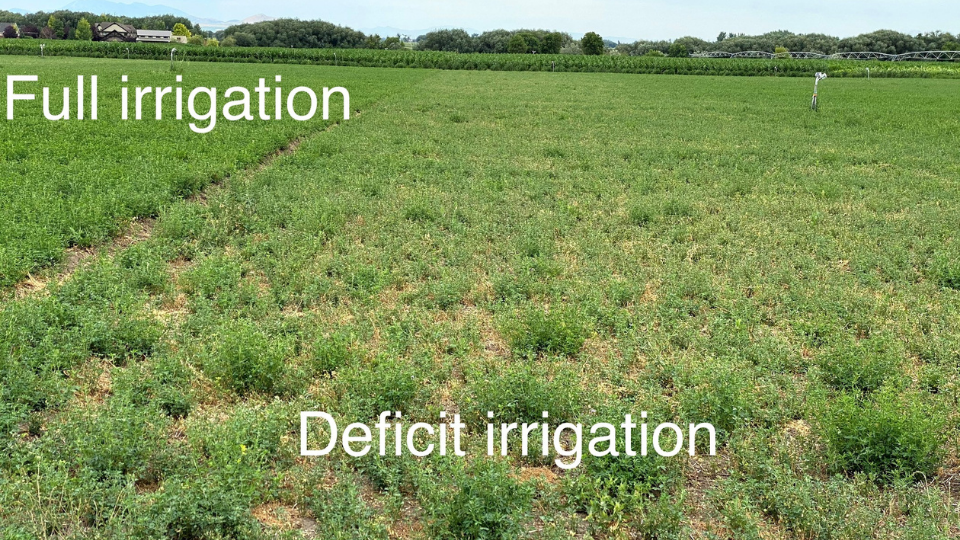
Deficit Irrigation of Pastures
Deficit irrigation is any irrigation level that does not meet the crop’s full evapotranspiration (ET) demand, meaning evaporation from plant and soil surface and transpiration through plant growth.
Drought Tolerance Guide for Alfalfa in Utah
Crop variety selection is one of the most important choices on the farm. Crop genetics determine a significant portion of the yield potential and resource use efficiency. Crop types and genetics that use water more efficiently will become increasingly imp
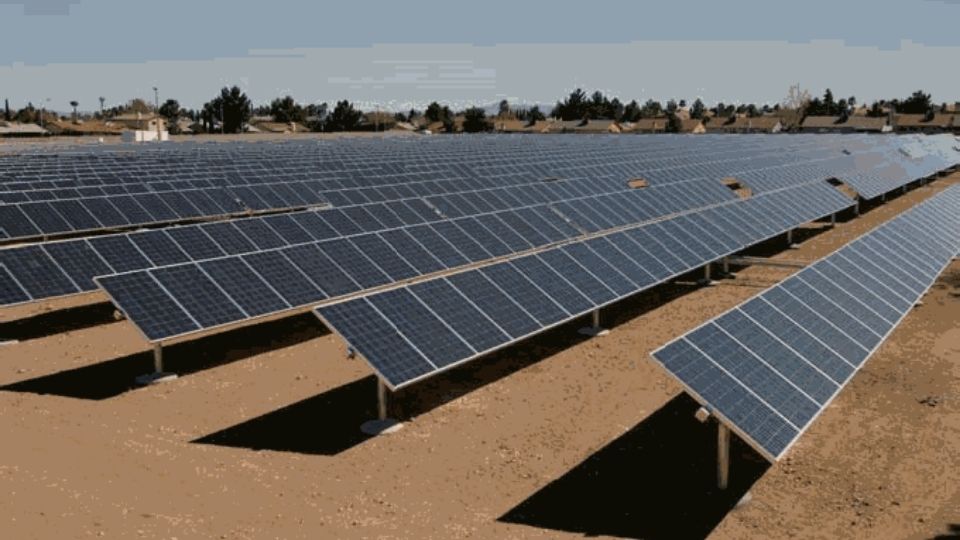
Economic Feasibility of Solar Photovoltaic Irrigation Systems
The Great Basin is primarily located in Nevada, western Utah, and small sections of southern Oregon and Idaho. The Great Basin is noted for its arid conditions and high percentage of publically owned land. The potential for solar energy generation in the
Energy Conservation with Irrigation Water Management
Irrigators in Utah experienced rapidly increasing energy costs from the mid 1970s to the late 1980s. These costs remain relatively high. Those who are pumping from deep wells are particularly interested in ways to cut back on energy use without doing away
Guide to Irrigation Sprinkler Packages for Pivots and Laterals
Guide to Irrigation Sprinkler Packages for Pivots and Laterals
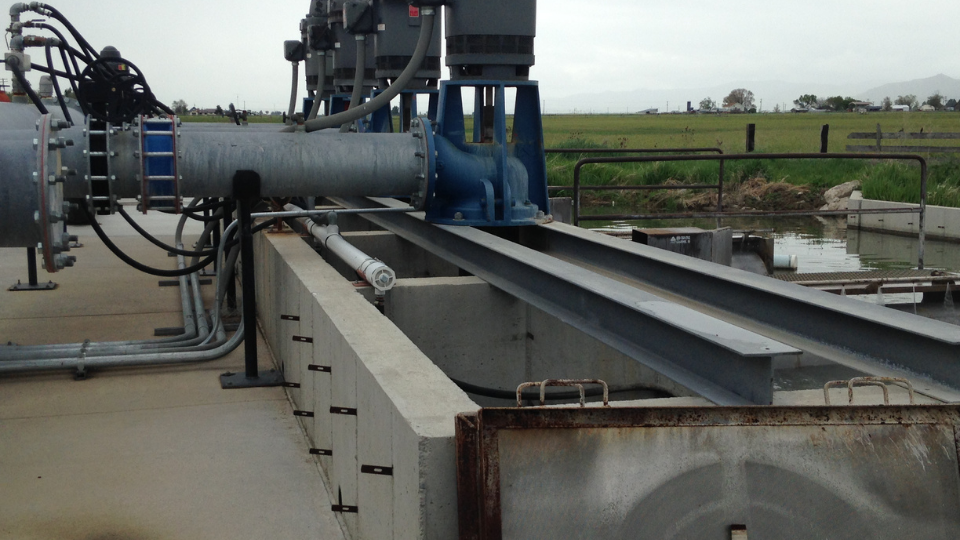
How Good is Your Water Measurement?
Accurate water measurement is essential to maintaining equity of water delivery within an irrigation company or water districts. Good management of our scarce water resource is dependent upon quantifying supplies and uses with accurate measurement techniq
Irrigation Canal Lining?
Irrigation canals placed in native soil or lined with earth can have seepage water losses varying from 20 percent to more than 50 percent. Well designed, new compacted earth lined canals can have reduced seepage losses similar to concrete lined channels.
Irrigation Water Loss and Recovery in Utah
When deciding which irrigation systems to adopt, permit, or promote, it is important to consider how their efficiency and losses affect the water balance of Utah’s watersheds and drainage basins. Irrigators have no control over precipitation and only limi
Irrigation Water Quality Sampling Guide
The suitability of a water source for irrigation depends on the water quality, and some sources may be altogether unsuitable for practical use.
Managing Saline and Sodic Soils and Irrigation Water
Salt is important in plant and soil management. Excessive salt concentrations in soil can cause water to be less available to plants because of the osmotic forces of salt in the soil water. Excessive concentrations of some salt ions can also be toxic to p
Managing Soil pH for Crop Production in Calcareous-Alkaline Soil
In semiarid soils of the Western U.S., altering soil pH is not easily accomplished nor straightforward. Recall that pH is a measure of the acidity or alkalinity of a substance. More specifically, Utah’s soil pH range can be 1,000 times more acidic or alka
Mobile Drip Irrigation for Pivots and Laterals
New technologies like MDI have the potential to improve irrigation efficiency thereby increasing water available to the crop and conserving water by reducing loss. If you are considering MDI on your farm, it will be important to carefully review its poten
Precision Irrigation Guide for Center Pivots
Precision irrigation is a process involving technology and specialized equipment to improve the efficiency and effectiveness of agriculture irrigation management. This management process is beneficial in allocating water based on spatial variability throu
Soil Sampling Guide for Crops
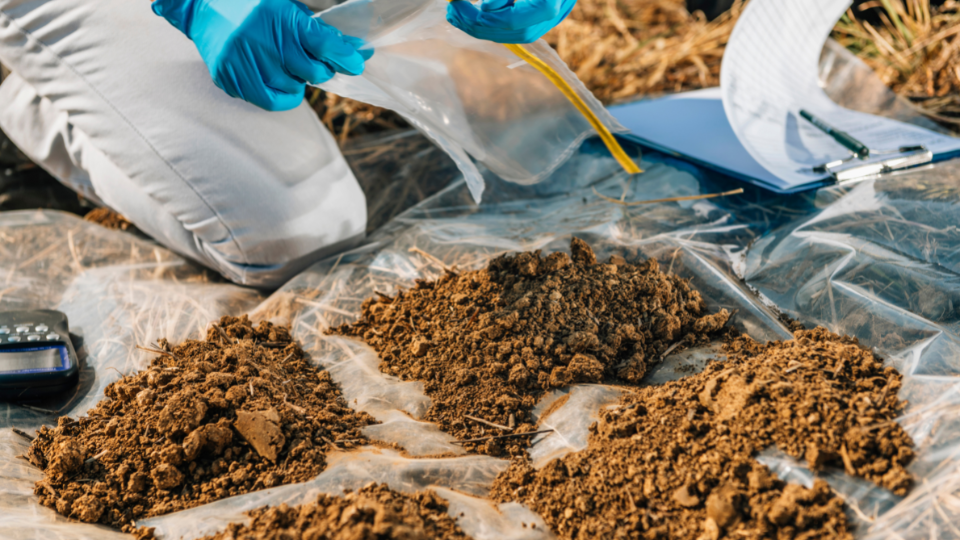
Why conduct soil sampling for crops? The answer is simple and intuitive for most involved in agriculture. Regular soil sampling, testing, and associated guidance on fertilization and soil amendments help develop and maintain more productive and healthy
Strategies for Deficit Irrigation of Forage Crops
Deficit irrigation strategies with varying effectiveness can be employed in many cases to maximize production and profit. These strategies can include modifying irrigation schedules, concentrating irrigation to critical crop growth stages, reducing rates,
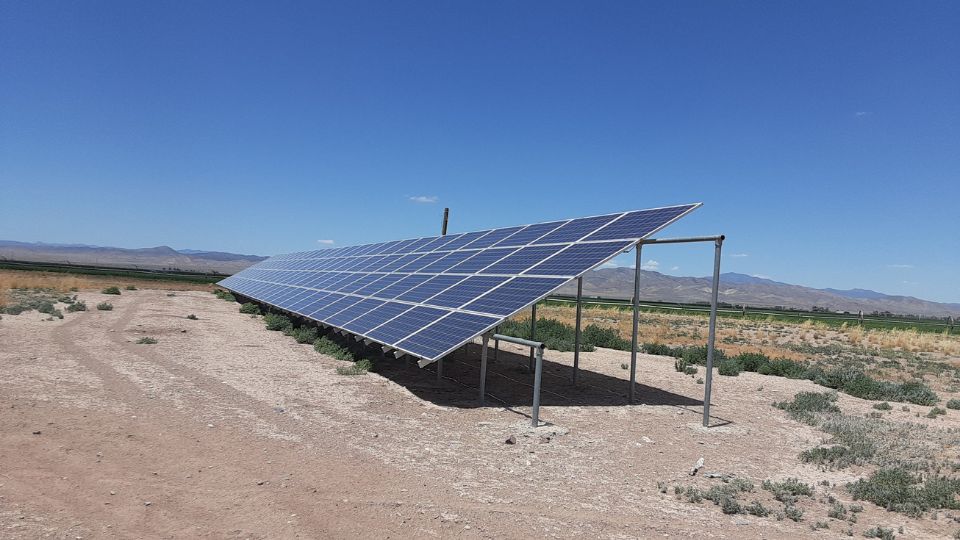
Ten Considerations for Solar-Powered Irrigation in Utah
Generating power from solar energy used to be one of the most expensive options in Utah. This scenario is changing. According to the American Council on Renewable Energy (ACORE, 2021), the cost of solar power production went down by 90% between 2009 and 2
Understanding Irrigation Water Optimization
It is important to consider the possible hydrologic impacts of irrigation optimization efforts to avoid implementing practices that have little appreciable effect relative to the desired outcome. Examples of desired outcomes include increasing supply reli

Utah Surface Irrigation Water Optimization Opportunities and Barriers
This peer-reviewed fact sheet from Utah State University Extension summarizes a statewide survey of surface irrigators, highlighting current practices, barriers, and opportunities for water optimization in Utah agriculture. It emphasizes the importance of
Variable Frequency Drives for Irrigation Pumps
A VFD can make sense in a variety of irrigation applications. Here are 6 of the major applications where one might consider a VFD (also see Henry and Stringham, 2013 and USDA-NRCS, 2010):
Water Rights in Utah
If you are connected to a municipal system, your water is probably categorized as “culinary or municipal water” and is used for everything from drinking and bathing to washing the car to watering tomatoes. However the Utah Division of Water Rights takes a
25 Rules of Thumb for Field Crops
University Extension services are widely known for scientific information on best practices for field crop production. Many Extension experts commonly offer the same tips or "rules of thumb" to growers. This article is certainly not a comprehensive list o
Irrigation Advance Sensors Are Having Large Impacts in Surface Irrigation
There are many good things about surface irrigation, but the labor requirements and large water withdrawals can diminish its feasibility in situations with limited access to labor or water. In this fact sheet, we will describe two of these systems current