2022 Costs and Returns for Non-irrigated Flax in Utah
Introduction
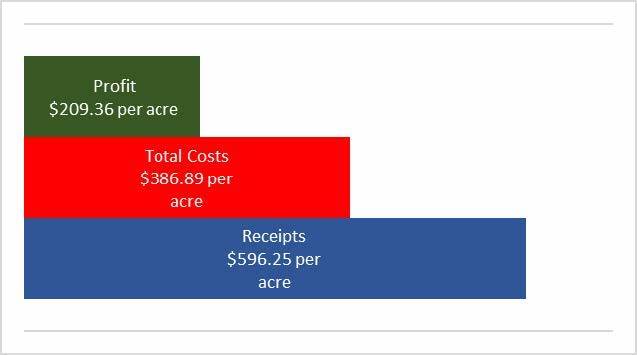
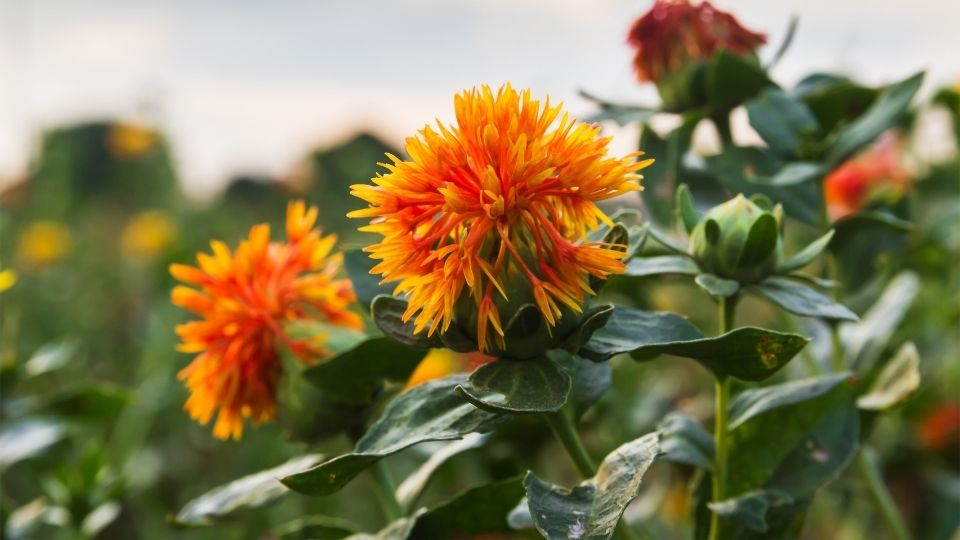
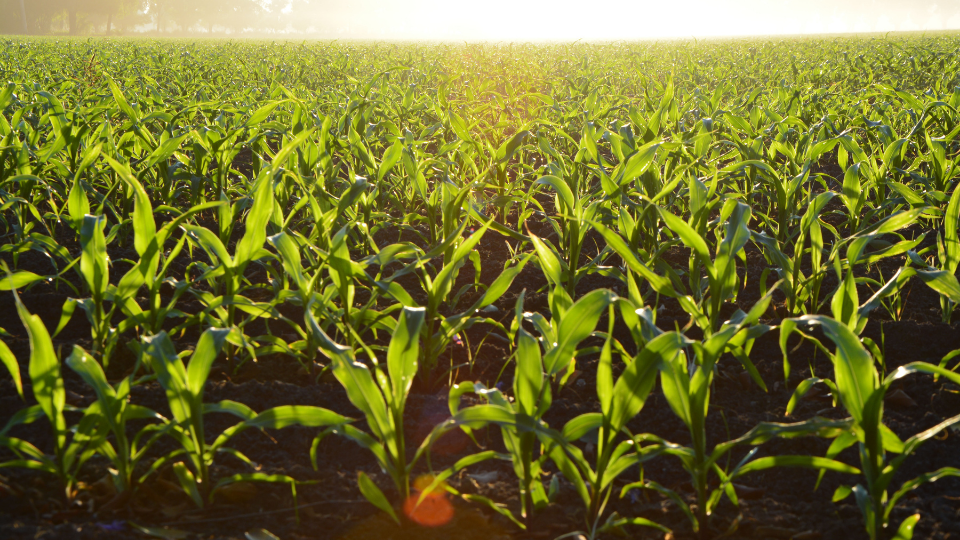
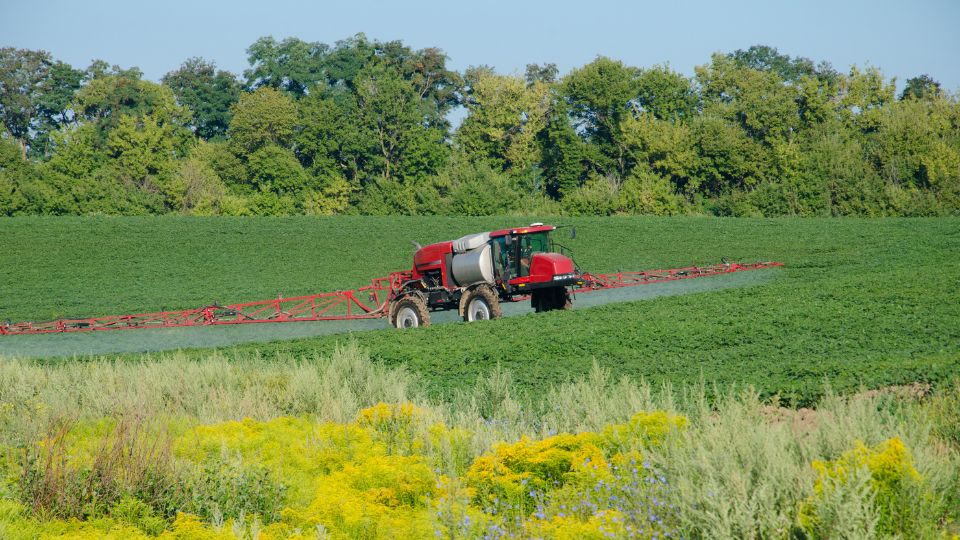
Enterprise budgets are created to help a grower to understand all the costs and returns associated with producing a crop and are usually expressed on a perunit basis, such as per acre. The budget in Table 1 (see Appendix: Budget Tables) contains sample costs and returns to establish and produce non-irrigated flax in Utah. It is intended to be a guide used to estimate income and expenses, list inputs and production practices, and provide a framework for the whole farm plan. The sample budget may list production practices, inputs, and services or field operations that the farm does not use. If this is the case, delete practices and refigure the totals. If a grower has additional field operations or inputs, add them to the budget along with their costs to get a more accurate production cost estimate for growing flax on the farm. Figure 1 shows estimated receipts, costs, and profit for raising dryland flax in Utah.
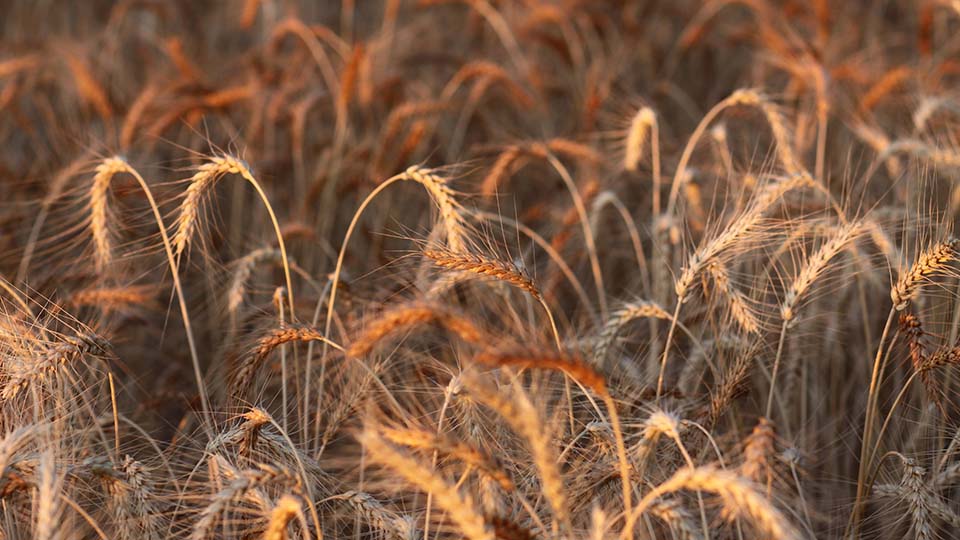
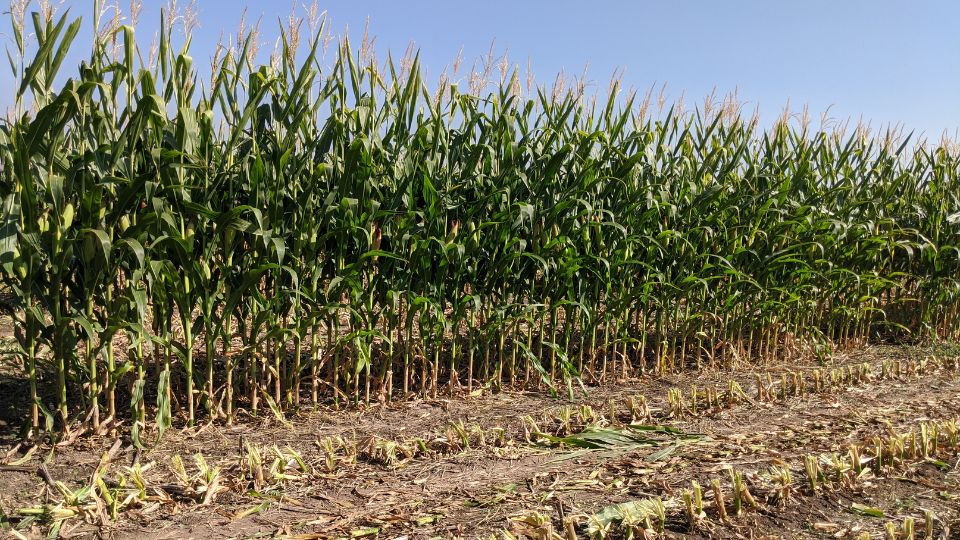
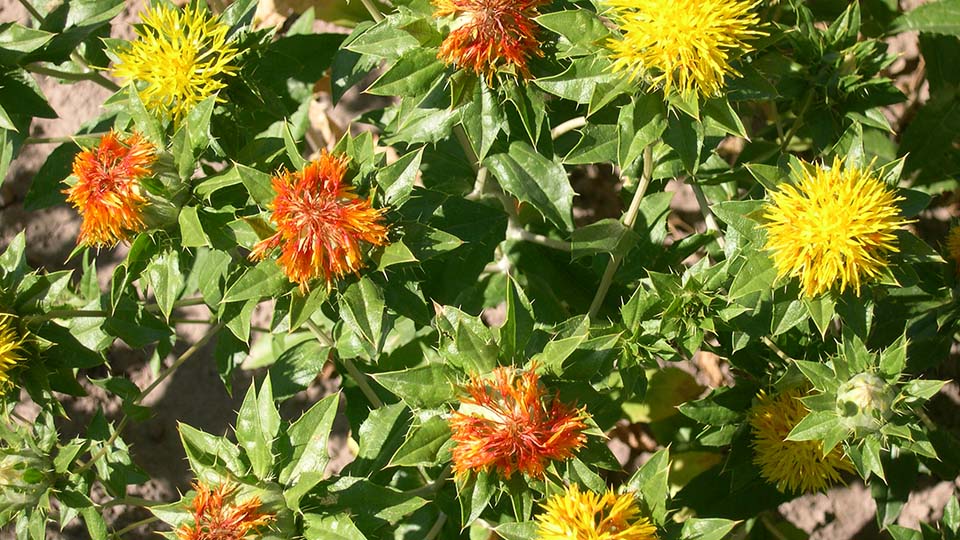
Farm. The 2017 Census of Agriculture shows the representative farm consists of 1,028 acres of farmland that is both leased and owned, on which 200 acres are cultivated for flax production, and the remaining acres consist of dryland wheat and safflower. The market value for dryland ground varies widely by area, rainfall, and soil type. In this budget, the land is valued at $1,617 per acre based on values obtained from AcreTrader (acretrader.com) and reports from the U.S. Department of Agriculture (USDA) National Agricultural Statistics Service (NASS).
Receipts. A flax production average of 1,325 pounds per acre used for the publication was determined by interviews with flax growers and crop advisors. The flax prices were determined from interviews with flax seed buyers and growers.
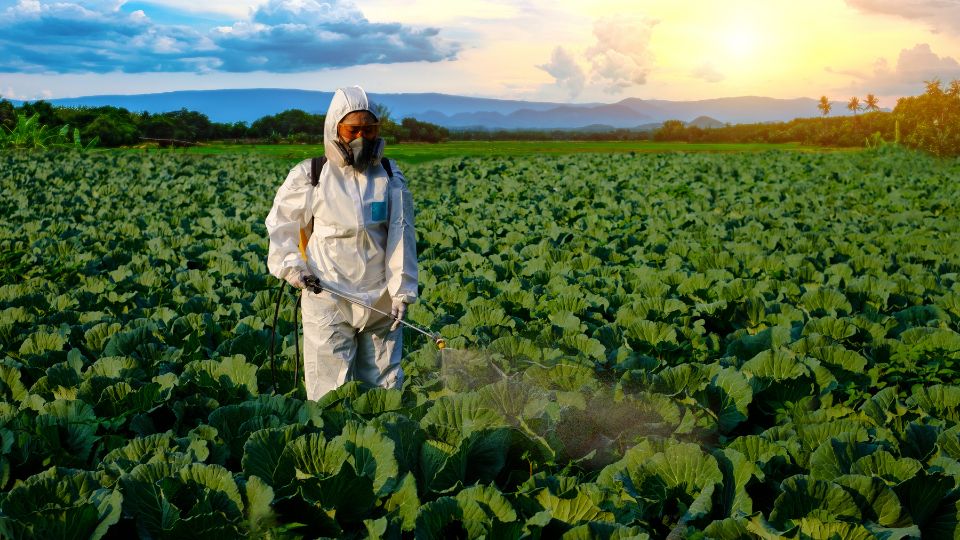
Inputs and Services. Inputs and services include crop insurance, fertilizer, pesticides, seed, and seasonal employees. Input and chemical prices are determined from interviews with seed, fertilizer, and chemical dealers.
Seasonal Employees. One seasonal employee is hired for 2,500 hours per year at a base wage plus FICA rate of $19.28/hour, including the employer’s share of payroll tax. The wage rate is calculated as 110% of the USDA’s Farm Labor Survey reported hourly wage rate for the region to account for payroll taxes and current trends (NASS, 2022). The total annual labor cost is $48,200 for the 1,028 acres, resulting in an average cost per acre of $46.89.
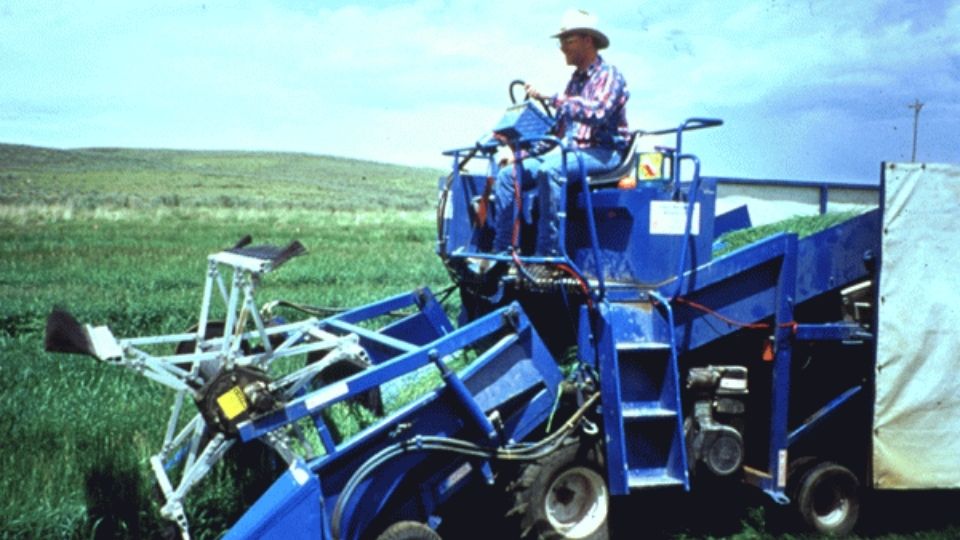
Field Operations and Operating Interest. Field operations include things like tillage, seeding, harvesting, and hauling. The practices described are considered typical for a well-managed farm in the region as determined by interviews with producers and agribusiness representatives. Costs, materials, and practices do not apply to all situations, as management and cultural practices vary among growers and regions. An interest rate of 7% is charged for 6 months on the capital needed to produce this crop.
Machinery Costs and Overhead. Machinery operation costs are determined by using average established custom rates to cover machine and equipment operating costs. These rates were obtained from the 2022 Iowa Farm Custom Rate Survey and the 2022 Nebraska Custom Farm Rates publications and conversations with local growers and chemical dealers. Cash overhead consists of various cash expenses paid out during the year. These costs include property taxes, interest on land, office expenses, liability insurance, property insurance, and accounting/legal costs.
Financial and Production Terminology
Fixed Costs (Overhead). These are costs that take place irrespective of production. Fixed costs include depreciation on equipment and buildings, property taxes, interest on land, equipment, or buildings as well as overhead, etc.
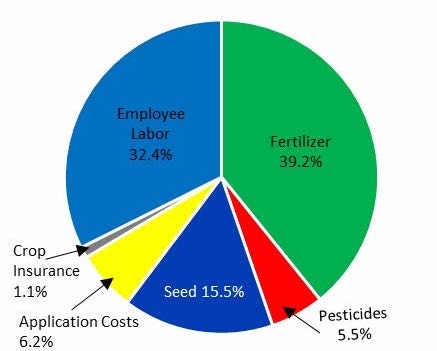
Variable Costs (Operating). Variable or operating costs are those costs that change with production. These costs include fertilizer, seed, chemicals, and other inputs which are directly associated with production. Figure 2 shows the various percentages of the budget input and services costs.
Net Income or Profit. Sometimes referred to as net profit, this is the operation’s total sales per acre minus total costs per acre (Table 2).
Net Income or Total Sales Ratio. A profitability ratio is calculated as net income per acre divided by total sales per acre. The net income or profit ratio found in Table 3 is very useful in determining profitability and is displayed as a percentage. A profit margin of 35.1% means the farm has a net income of 35.1 cents for every dollar of sales.
Contribution Margin. Table 4 represents the portion of sales revenue from the operation not consumed by variable costs and so contributes to the coverage of fixed costs and net profit.
Contribution Margin Ratio. This ratio is a percentage of total sales not consumed by variable costs. For example, a contribution margin ratio of 43.9% from Table 5 means that for each dollar increase in sales, the total contribution margin will increase by 43.9 cents.
Production or Yield Breakeven. The production breakeven or yield breakeven is the point at which total expenses and total revenue are equal, or it is the pounds per acre needed to cover the costs of the enterprise. In the example budget at the bottom of Table 1, it shows that a grower would need to produce 860 pounds of flax per acre to pay all of their expenses. They would need to produce at least 743 pounds to pay for input, services, and field operations and another 117 pounds to pay for the fixed costs, totaling 860 pounds of flax per acre. Using Table 6 and supposing they were offered a contract price of $0.41 per pound at the beginning of the growing season and estimating that their total production costs are closer to $337 per acre, they would only need to produce 822 pounds of flax per acre to break even, and the rest of the yield per acre would be profit.
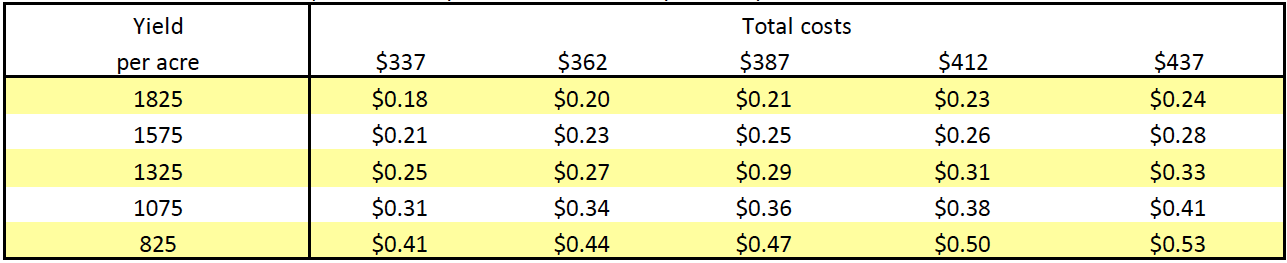
Price Breakeven. Break-even analysis is a tool used to determine the relationship between the revenue and costs associated with an enterprise. Price breakeven represents the price point that must be reached to cover the costs of the enterprise. In the example budget at the bottom of Table 1, a grower would need to sell flax for $0.29 per pound to break even and pay all the expenses. Of the 29 cents, 25 cents would pay for the operating costs, with 4 cents required to pay for the fixed costs.
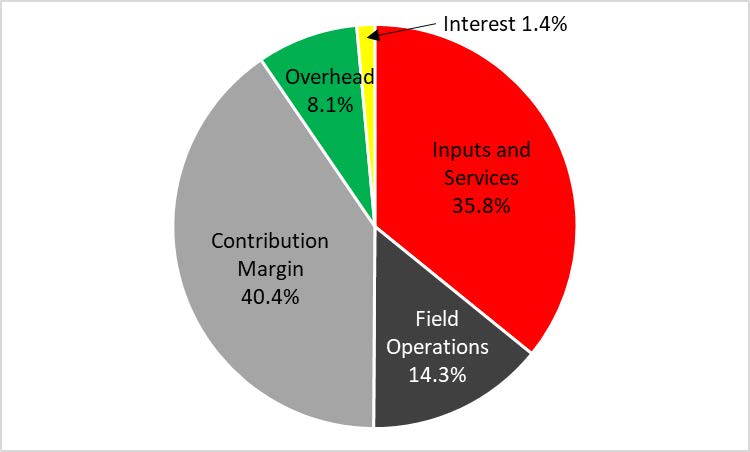
Table 7 shows different scenarios based on production yields and total costs. Assume the farm typically produces 1,325 pounds of flax per acre and the total production costs are still about $387 per acre. According to the table, a grower would need to sell flax for 29 cents a pound to break even, and anything over that would be a profit to the farm. However, if dryland or non-irrigated flax production is only about 825 pounds per acre and the total costs are still $387 per acre, then a grower would need to sell the flax for 47 cents a pound to break even. Using this same chart and assuming the total costs of production were closer to $337 per acre and the yield was 1,575 pounds, a flax seed grower would only need to sell it for 21 cents per pound to break even, and anything above 21 cents would be a profit. To use this chart properly, the grower needs to know their average flax yields and total production costs for growing flax to figure out the break-even price.
Figure 3 shows the different percentages for the inputs and services, field operations, overhead, interest, and contribution margins for growing flax on dryland ground with this budget in its present form.
Budget Tables
Table 1. 2022 Costs and Returns for Non-Irrigated Flax
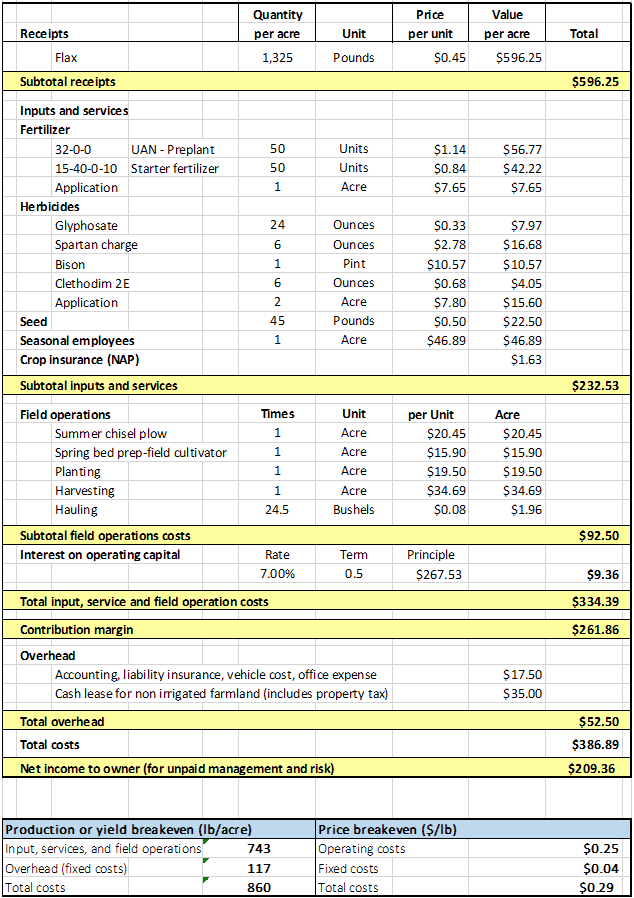
Table 2. Net Income (Total Sales per Acre/Total Costs per Acre)
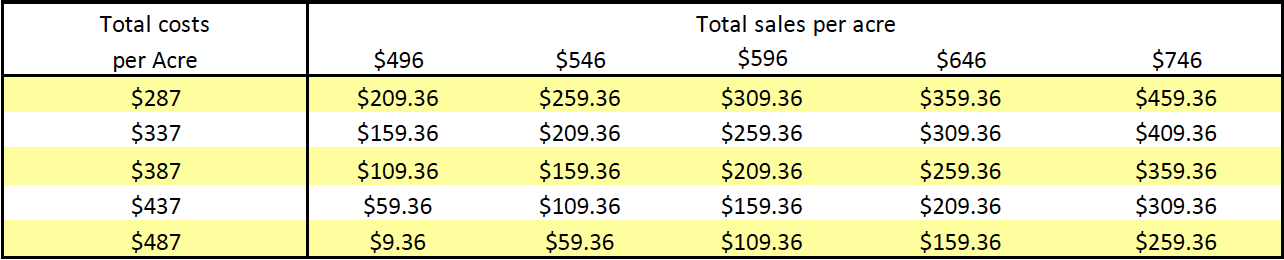
Table 3. Net Income/Total Sales Ratio (Net Income per Acre/Total Sales per Acre)
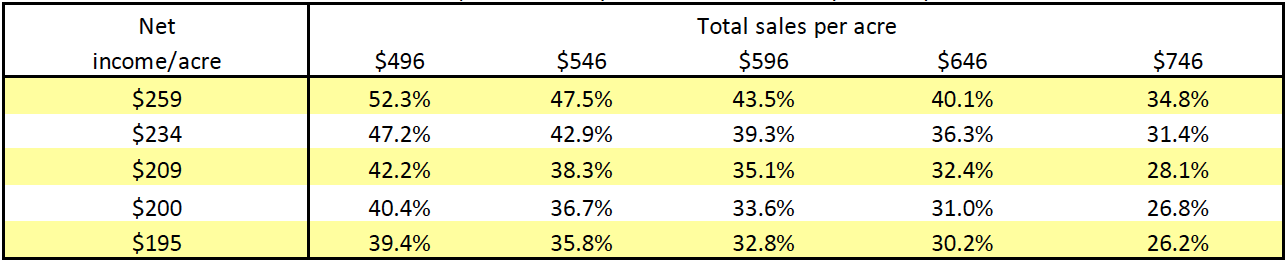
Table 4. Contributions Margin (Total Sales per Acre/Variable Costs per Acre)
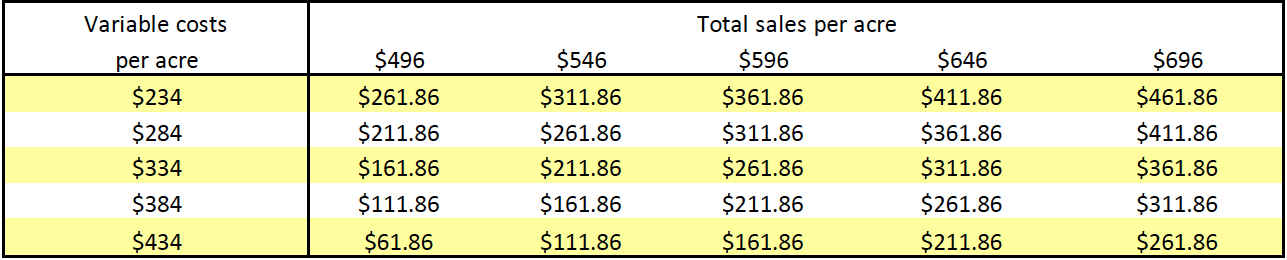
Table 5. Contribution Margin Ratio (Contribution Margin per Acre/Total Sales per Acre)
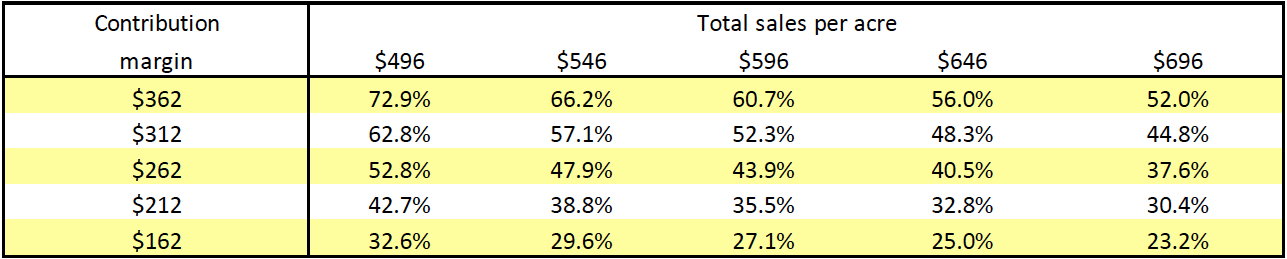
Table 6. Production or Yield Breakeven (Total Costs per Acre/Flax Price per lb)
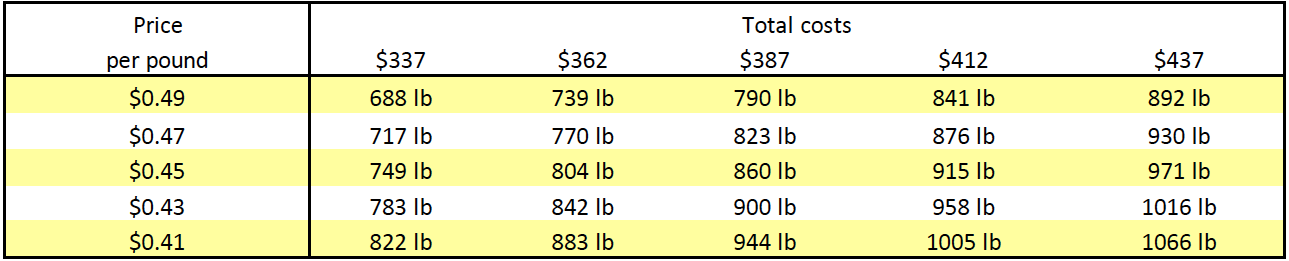
Table 7. Price Breakeven (Total Costs per Acre/Flax Yield per Acre)
References
- AcreTrader (n.d.). Utah agriculture overview. Acretrader.com https://acretrader.com/resources/utah-farmlandprices?type=non-irrigated&period=5
- Census of Agriculture. (2017). Box Elder County Utah. National Agriculture Statistics Service, U.S. Department of Agriculture. https://www.nass.usda.gov/Publications/AgCensus/2017/Online_Resources/County_Profiles/Utah/cp49003.pdf
- McClure, G. A., & Jansen, J. A. (2022). 2022 Nebraska custom farm rates [EC823]. University of Nebraska- Lincoln Extension. https://extensionpublications.unl.edu/assets/pdf/ec823.pdf
- National Agricultural Statistics Service (NASS). (2021). Land values 2021 summary (August 2021) [ISSN: 1949-1867]. U.S. Department of Agriculture. https://www.nass.usda.gov/Publications/Todays_Reports/reports/land0821.pdf
- NASS. (2022). Farm labor [ISSN: 1949-0909]. U.S. Department of Agriculture. https://downloads.usda.library.cornell.edu/usdaesmis/files/x920fw89s/mp48tj815/0c484p887/fmla0522.pdf
- Plastina, A., Johanns, A., Gleisner, A., & Qualman, A. (2022). 2022 Iowa farm custom rate survey [File A3- 10]. Ag Decision Maker, Iowa State University Extension and Outreach. https://www.extension.iastate.edu/agdm/crops/pdf/a3-10.pdf
Published February 2023
Utah State University Extension
Peer-reviewed fact sheet
Authors
Michael Pace, Jacob Hadfield, and Ryan Feuz
Related Research
2015 Costs and Returns for Flood Irrigated Alfalfa, Box Elder County
Enterprise budgets are the building blocks of a farm or ranch. They represent estimates of income and expenses for a specific period of time using a set of production practices and inputs for that enterprise.

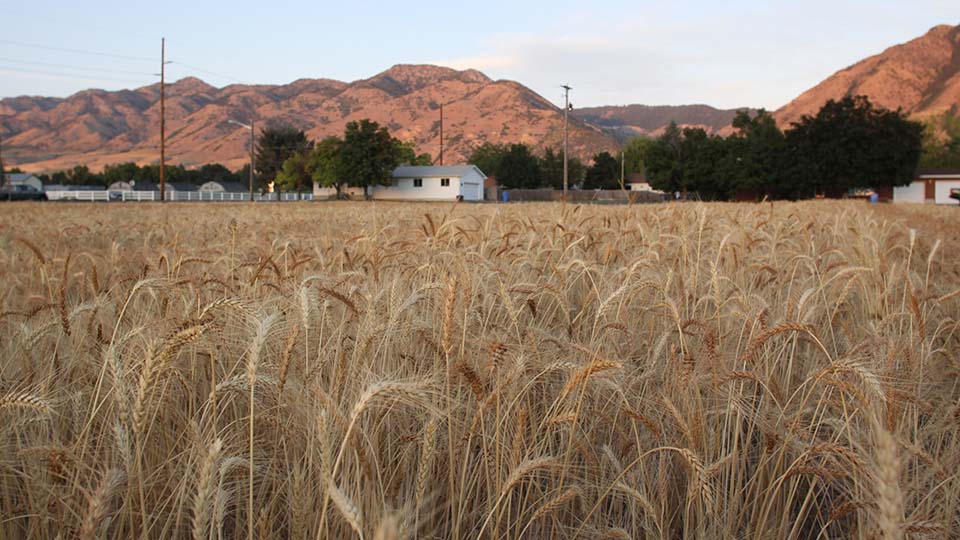
2015 Costs and Returns for Irrigated Soft White Wheat, Box Elder County
Enterprise budgets are the building blocks of a farm or ranch. They represent estimates of income and expenses for a specific period of time using a set of production practices and inputs for that enterprise.
2019 Costs and Returns for Irrigated Safflower, Northern Utah
Enterprise budgets are the building blocks of a farm or ranch. They represent estimates of income and expenses for a specific period of time using a set of production practices and inputs for that enterprise. This research contains sample costs and return
2022 Costs and Returns for Non-irrigated Flax in Utah
Enterprise budgets are created to help a grower to understand all the costs and returns associated with producing a crop and are usually expressed on a per-unit basis, such as per acre.
4R’s of Irrigation Management
The research community and fertilizer industry have developed and utilized a framework termed “4R nutrient management” to help improve fertilizer stewardship. For decades, national and international organizations and institutes such as The Fertilizer Inst

50 Common Questions About Field Crops
Utah State University (USU) Extension strives to provide research-based information and knowledge to help agricultural producers. Producers often have questions about several aspects of field crop production. This article is not comprehensive of all ques
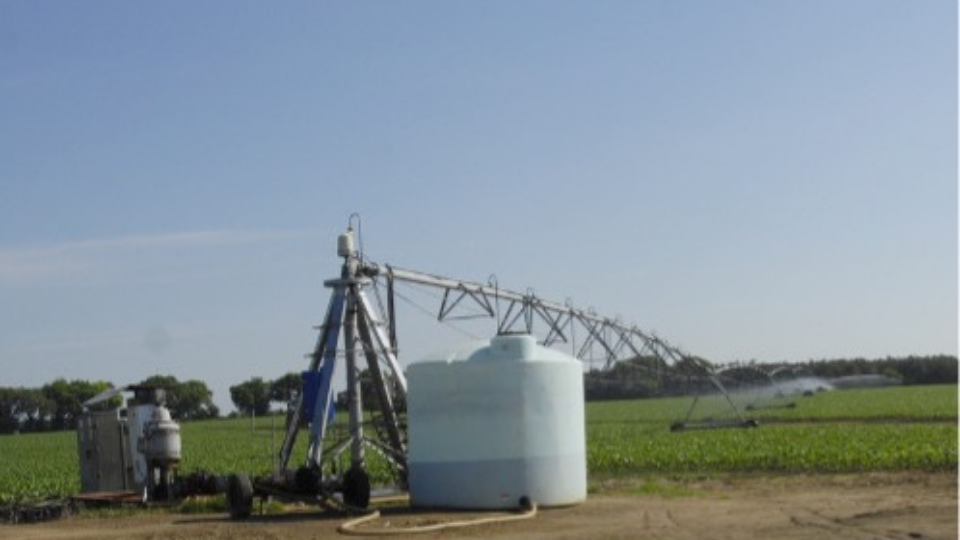
Accurate Irrigation Water Flow Measurement in Pipes
Accurate flow measurement is important to irrigation water management and water rights accounting and protection. Accurate flow measurement is essential in ensuring equitable water distribution to water rights holders and shareholders within irrigation co
Adopting Organic Wheat: Grower Motivations and Concerns
A recent study of wheat producers in the western United States found that wheat growers were actually transitioning out of organic production due to concerns about pest control and profitability. This fact sheet provides an overview of the study results b
Agricultural Irrigated Land and Irrigation Water Use in Utah
This article is a summary of several estimates of the extent of agricultural irrigation in Utah and some associated trends.

Agricultural Producers’ Motivations and Challenges With Improving Soil Health in Utah
This study examines Utah agricultural producers' motivations and challenges in adopting soil health practices. It highlights the lack of localized resources and transferable knowledge as barriers, while emphasizing producers' desire to gain insights, enha

Agriculture Water Use and Economic Value in the Great Salt Lake Basin
This fact sheet provides information about the following topics in the context of the Great Salt Lake and its basin: Great Salt Lake facts, Human effects on the size of the lake, Changes to population and land use, Agricultural water use, Agriculture and

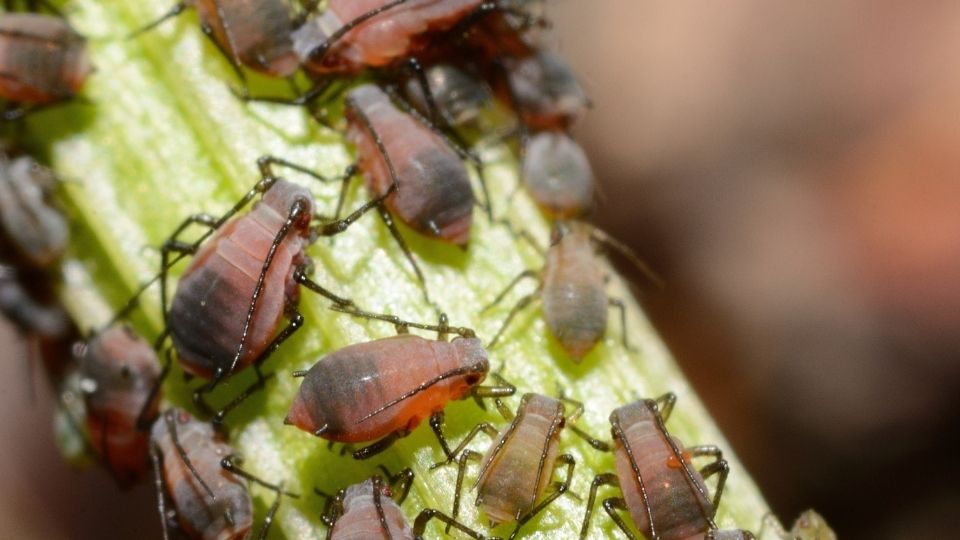
Aphids in Alfalfa
Aphids belong in the order Hemiptera and family Aphididae. Aphids are common insects in field and forage crops, with at least six kinds in Utah alfalfa. Aphids can be distinguished from other insects in alfalfa with a hand lens. In general, aphids are sof
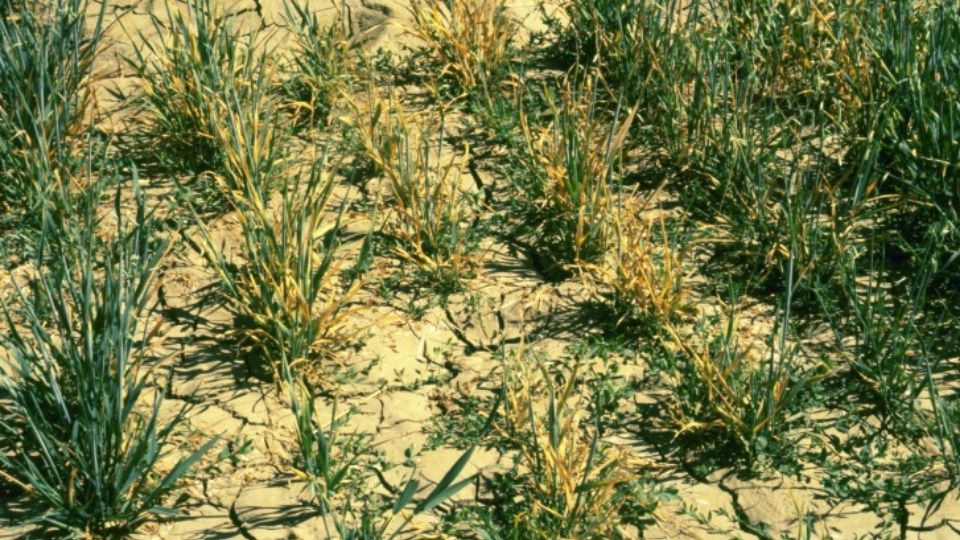
Barley yellow dwarf virus (BYDV)
Barley yellow dwarf virus (BYDV) is found worldwide. It infects small grains like barley, wheat, oats and rice as well as many wild grass species. There are two strains of the barley yellow dwarf virus: BYDV-MAV and BYDV-PAV.
Boom Sprayer Calibration for Pesticide Applications
To protect your investment in agricultural pesticides, a boom sprayer should be calibrated at the start of the season and whenever application conditions change. Also, sprayer output should be periodically checked throughout the season to assure proper ap
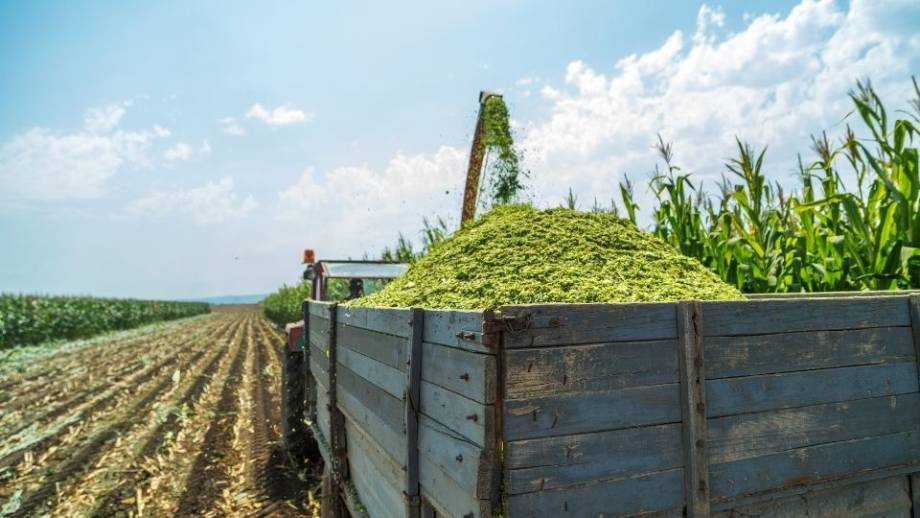
Buying and Selling Corn Silage or Other High Moisture Feeds: Value the Feed not the Water
Alfalfa is the most important crop in Utah, both in terms of acreage and revenue. Although often overlooked, one of the most critical decisions made in alfalfa production is determining which variety to plant. This report summarizes dry matter (DM) yields
Characteristics of Organic Wheat Growers
A recent study was conducted with wheat growers in the western U.S. which found notable differences in the grower and farm characteristics that influence organic adoption, including older age and the lack of importance of gender and farming experience. Th
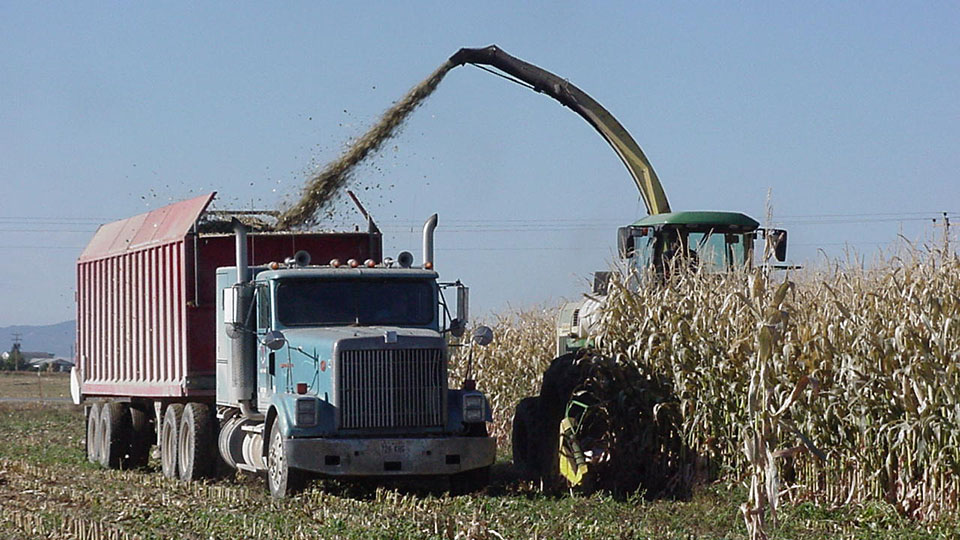
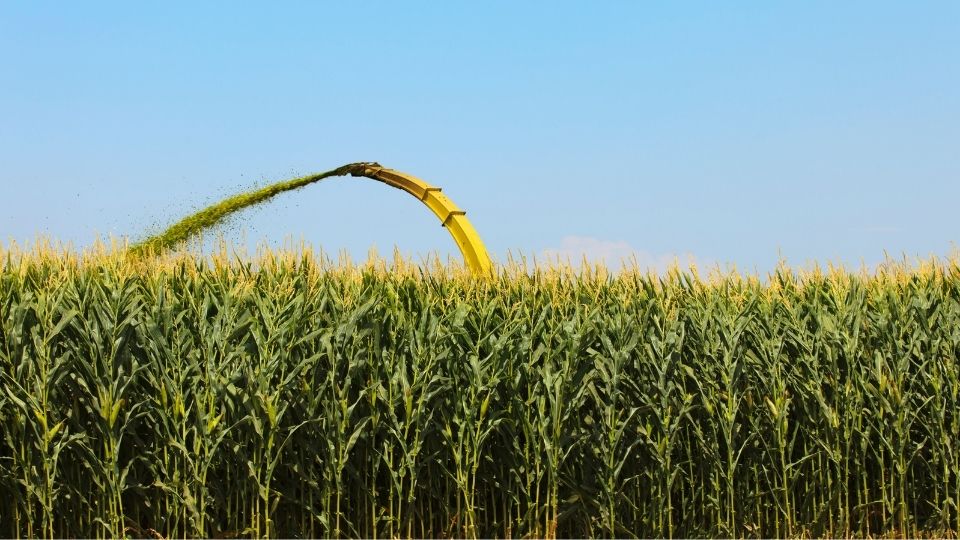
Chopping and Storing Quality Corn Silage
Properly harvested and stored, corn silage is extremely palatable, superior to other forages in energy content, a great fiber source, and relatively consistent in quality. The high palatability of corn silage encourages feed intake which contributes to hi

Comparison of Three Traps Used for Pocket Gopher Management (Thomomys Bottae) in Alfalfa Fields
Valley pocket gophers (Thomomys bottae) are a common agricultural pest in many areas of Utah, Nevada and California. Pocket gophers predominantly eat roots, although they will pull vegetation into their burrows, and eat plants immediately adjacent to thei
Considerations for Crop Rotation from Alfalfa to Corn
The importance of rotating out of a declining alfalfa stand is well established. As the alfalfa stand ages, forage yield and quality decline, while weed, insect, and disease pressures increase.
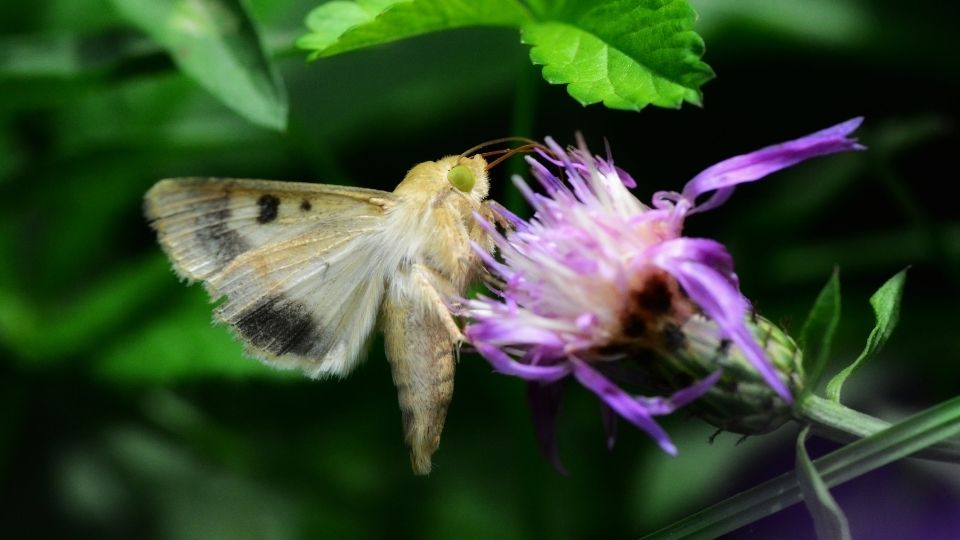
Corn Earworm
In Utah, there are typically three generations of corn earworm (CEW) each year. The first generation of adults either come from overwintering pupae (southern and central Utah) or migrate into northern Utah. The adult moth is tannish brown with a 1 1/2 inc
Corn Silage Variety Performance
This report summarizes on-farm performance of irrigated silage corn hybrids at Benson (Cache County) in 2006. The site is at 4439 ft elevation and has a long-term average of 2800 corn growing degree days (50/86° F) per year. Hybrids were seeded with a six
Costs and Returns for Non-Irrigated Safflower
Enterprise budgets are the building blocks of a farm or ranch. They represent estimates of income and expenses for a specific period of time using a set of production practices and inputs for that enterprise. Tables in this research is intended to be a gu

Costs and Returns for Roundup Ready™ Grain Corn
Enterprise budgets are the building blocks of a farm or ranch. They represent estimates of income and expenses for a specific period of time using a set of production practices and inputs for that enterprise. This research contains sample costs and return

Costs and Returns for Roundup Ready™ Silage Corn
Enterprise budgets are the building blocks of a farm or ranch. They represent estimates of income and expenses for a specific period of time using a set of production practices and inputs for that enterprise. This research contains sample costs and return
County-Level View of Irrigation Trends in Utah and the West
As water demand and scarcity increase simultaneously over the coming decades, water managers and growers will need to optimize water use on their irrigated lands. These challenges have been especially noticeable as the Western U.S.faces a prolonged “megad
Cover Crops for Utah
The purpose of this fact sheet is to provide the current state of knowledge on cover crop management for Utah based on USU research and local grower experience.

Crop Advisor Approaches to Soil Health Advising and Opportunities for Improvement
The report highlights that crop advisors in Utah and Idaho are increasingly addressing soil health, though barriers like cost, lack of localized information, and disagreements about soil health practices persist. Advisors from the NRCS are the most active

Crop Revenue Coverage 2007 Commodity Insurance Fact Sheet
Crop Revenue Coverage(CRC), provides revenue protection against a yield loss, a price decline, or a combination of both. CRC is available for these crop and counties Beaver, Box Elder, Cache, Carbon, Davis, Duchesne, Emery, Garfield, Iron, Juab, Millard,
Defense Against Drought
Utah’s climate can often be harsh and unpredictable. As the nation’s second driest state, Utah is commonly subject to droughts. Extensive statewide droughts have often lasted 5 to 6 years. It is imperative that farmers are well prepared to defend against
Deficit Irrigation of Pastures
Deficit irrigation is any irrigation level that does not meet the crop’s full evapotranspiration (ET) demand, meaning evaporation from plant and soil surface and transpiration through plant growth.
Diagnostic Testing for Nitrogen Soil Fertility
Environmental concerns over nitrate contamination of ground water, and the desire of land managers to increase the efficiency of their fertilizer investment, can both be satisfied more completely through diagnostic testing for nitrogen (N) soil fertility.
Downy Mildew of Alfalfa
Downy mildew is an obligate parasite. Even though they look like fungi they are not. They belong to the Oomycota and are more closely related to algae than true fungi. The most common alfalfa downy mildew species in the USA is Peronospora trifoliorum. In
Drought Tolerance Guide for Alfalfa in Utah
Crop variety selection is one of the most important choices on the farm. Crop genetics determine a significant portion of the yield potential and resource use efficiency. Crop types and genetics that use water more efficiently will become increasingly imp
Drought Tolerance Guide for Corn in Utah
Crop variety selection is one of the most important choices on the farm. Crop genetics determine a significant portion of the yield potential and resource use efficiency. Crop types and genetics that use water more efficiently will become increasingly imp
Drought Tolerance Guide for Small Grains in Utah
Crop variety selection is one of the most important choices on the farm. Crop genetics determine a significant portion of the yield potential and resource use efficiency.
Dwarf Bunt in Winter Wheat
The disease first appeared in Utah in the early 1930s in Cache County near the city of Paradise. The disease was soon found in Box Elder County near Hansel Valley. The outbreak of dwarf bunt became so severe that it affected other crops, such as barley.
Easy Calibration for Backpack and Canister (Handheld) Sprayers
If sprayers are not properly calibrated, it can result in over or under-application of chemicals, causing damage, reduced pest control, and potential safety concerns. Making the effort to properly mix chemicals and calibrate sprayers can save money and in
Easy Calibration for Boom Sprayers
Making the effort to properly mix chemicals and calibrate sprayers can save money and headaches in the long run. This fact sheet provides simple guidelines for calibrating boom sprayers.
Economic Feasibility of Solar Photovoltaic Irrigation Systems
The Great Basin is primarily located in Nevada, western Utah, and small sections of southern Oregon and Idaho. The Great Basin is noted for its arid conditions and high percentage of publically owned land. The potential for solar energy generation in the
Energy Conservation with Irrigation Water Management
Irrigators in Utah experienced rapidly increasing energy costs from the mid 1970s to the late 1980s. These costs remain relatively high. Those who are pumping from deep wells are particularly interested in ways to cut back on energy use without doing away

Evapotranspiration and Precipitation Data for Calculating Irrigation Water Requirements in Utah
In this fact sheet, we calculated average reference evapotranspiration and precipitation data for multiple locations in Utah, USA. To accomplish this, we collected the data from the Utah Climate Center and compiled it to show an average of 20 years of dat
Fertigation Facts
The purpose of this fact sheet is to provide general information on forms of fertigation for primary plant nutrient, fertigation timing, and fertigation economics.
Grass Pasture Response to Water and Nitrogen
The objective of this project is to study the response of pasture grass varieties to weather, irrigation, and fertility in a field experimental plot at a high elevation. The water variable is accomplished with a line source sprinkler irrigation system. Tw
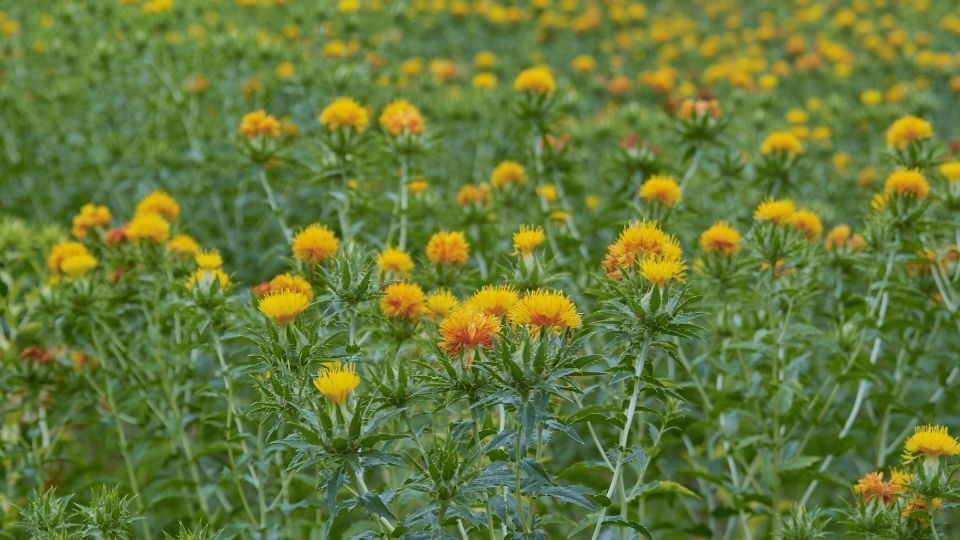
Growing Safflower in Utah
Northern Utah growers produced approximately 23 million pounds of safflower second only to California in U.S. production.
Guide to Irrigation Sprinkler Packages for Pivots and Laterals
Guide to Irrigation Sprinkler Packages for Pivots and Laterals
Guide to Pivot Track Management
Center pivot irrigation systems are the most popular form of irrigation in the western United States. A significant problem with center pivots is wheel track rutting. Deep wheel tracks can cause overirrigation because the pivot moves slower than intended
How Good is Your Water Measurement?
Accurate water measurement is essential to maintaining equity of water delivery within an irrigation company or water districts. Good management of our scarce water resource is dependent upon quantifying supplies and uses with accurate measurement techniq