On-Farm Research Guide
Introduction
On-farm research is the application of proven research methods to an actual farm or ranch (Chaney et al., 2017). It is a way growers can increase crop productivity and profitability by discovering answers to important questions about the benefits of using unproven products or practices. Validating the efficacy of already implemented practices is another important reason to do on-farm research trials (Nielsen, 2008). Each farm is unique and can benefit from individualized on-farm research. Since university and industry researchers cannot study every product or practice for every unique field or farm growing condition, on-farm trials can fill in these unknowns. This how-to guide will cover benefits and best practices for conducting successful on-farm research.
Why is on-farm research useful?
Conducting on-farm research provides growers with an opportunity to discover answers to questions, validate previously implemented practices or products being used, and prove their profitability. It tailors research to specific operations, manages risk by testing products or practices on a small scale before widespread implementation, improves experience with new technology, and helps provide unbiased data for the benefit of others (Thompson & Glewen, 2017).
The grower manages effective on-farm research and may receive additional help from professionals such as extension agents, industry researchers, and agronomists. It is conducted on a small part of the farm but utilizes plots large enough so that treatments may be established and harvested with regular farm equipment to make the experiment practical and easier to conduct.
What is the scientific method, and how can it be used?
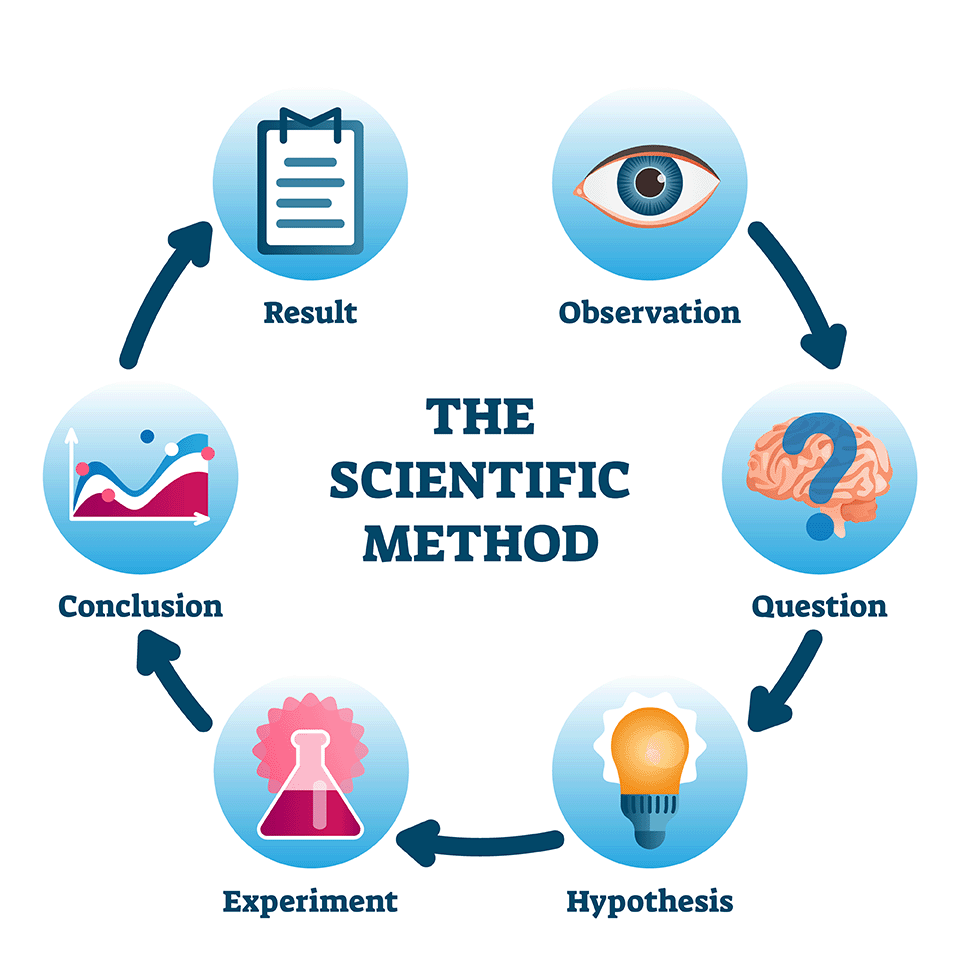
Figure 1. The scientific method.
Image source: VectorMine, vectormine.com
Research should be conducted using the scientific method (Figure 1), which is quite simple and has six basic steps:
- Make observations.
- Ask a question.
- Determine a hypothesis (educated expectation of results).
- Develop and conduct an experiment using standardized research methods to take measurements to test the question.
- Make conclusions from the measurements (data).
- Report results.
The same scientific processes taught and used in elementary school science fair projects to establish credible facts is used by university or industry scientists worldwide to study and answer even the most mysterious and complex observations and questions. The timeline of the scientific method can be very short or last for many years depending on the complexity of the question, availability of technology to study it, and our collective understanding of the answer.
How do I sift through existing research?
To use time and resources most effectively, those conducting on-farm research trials should become familiar with what independent and commercial research is already available. Many excellent trials have been conducted and reported. Reviewing existing research can help you learn what has been done and allows for more efficient and effective research. The internet provides easy access to information in libraries and server databases worldwide. Searching through vast amounts of information can be daunting. When reviewing existing research posted on websites, videos, social media, etc., it is essential to establish the work’s credibility before spending money on the product or practice.
Research-based results from many land grant research institutions across the country, like Utah State University, can generally be trusted. Many
well-recognized national or global agricultural companies also conduct creditable, trustworthy research using the scientific method. The purpose of land grant universities or independent research companies is to provide independent, unbiased, research-based information without trying to sell or profit from a financial transaction. Businesses selling products or services need to make money to stay in business. University research is not inherently trustworthy, nor is commercially sponsored research inherently untrustworthy. If research information or claims about a product or practice are not backed up by credible research, and if testimonials and marketing claims sound too good to be true, they probably are and should be ignored.
Growers, crop advisors, and others sifting through research, marketing, or promotional information should consider the following questions as the basis for making good decisions.
- Is the research conducted or promoted by independent or commercial interests?
- Did reputable scientists conduct the research?
- Did the researchers follow accepted, standardized, replicated methods?
- Did the researchers explain how (methods) the research was conducted?
- Was the research replicated or repeated in time and location?
- Is the research repeatable?
- Did other researchers get the same result using the same standardized methods?
- Is it peer-reviewed research formally reviewed by other scientists)?
- Were results published by an established reputable institution, journal, or company?
- Is the research information readily available?
Repeatability of the experiment is perhaps the most important consideration when reviewing existing research. Conducting the experiment multiple times can eliminate human errors and variability errors. When trials are repeated, and data aggregated, the result is a reliable assessment of the results (Davis et al., 2017). In agriculture, this usually means that products or practices have been evaluated in at least three different growing conditions. This could be three years at one field or one year at three different fields or geographic locations. This is the minimum, and more is obviously much better. If results were highly consistent over locations or time, researchers and growers can be confident that results are credible. If results varied widely in the three or more growing conditions, and if the variability cannot be explained, then the information should be interpreted with caution.
Research Search Tips
When searching for credible information from universities and other independent educational institutions, look for the .edu in the domain name. Examples include https://extension.usu.edu for Utah State University Extension or https://extension.purdue.edu for Purdue University Extension. Commercial companies have .com in their domain name. Do not risk catching a computer virus by clicking on unsecured links that lack https:// in their link or have obscure company .com names.
How do I develop and select treatments?
The “treatment” is the practice, product, crop, or question being tested. When determining which treatment to test, eliminate those that lack sound scientific credibility and viability due to challenges such as poor company reputation, a lack of quality ingredients, unknown and unproven ingredients, unreasonable financial requirements, and illogical or noncredible claims. Instead, focus efforts on viable products and practices that will help to meet the operation’s goals.
When planning and setting up a research trial, it is essential to eliminate as much variability in the experiment plot area as possible except for that which is being studied. For example, if studying a crop response to a rate of a specific fertilizer, it is critical that the area in the research plot have everything else uniform. This includes such things as treatment size, soil type, irrigation rate, crop stand density, application date, pest control, harvest method and date, etc. The only thing that should be varied is what is being tested. In this example it would be the rate of fertilizer. If it is an irrigation trial only, the irrigation rate or timing should be varied. If it is crop varieties being tested, only the varieties of the crop should vary.
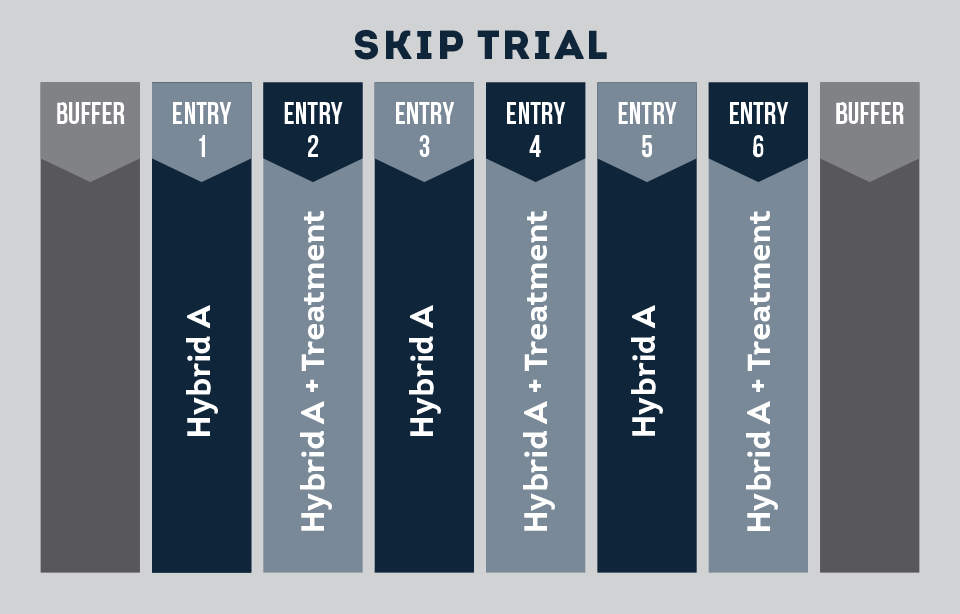
Figure 2. Simple replicated strip trial design with only a few treatments is usually best.
Remember to avoid excessive stress, which may lead to errors or trial abandonment, by planning trials of an appropriate size and complexity. Usually, two treatments (inputs or practices) with no more than 6–8 total plots or strips (areas of land) are sufficient (see Figure 2 for an example). Be sure to include a “control” treatment utilizing the operation’s standard practices; the control is the standard practice against which you want to compare. When testing for optimal input rates such as seed or chemicals, include a range of treatment levels. For example, if you are trying to determine the optimal planting depth or rate of fertilizer, you will need at least three treatments to find the low, medium, and upper end of the optimal amount.
How do I design a trial?
The most important considerations for designing on-farm research trials include establishing a control, location and dimensions, repeatability and replication, and measurements.
1. Establish a control or standard.
The first step to designing research trials is to establish a “control” that will act as your standard to compare your new practice or product against. This is critical to proper on-farm research. If a whole field is treated with new practices or products without an untreated and replicated control, there will be little to no power in detecting what differences were caused by the treatment vs. other factors such as weather or management variables.
2. Determine location and dimensions.
A key principle of your research is to focus on feasibility. If it becomes too large or complex to manage or collect yield or other measurements, then the effort to conduct the research is wasted. It is also important to consider access to the plot area and ease of harvest when determining where the trial should be located in a field.
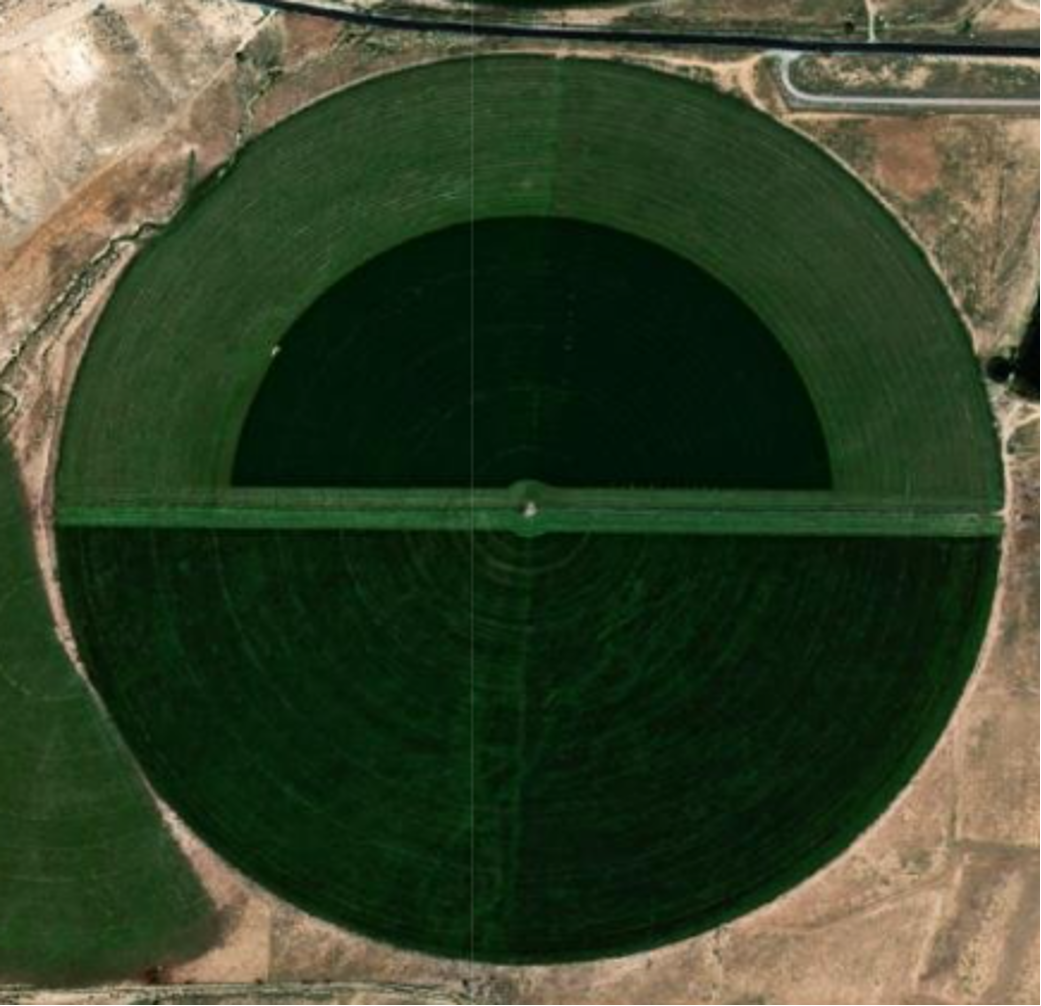
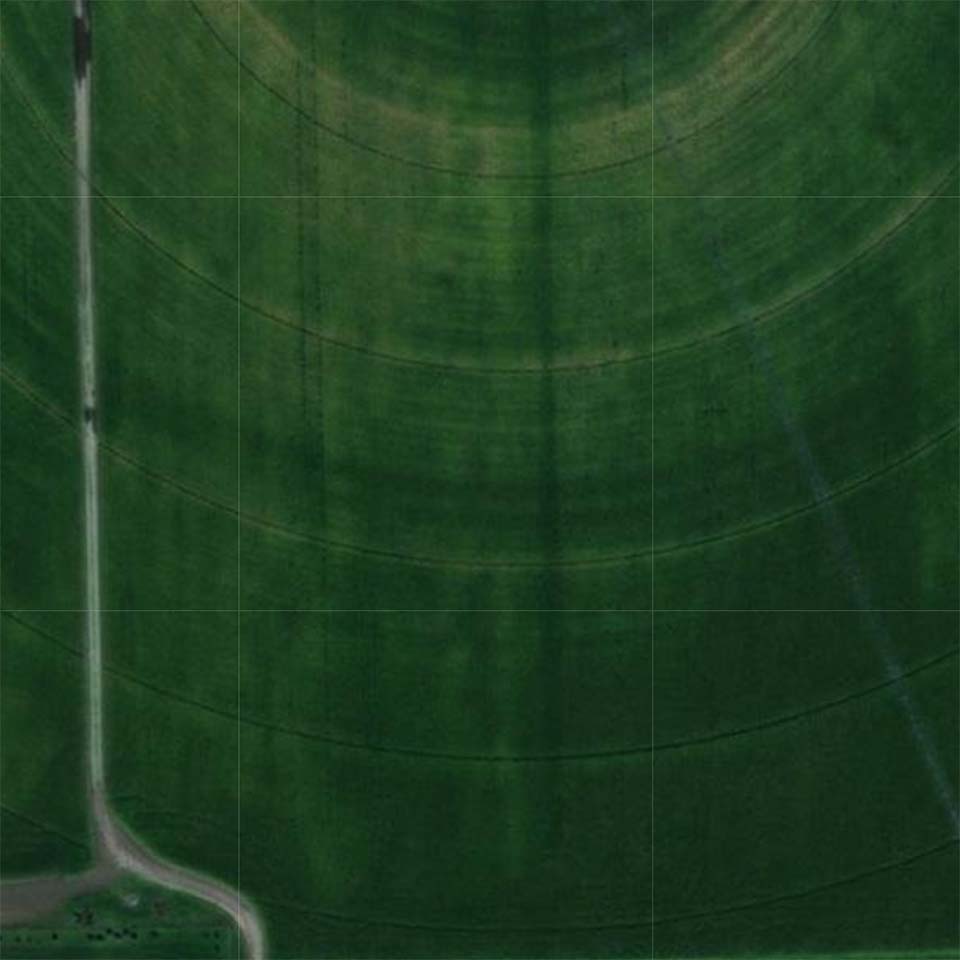
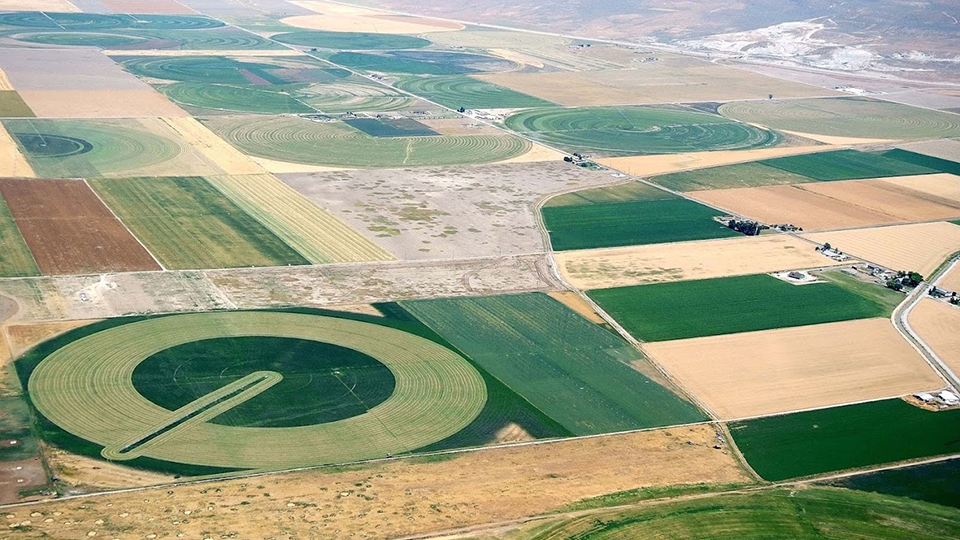
Figure 4. This field is relatively uniform within the outer pivot towers and provides areas where trials could be established with consistent irrigation and plant growth.
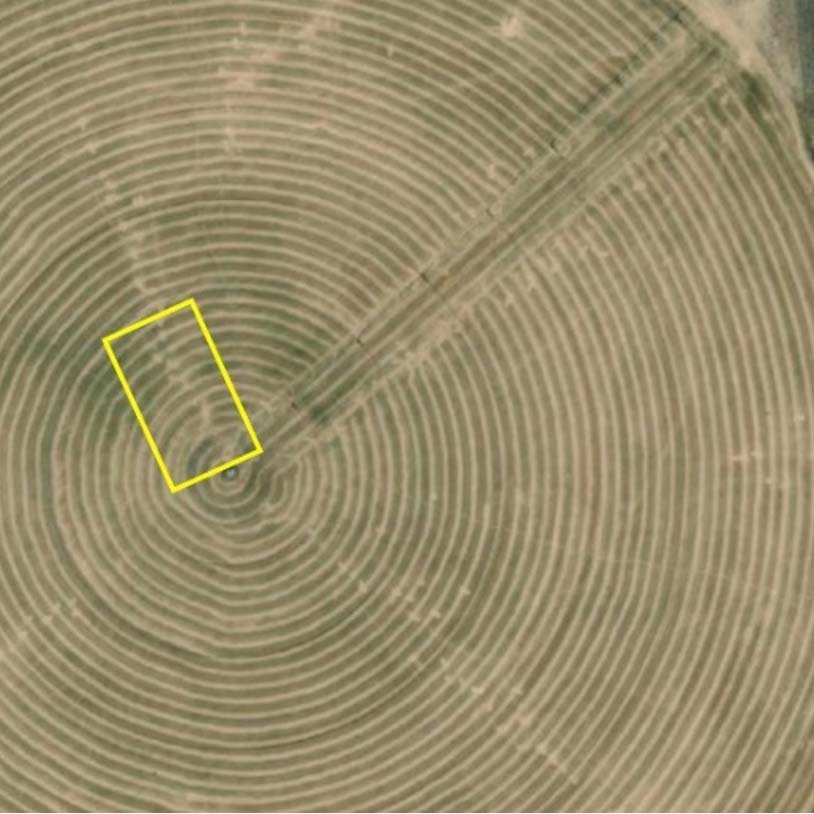
Figure 5. This field has cattle tracks throughout, and placing plots in the center of the pivot makes them hard to access due to the lack of roads. The plots are also susceptible to inconsistent irrigation from the inner pivot towers out.
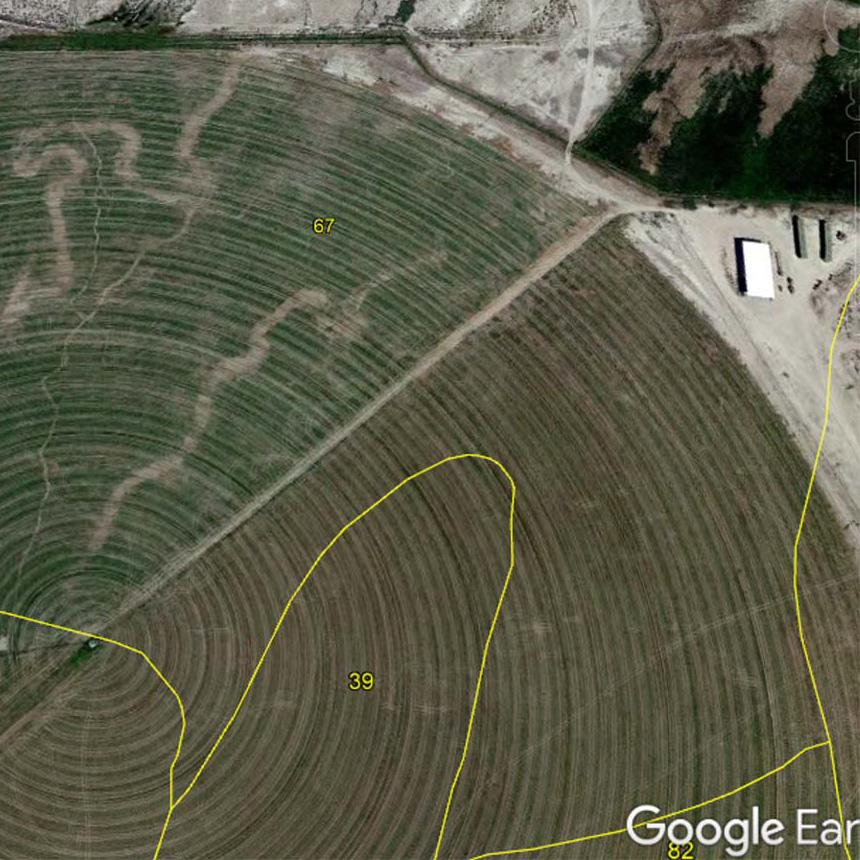
Figure 6. The top side of this field has varying elevation, differing soil types, cattle tracks throughout, and no large areas with a uniform crop.
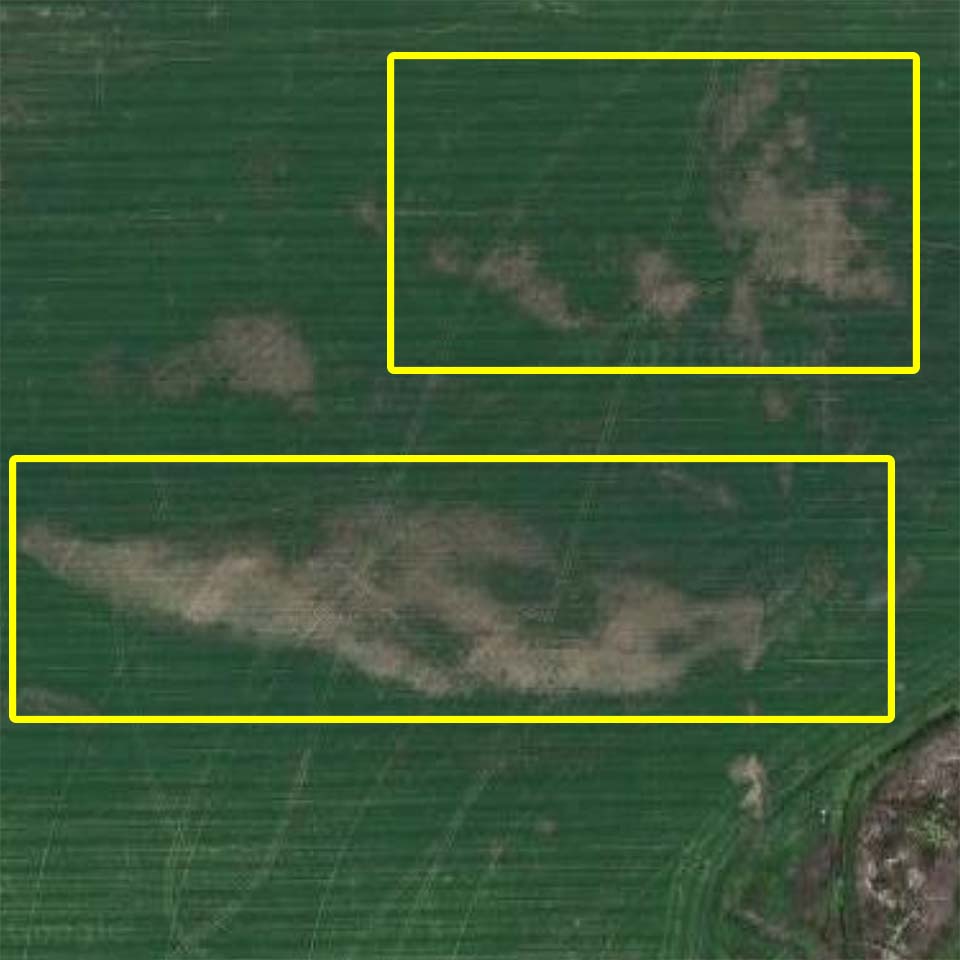
Figure 7. This field has no large areas where the crop is consistent due to the large bare patches and the truck tracks through.
Uniform areas. All on-farm research experiments should take place in areas of fields with high uniformity in terms of both the characteristics of the land and the history of crop growth. This helps to eliminate variability and ensure that results are reliable (see examples in Figures 3–4). If you are trying to determine how to treat a bad area in a field, find a uniformly bad area large enough for the research area so results are consistent. Areas with inconsistent crop growth, differing soil types, or inconsistent irrigation should be avoided unless they are the target of the research (see examples in Figures 5–7). Knowledge of the field and Google Earth can be excellent tools for identifying research areas. Once you locate your field in Google Earth, the historical images tool can help identify problem areas to either avoid or test, depending on your research plan.
Buffer strips are also important to incorporate. These are simply small areas of land left untreated between trial plots to prevent treatments from “bleeding” into adjacent plots. If bleeding is a concern, consider making plots wide enough that at harvest, the center of each plot can be taken and the edges left. This will ensure that the part of the plot harvested has not been affected by the treatment of an adjacent plot (Nielsen, 2008).
Plot dimensions for research plots will vary depending on the harvesting method. When determining plot size, the width of implements, especially the harvester, should be considered. The width of research plots should match the width of the harvester to ensure that different treatments do not get mixed while harvesting. For example, 15.5-foot-wide plots to match the swather width are common in alfalfa. For corn silage, 15-foot or 20-foot-wide plots (or six or eight corn rows spaced at 30 inches) are common. Plot lengths should be at least 30 feet but could be as long as the entire field. Plots should be large enough that a sample reflective of the treatment area can be collected but not so large that harvesting is difficult.
3. Ensure randomization and replication.
Repeatability of treatments within the research plot area is crucial to eliminating bias. It ensures that inherent variability within the research area does not impact the trial results. Replication is also crucial and lends greater credibility to results by determining the consistency of the treatment and if the results were caused by the treatment or by another factor (Nielsen, 2008). In each trial, we recommend including at least three to four replications of both the treated area and the non-treated area (aka control or check). All treatments in the research should be established in one field because each field has unique management history. Likewise, implementing a treatment in half of a field vs. another half of a field is not a proper replication because it lacks randomization. Without randomization and multiple replications, proper conclusions cannot be made. Further, replication and comparison of the treated area to the untreated control or check treatments is essential to determining whether treatments changed yield, crop quality, and profitability.
4. Figure measurements.
Yield and crop quality measurements are critical for nearly all research because they are the primary factors in determining profitability. The type of yield measurements depend on which crops are grown and how they are harvested.
- Hand harvesting – This is the most common method used by researchers and includes: marking off a known area inside each treatment (for example, 10 feet of a windrow or 10 feet of two corn rows); cutting the windrow or all plants in the known area; weighing all the wet plant material; collecting a small wet sample that is weighed, then dried and weighed again to determine moisture and calculate dry yield. The sample can also be used for forage quality. Hand harvesting is simple, but using farm-scale machinery for yield measurements is more practical for most farms.
- Baled forage – It can be difficult to make full and distinct bales from each plot. You may need to clean out a baler between plots or strips for partial bales or make baling length ideal for full bales (if possible). Bale size may require very large multi-acre plot size. The most important factor is that you bale the same length of windrows in each plot. Weigh each bale and portion of bale from each plot. Collect a representative sample using a hay sample coring device to determine moisture content before drying so dry weights can be calculated and compared. The sample can also be used to test forage quality.
- Chopped forage – This method is much easier than baled forage. Chop forage from the same area in each plot (for example, one width of harvester at specified distance like one full pass down the field) into separate trucks and weigh each truck so each plot has its own yield measurement. Collect a small sample from each truck and measure forage quality and moisture so dry weights can be calculated.
- Grain – This is by far the easiest way to measure yield in on-farm research. If a combine is equipped with a yield monitor, ensure that it is well-calibrated and working properly. The inner area of research plots or strips (avoid border areas) can be extracted from yield maps to compare treatments. If no yield monitor is available, utilize the same methods as chopped forage to harvest and separate the grain from each plot and weigh trucks and measure moisture to compare dry yields.
What about record-keeping and rules for good on-farm trials?
When conducting research, it is essential to keep careful notes and records, especially of conditions that may influence outcomes. Good record-keeping is easily neglected when farming gets busy, time is short, and production agriculture, not research, is the priority. Regardless of how good your memory may be, important details will be forgotten if not written down. Mark and label each test plot in the field and field edges to make identification simple when it is time to apply treatments and especially find the plot at harvest. Keep a map of the trial layout for future reference. Be sure to record any variables that might affect the results, especially if it has not affected the entire field. In summary, keep on-farm research simple, focus on the objectives, and stick to your plan. Making changes after the experiment has been planned and established can undermine the study. Consistency is key to effective research.
How do I analyze and interpret data?
Once you have collected data from your trials, the final step is to complete an analysis of the data. There are generally two simple approaches for analyzing data.
1. Compare the difference of two or more treatments.
Two Treatments
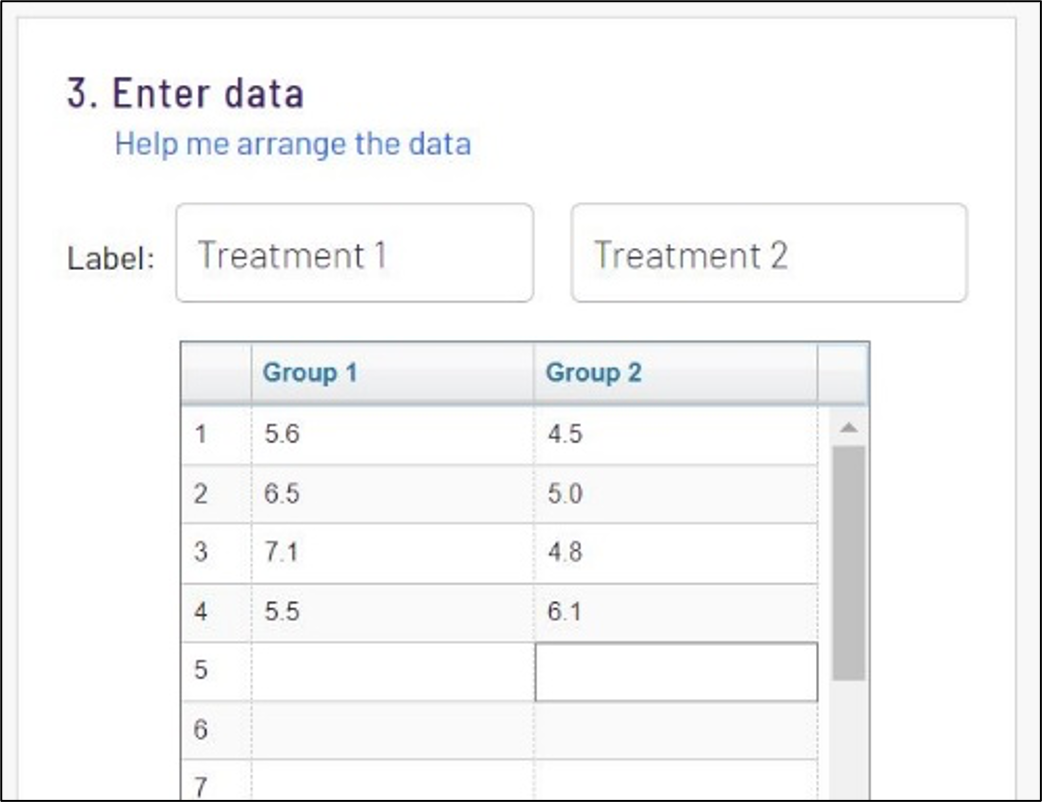
Figure 8. Example of a t-test setup in an online calculator with two treatments and four measurements of alfalfa yield (dry tons per acre).
If you want to compare the difference between two treatments, you can use a t test. This can be conducted using a variety of online calculators or Microsoft Excel. This online calculator (https://www.graphpad.com/quickcalcs/ttest1.cfm) offers a simple way to conduct your test.
- Select “Enter up to 50 rows” in box 1.
- Select “unpaired t test” in box 2.
- Enter your two treatment names and the data in box 3 (Figure 8).
- Click “Calculate Now” in box 4.
The results will then be displayed. The most important result is the two-tailed p value. If this number is less than 0.10 (90% confidence of a difference) or 0.05 (95% confidence of a difference), that means there is a difference in your two treatments. If the p value is greater than 0.10, there is low confidence that there is a difference in your treatments.
Three or More Treatments
The process for comparing three or more treatments is similar to a t test, but an analysis of variance (ANOVA) needs to be used. There are several free online calculators to conduct an ANOVA, but many have more statistical details than you might want. A simple approach is outlined in the following five steps:
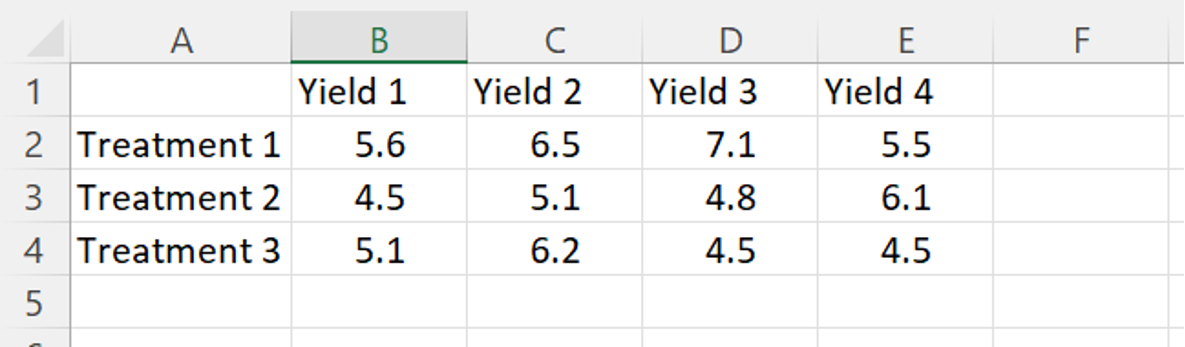
- Step 1 – Enter your data into an Excel spreadsheet.
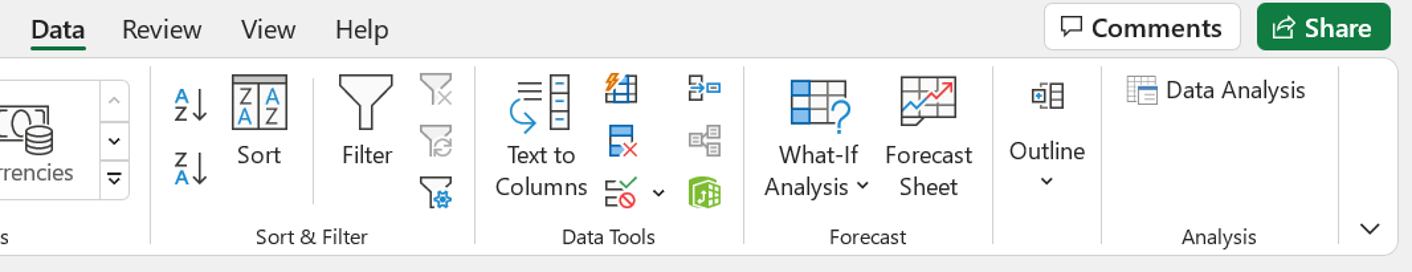
- Step 2 – Find the “Data Analysis” button on the far right-hand side under the “Data” tab. This is a free add-on package. If it is not in your tab, you will need to add it by selecting File > More > Options > Add-ins. Once there, find and select “Analysis ToolPak,” and then click “OK” at the bottom.
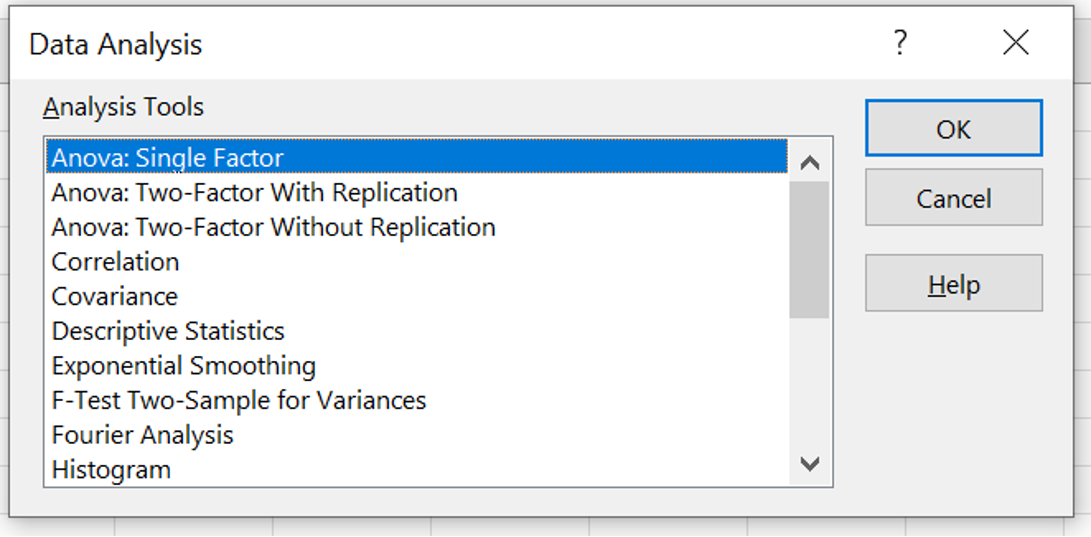
- Step 3 – Open “Data Analysis” and select the first option, “ANOVA: Single Factor.”
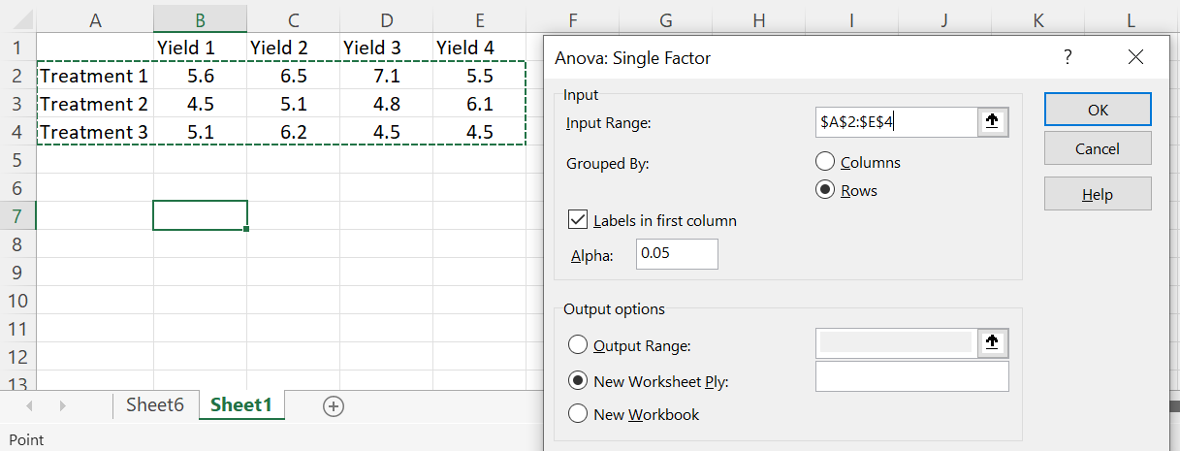
- Step 4 – Select your data for the input range (for example, cells A2:E4). Select “Rows” for the Grouped By option and “Labels in First Column.” Click “OK.”
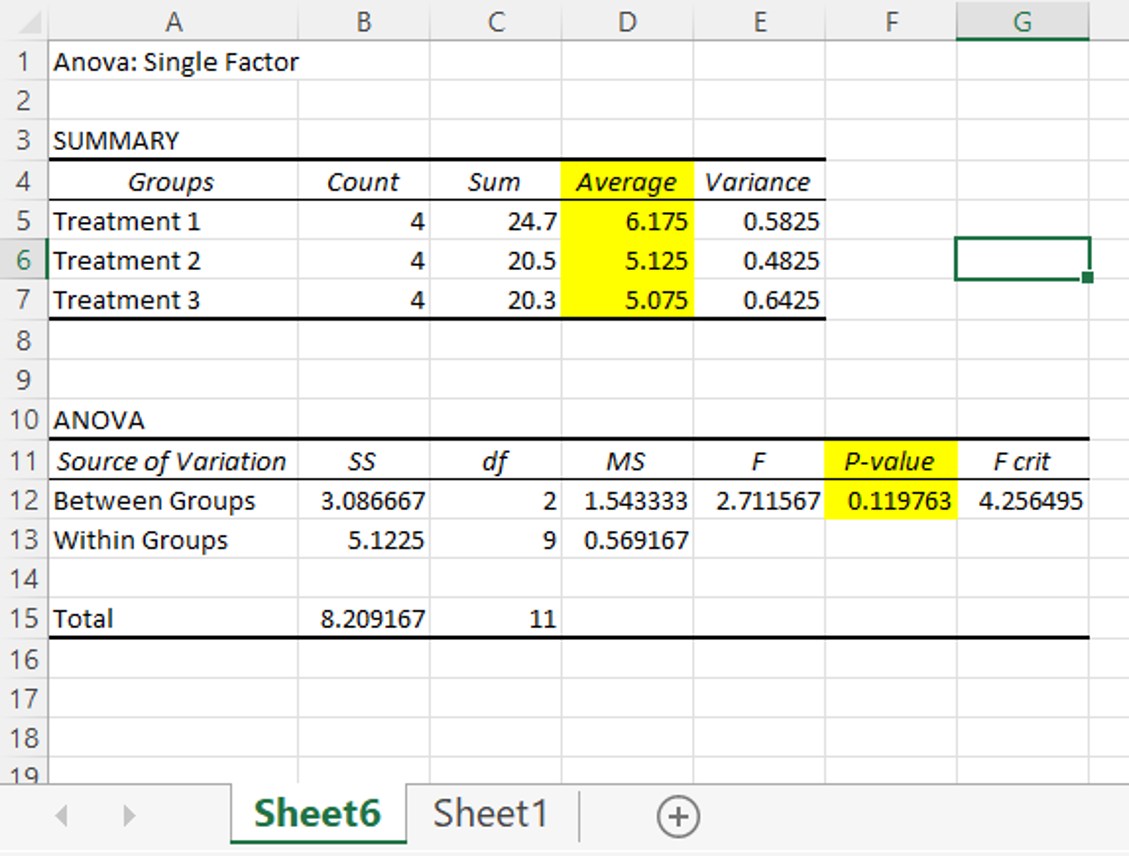
- Step 5 – The summary will be placed in a new sheet. The most important information is the “average” of each treatment and the “p value” (highlighted below). The p value is interpreted the same as the t In this example, the p value was 0.119. This is above 0.10 and means that there was no difference in the “average” yield of the three treatments.
2. Identify the optimal rate of a treatment.
This would be used if you had a range of treatments like four or more planting or fertilizer rates and you were trying to identify the optimum rate. Regression analysis would be required to identify the rate. Regression analysis can be completed using online calculators or Excel. It often requires that several models are fit and compared. Consult with an experienced researcher or advisor for how to properly conduct and interpret regression analyses.
Summary
Conducting on-farm research is an excellent way to evaluate practices or products with potential to improve crop production and farm profitability. Those interested in conducting research should test those products and practices which are credible and help to meet the operation’s goals. To produce reliable results, utilize proper design, randomization, replication, measurements, record-keeping, and analysis. Keep projects simple to avoid errors or trial abandonment. Do not “bet the whole farm” when implementing new practices or products. Start small on one good field that is big enough to implement results of research and then expand those practices that prove successful and profitable.
Acknowledgments
This material is based upon work that is supported by the National Institute of Food and Agriculture, U.S. Department of Agriculture, under award number 2021-38640-34695 through the Western Sustainable Agriculture Research and Education program under project number [SW22-941]. USDA is an equal opportunity employer and service provider. Any opinions, findings, conclusions, or recommendations expressed in this publication are those of the author(s) and do not necessarily reflect the view of the U.S. Department of Agriculture.
References
- Chaney, D., Clark, A., Friedman, D., & Rivard, C. (2017). How to conduct research on your farm or ranch. Sustainable Agriculture Research & Education (SARE) Technical Bulletin (2nd ed.), U.S. Department of Agriculture. https://www.sare.org/resources/how-to-conduct-research-on-your-farm-or-ranch/
- Davis, R. F., Harris, G. H., Roberts, P. M., & MacDonald, G. E. (2017). Designing research and demonstration tests for farmers' fields. University of Georgia Extension. https://extension.uga.edu/publications/detail.html?number=B1177&title=Designing+Research+and+Demonstration+Tests+for+Farmers%27+Fields#:~:text=Replication%20is%20necessary%20because%20all,that%20received%20the%20same%20treatment
- Nielsen, B. (2008). A practical guide to on-farm research. Purdue University. https://www.agry.purdue.edu/CCA/2008/Proceedings/NielsenResearch.pdf
- Thompson, L., & Glewen, K. (2017). 7 Reasons to conduct on-farm research. Farm Progress. https://www.farmprogress.com/farm-operations/7-reasons-conduct-farm-research
May 2022
Utah State University Extension
Peer-reviewed fact sheet
Authors
Matt Yost, Jody Gale, Earl Creech, Megan Baker, Jeffrey Austin, Grant Cardon, and Cody Zesiger
Matt Yost
Agroclimate Specialist
PSC Dept

Jody Gale
Extension Associate Professor | Agriculture Economic Development | Sevier County
Agriculture and Natural Resources


Grant Cardon
Soils Specialist
PSC Dept

Cody Zesiger
Extension Associate Professor | Agriculture & Natural Resources | Davis County
Agriculture and Natural Resources
Related Research
Agricultural Irrigated Land and Irrigation Water Use in Utah
This article is a summary of several estimates of the extent of agricultural irrigation in Utah and some associated trends.

Agriculture Water Use and Economic Value in the Great Salt Lake Basin
This fact sheet provides information about the following topics in the context of the Great Salt Lake and its basin: Great Salt Lake facts, Human effects on the size of the lake, Changes to population and land use, Agricultural water use, Agriculture and
County-Level View of Irrigation Trends in Utah and the West
As water demand and scarcity increase simultaneously over the coming decades, water managers and growers will need to optimize water use on their irrigated lands. These challenges have been especially noticeable as the Western U.S.faces a prolonged “megad
Cover Crops for Utah
The purpose of this fact sheet is to provide the current state of knowledge on cover crop management for Utah based on USU research and local grower experience.
On-Farm Research Guide
This how-to guide will cover benefits and best practices for conducting successful on-farm research.
Quinoa for Utah
The purpose of this fact sheet is to date and to provide insight into some of the opportunities and limitations to quinoa production in Utah.
Sorghum-Sudangrass Production Guide
Sorghum-Sudangrass, or “Sudex,” is a hybrid of forage sorghum (Sorghum bicolor) and sudangrass (S. bicolor var. Sudanese). Both are high-producing, rapidly growing, warm-season, annual summer crops. While most annual and perennial grasses grown in Utah ar
Teff Hay Production Guidelines for Utah
Teff (sometimes spelled tef) [Eragrostis tef (Zucc.) Trotter] is a relatively new forage crop to Utah that has grown in popularity in recent years. It is an annual, warm-season grass that is native to Ethiopia. Teff has fine stems, shallow roots and is no
Ten Frequently Asked Questions About Growing Cannabis
Cannabis sativa is the scientific name of the plant that includes both hemp and marijuana. It is one of the oldest cultivated plants in human history and has been grown for seed, fiber, oil, and medicine. There are generally three recognized subspecies (C
Understanding Irrigation Water Optimization
It is important to consider the possible hydrologic impacts of irrigation optimization efforts to avoid implementing practices that have little appreciable effect relative to the desired outcome. Examples of desired outcomes include increasing supply reli