Measuring and Building Soil Health

What is Soil Health and Why am I Hearing So Much about it?
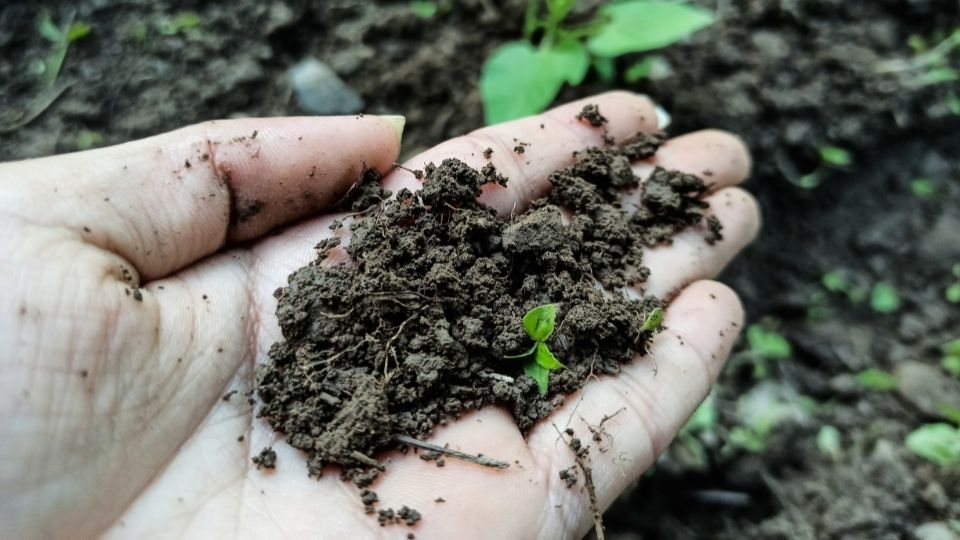
Scientific communities have researched and debated the issues and benefits of soil sustainability and conservation for decades. From those efforts, “soil health” has emerged as the educational face of efforts to protect and improve the quality and productivity of this crucial, life-sustaining resource. Soil Health has been defined by the USDA-Natural Resource Conservation Service (NRCS, 2018) as “…the continued capacity of soil to function as a vital living ecosystem that sustains plants, animals and humans.” Several other similar definitions exist. Of course, only living things can have “health” and the hope of the educational effort surrounding “soil health” is to emphasize the critical nature of the life of soil beyond the inherent physical and chemical properties.
What are Some Characteristics of Healthy Soils?
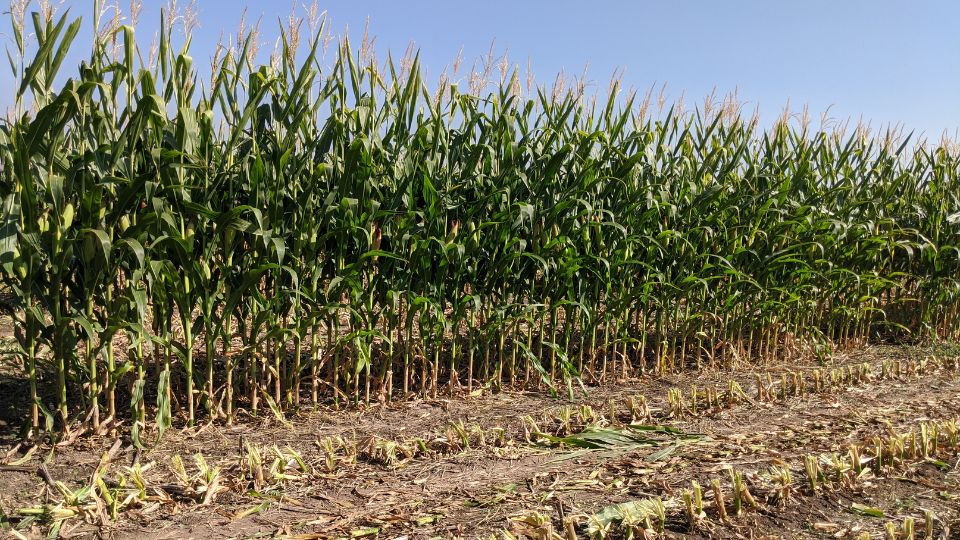
One of the primary functions of soil is to sustain profitable crop production repeatedly over time. In fact, the health of the soil affects nearly all aspects of a farming operation. Farmers in the United States who have worked the land for many years realize characteristics of healthy soils. Some of their observations are that healthy soils have or are:
- Deeper
- More water holding capacity
- Better drainage
- Faster decomposition
- Higher organic matter
- Less erosion
- More earthworms
- Better aromas
- Less fuel costs from tillage
- Less wear and tear on machinery
- Less fertilizer requirements
- Greater crop yields
- Higher quality crops
- Greater variety of weeds
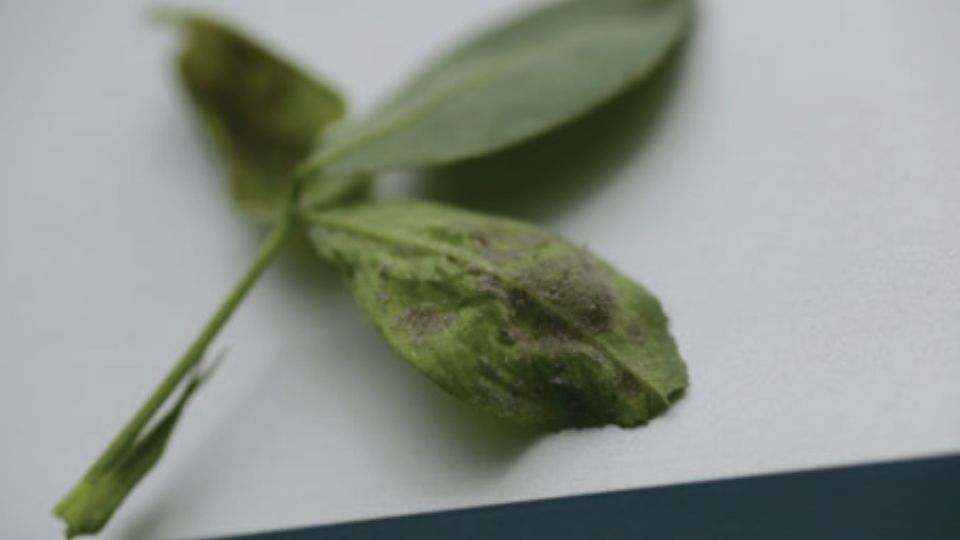
- Less disease and insect problems

What Makes Soil Less Healthy?
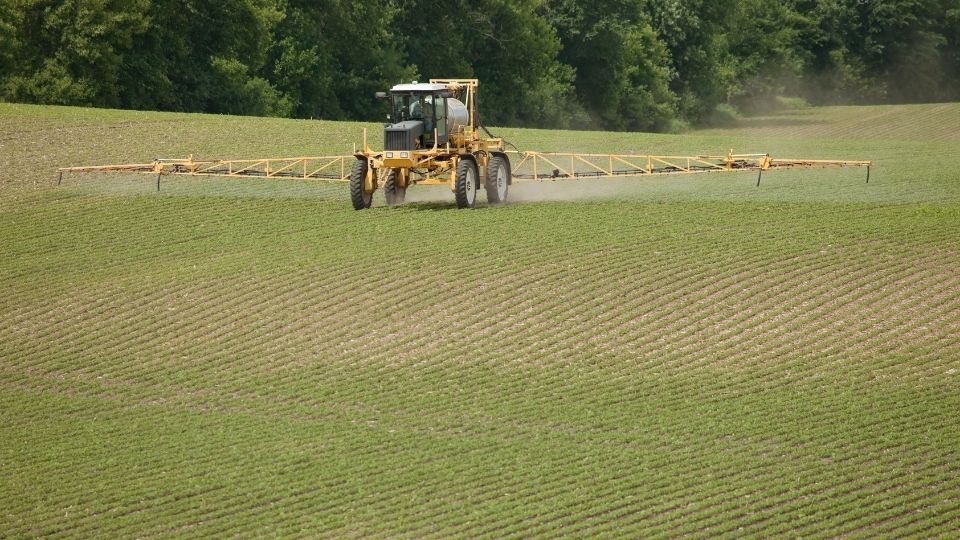
Soils have some inherent properties that land managers simply cannot change or control. A few of these include soil texture, parent material, and the other prevailing soil forming factors of climate, topography, etc., all of which have major impacts on the productivity and health of soil. By contrast, land managers can have large positive or negative impacts on some aspects of soil health. For example, crop selection and tillage management can rapidly accelerate soil erosion. Concerted effort to avoid factors that can be controlled will help maintain and hopefully bolster soil health. Some of the major factors that make soils less healthy include:
- Increase in erosion (wind or water) – Erosion usually increases when soil surfaces are bare and as tillage intensity increases. Erosion of topsoil is a catalyst for downward spirals in soil health that often lead to organic matter and soil structure loss that further exacerbate erosion (Magdoff and Van Es, 2009).
- Loss of organic matter – Organic matter is lost when decomposition exceeds replenishment and when tillage intensity increases. Organic matter loss decreases crop yield, increases the need for supplemental fertilizer, decreases water holding capacity, and a variety of other negative consequences.
- Loss of soil structure – Soil structure loss results from several factors including soil compaction, physical and mechanical breakdown from aggressive tillage and other disturbances, or sodium buildup that can causes clay particles to separate or disperse. Excessive tillage also accelerates mixing and oxidation, which increase the rate of decomposition of organic matter and, hence, the loss of structure.
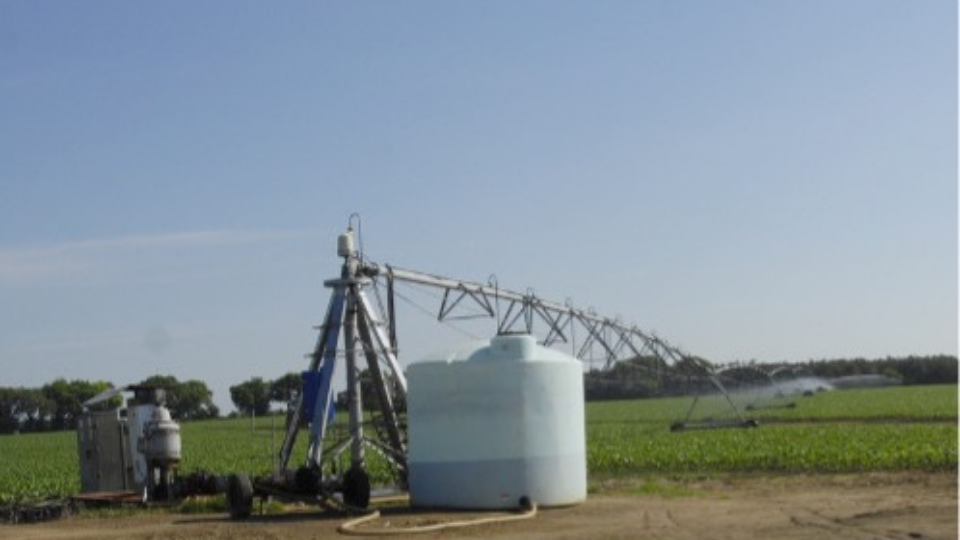
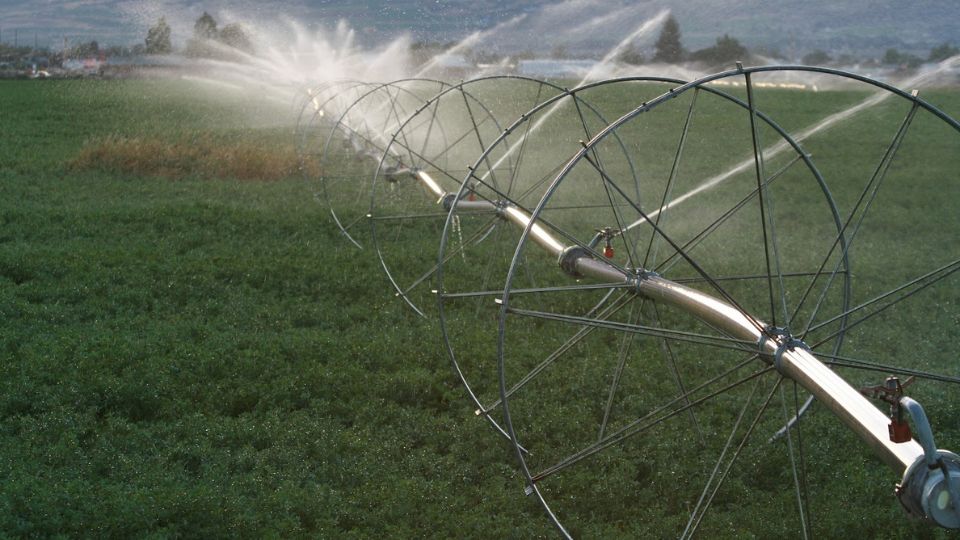
- Increase in soil salinity – Poor irrigation water quality, excessive salts in fertilizer, and poor drainage lead to increased soil salinity. In addition to soil structure breakdown, soil salinity also negatively affects aeration, water infiltration and storage, seedling emergence, and root penetration/growth.
What Makes Soil Healthier?
Many practices can promote soil health. Five practices with high potential to improve soil health include:
- Adding organic matter amendments.
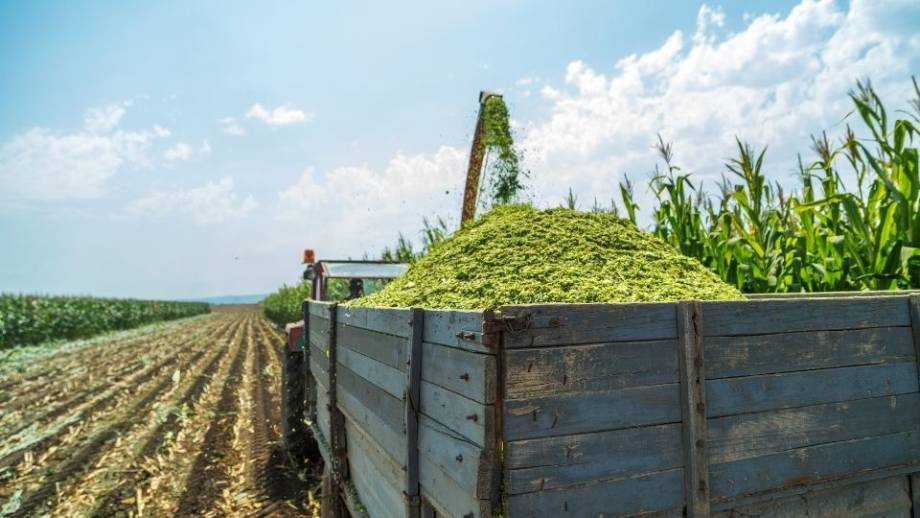
- Returning crop residues.
- Reducing or eliminating tillage.
- Regular and diverse crop rotations.
- Salinity management.
The first four of these practices are really all about building soil structure—or the formation and stabilization of soil aggregates, and preventing degradation or erosion. Ninety-plus percent of the solid materials making up natural soils are particles derived from the breakdown of primary minerals (sand and silt) or the formation of secondary minerals (clay) in the mix. The rest of the solid material is organic matter. Organic matter is only 3 percent, at most, of the solid material in arid and semi-arid environments, but is important for at least three major reasons:
- Organic matter is responsible for the formation and stability of soil aggregates. That is important because aggregation opens up soils to allow optimal air and water movement and ensures that living things in the soil (plants, insects, bacteria, fungi, etc.) can obtain the water (and nutrients in the water) and the atmospheric building blocks (especially carbon and oxygen) that they need to grow and thrive.
- Organic matter is an important source of carbon or “food” for many decomposers. Decomposition is important because it produces the gelatins, polysaccharides, organic acids and other “glues” that hold soil particles together in aggregates. Organic matter decomposition not only provides needed nutrition directly to many soil organisms, and the formational compounds for soil structure, it releases nutrients locked in the material, thereby recycling them for living plant and animal use. Besides decomposition, healthy and abundant soil organisms also provide many other benefits like prevention of soil borne diseases and improved nutrient cycling.
- Organic matter helps adsorb and retain nutrients and water in soils. Water retention is particularly important in Utah and other areas that experience frequent droughts.
Increasing organic matter is one of the best ways to enhance soil properties and function as a plant growth medium. Cover crops, organic amendments, retaining residue, and reducing or eliminating tillage all help promote higher organic matter content in soils.
The natural decomposition of organic matter ensures that its supply needs regular replenishment. Organic matter must be introduced into the soil annually at a minimum to maintain soil properties, and preferably to enhance them over time. Regular additions of organic matter include root and above-ground tissues of plants growing in the soil (crops and cover crops) or through amendments (manure, compost, residue, other organic materials). How much, you ask, is too much to add? When it comes to organic matter addition (unlike many other amendments) there is generally no “too much” as long as care is taken to account for the properties specific to each type of amendment. Be cautious about high C:N ratios, excessive phosphorus, excessive salt concentrations, and potential pathogens (when used for vegetable or fruit crops) when selecting amendment types and rates. These excesses can cause large crop yield decreases (Bary et al., 2016). The quality of the organic material also needs to be carefully examined when selecting sources and rates. For example, poultry manure typically has much more nutrition than horse manure.
The improvements gained from implementing these first four practices also influence the fifth soil health building factor of salinity management. Improving water infiltration and storage capacity, which usually result from increased organic matter and improved soil structure, coupled with excess irrigation water are some of the most effective ways to reduce salt concentrations in the topsoil. In addition to these two methods, selecting crop types or crop genetics with greater salt tolerance helps improve soil health.
How is Soil Health Measured?
Many recent local, regional, national, and international efforts are occurring to define “soil health” and determine the measurable indicators of its status. These indicators are generally used to quantify the physical, biological, and chemical properties of the soil. A summary of some of the most dominant indicators of interest are included in Table 1.
While the debate is ongoing and many indicators exist, five leading indicators of soil health are emerging. These include:
- Soil aggregate stability
- General biological activity
- Microbial diversity
- Active carbon content
- Organic nitrogen availability
Chief among these indicators is soil aggregate stability, which is universally seen as the integrator of many other indicators. In other words, soil structure is a function of the interplay of soil minerals, carbon and nitrogen cycling, and diverse, active microbial communities.
Combinations of these five and some other indicators in Table 1 have been developed into “soil health” tests or scoring criteria, some of which have been recently commercialized. Some of the most widely available commercial tests for soil health are summarized in Table 2. Prices for these test are higher than most routine soil fertility tests and range from about $35 to $110 per sample.
How Might I go about Building Soil Health?
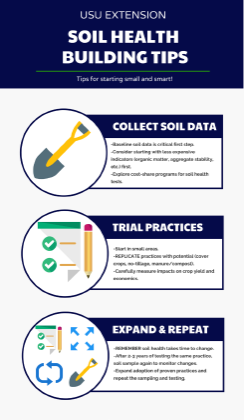
- Collect baseline data on soil health: The first and critical step in improving soil health is to have good information about its current health. Before sampling and making large investments in soil health test packages, consider examining some less expensive individual analyses first. For example, some of the most affordable and introductory measures of soil health are routine organic matter, aggregate stability, and soil respiration. After gaining some experience with these introductory measures, explore other soil health indicators or test options and consider trying these tests on a section of a field, on a single field or garden area first before investing in testing large areas. For those who want to jump all in with soil health testing, explore incentives and cost share programs designed to subsidize the cost of comprehensive soil health testing. Land managers may also consider conducting their own on-farm soil health tests such as a soil slaking and/or hose test for soil structure estimates, or soil organism inventories and soil respiration test kits. See Thomsen et al. (2017) for details on these procedures.
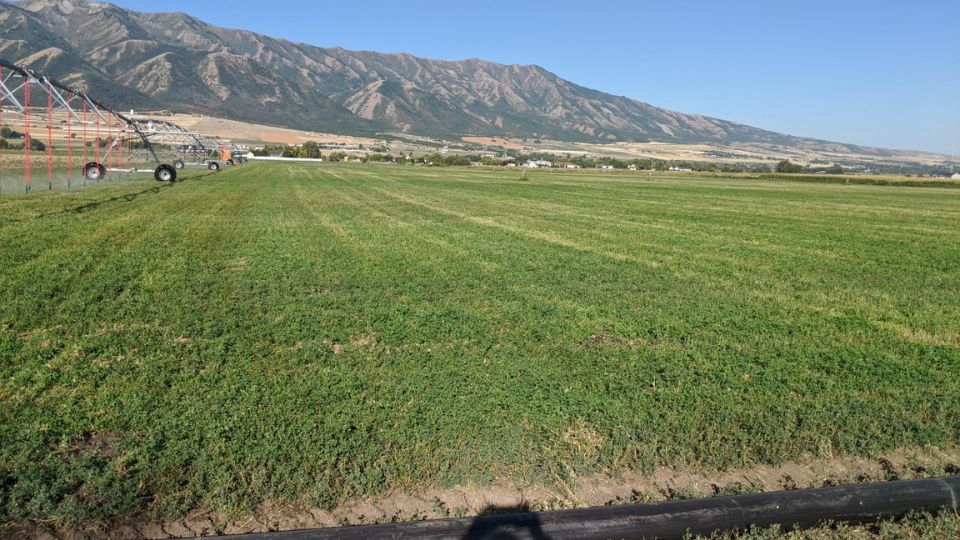
- Trial soil health practices: Once you have information on some basic soil health measurements, you can now begin to test practices that might improve these soil health indicators. Reduced or no-tillage, cover crops, and adding perennial crops in rotations are some of the most widely used options for improving soil health. Before incorporating these practices on whole fields or a whole farm, it is prudent to test them in small, replicated areas of several fields over a few years. This will be especially important in Utah because cover crops will require extra water and may not work well in drought years. Most crop rotations inUtah include alfalfa and perennial grasses. These crops are excellent at building and maintaining soil health and should be incorporated into rotations where they are feasible and economic. Although perennial-based systems do limit some options for no-tillage and cover crops, opportunities do exist for these practices when rotating in and out of perennial crops. Keep in mind that several other practices such as organic amendments (manure, compost, etc.), diverse crop rotations, nutrient and salinity management, integrated pest control, and irrigation management will also promote soil health. As mentioned above, the key to adding organic amendments is knowing what you are adding to the soil by testing and planning applications that do not cause other unintended consequences like nutrient imbalance or salinity.
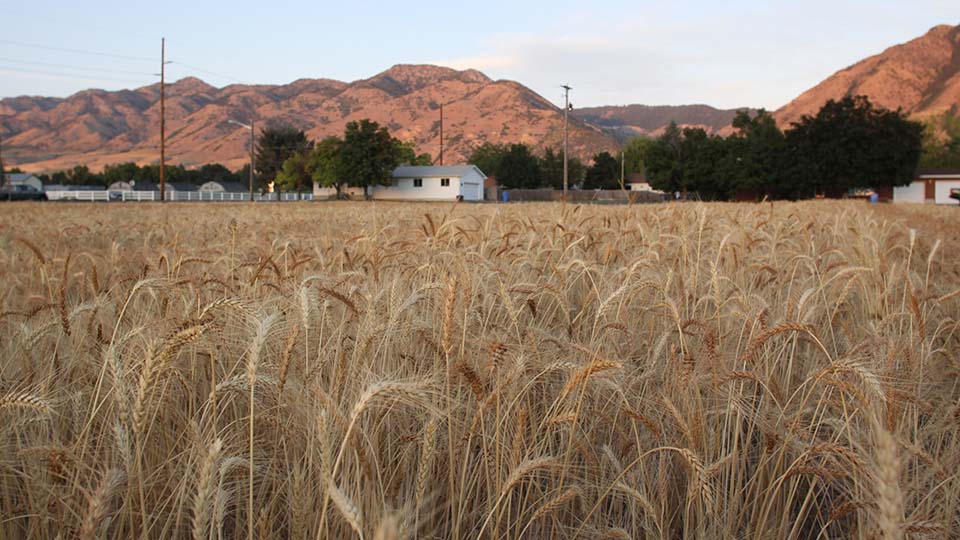
- Expand adoption of proven practices and repeat testing: Be sure to remember that the health of your soil may not change drastically overnight or maybe even in three to five years. It often takes a long time to increase organic matter and improve soil structure. Be wary of claims of products or practices resulting in drastic changes in soil organic matter over short time periods because it is usually not biologically feasible. In reality, it may take large organic amendment applications over about 5-10 years or more to raise organic matter levels by 1% (Whitney, 2018). For example, it took 80 dry tons manure per acre applied each year for 9 years in a wheat-sorghum-fallow rotation in Kansas to raise organic matter from 3 to 4% (Obour, et al., 2017). However, small increases in organic matter can sometimes have large and prolonged positive impacts on Utah soils. A single application of 25 tons compost/acre to dryland wheat in northern Utah increased organic carbon from 0.5 to 1.0%, and had impacts that have persisted for over 20 years (Reeve et al., 2012). After utilizing soil health practices for at least 2-3 years, conduct the same set of soil health analyses using the same methods as were used for the baseline samples. Consider expanding practices and soil health testing with measured and observed differences and neutral or positive impacts on crop yield or profit. Continue monitoring practices and test new practices utilizing a similar approach as described above.
Table 1
Some soil health indivators and associated measurements and soil processes.
| Catergory | Soil health indicator | Measurements and Processes | Approximate cost ($/sample)1,2 |
|---|---|---|---|
| Physical Properties |
|
|
|
| Biological Properties |
|
|
|
| Chemical Properties |
|
|
|
Table adapted from Moebus-Clune et al., 2016.
1Most analyses will require an additional charge of up to $10 for processing and sample preparation. 2Many fertility packages exist that greatly reduce pH, organic matter, salinity, and nutrient costs.
Table 2
Summary of some available soil health test packages in the United State
| Soil Health Test | Measurements | Soil Health Scoring | Cost Per Sample1 | More Information |
|---|---|---|---|---|
| Comprehensive Assessment of Soil Health (CASH) – Basic |
|
Each measurement is scored from 0-100 in relation to the distribution of a large database of soil samples. All scores are averaged for an overall score. Higher score is better. | $60 | http://soilhealth.cals.cornell.edu/test ing-services/comprehensive-soil-health-assessment/ |
| Comprehensive Assessment of Soil Health (CASH) – Standard |
All of the basic plus:
|
Each measurement is scored from 0-100 in relation to the distribution of a large database of soil samples. All scores are averaged for an overall score. Higher score is better. | $110 | http://soilhealth.cals.cornell.edu/test ing-services/comprehensive-soil-health-assessment/ |
| Haney Soil Health Test (HSHT) |
|
Soil respiration, carbon, nigtrogen, and C:N ration combined into one score that ranges from 0-50. Higher score is better. | $50 | https://www.wardlab.com/soil-health-services.php |
| Soil Fertility and Health Audit - Basic |
|
Score is average of the five indicators. A perfect score is 50 and 25 is good. This can be combined with a fertility score in another test. | $60 | https://woodsend.com/soil-health-test/ |
| Soil Health Package - Basic |
|
Considered a soil health checkup. No combined scores are provided. Higher values are better for all indicators except pH. | $36 | https://cafnr.missouri.edu/soil-health/ |
| Soil Health Package - Expanded | All of the basic plus:
|
Considered a soil health checkup. No combined scores are provided. Higher values are better for all indicators except pH. | $80 | https://cafnr.missouri.edu/soil-health/ |
1Prices were obtained from websites included in the table on 28 November 2018.
References
Bary, A, C. Cogger, and D. Sullivan. 2016. Fertilizing with manure and other organic amendments. Pacific Northwest Extension publication PNW533. http://cru.cahe.wsu.edu/CEPublications/PNW5 33/PNW533.pdf
Magdoff F. and H. van Es. 2009. Building soils for better crops: Sustainable soil management. Sustainable Agriculture Research and Education. Sustainable Agriculture Network Handbook Series. bk 10. 3rd edition.
Moebius-Clune, B.N., D.J. Moebius-Clune, B.K. Gugino, O.J. Idowu, R.R. Schindelbeck, A.J. Ristow, H.M. van Es, J.E. Thies, H.A. Shayler, M.B. McBride, K.S.M Kurtz, D.W. Wolfe, and G.S. Abawi. 2016. Comprehensive Assessment of Soil Health – The Cornell Framework. 3rd ed. Cornell University.
Obour, A., P. Stahlman and C. Thompson. 2017. Long-term residual effects of feedlot manure application on crop yield and soil surface chemistry. J. Plant. Nutr. 40:427-438.
Reeve, J.R., J.B. Endelman, B.E. Miller, and D.J. Hole. 2012. Residual effects of compost on soil quality and dryland wheat yield sixteen years after compost application. Soil Science Society of America Journal. 76:278-285. Available at: https://www.researchgate.net/publication/2311 75165_Residual_effects_of_compost_detectabl e_sixteen_years_after_application_in_dryland_ wheat
Thomsen, E., J. Reeve, D. Alston, and G. Cardon2017. Simple soil tests for on-site evaluation of soil health in orchards. Utah State University Extension Factsheet.
https://digitalcommons.usu.edu/cgi/viewcontent.cgi?article=2814&context=extension_curall
Whitney, T. 2018. Building soil organic matter takes time. Soil Health Nexus Blog. https://soilhealthnexus.org/building-soil-organic-matter-takes-time/
Revised March 2019 and published to the Web May 2022
Utah State University Extension
Peer-reviewed fact sheet
Authors
Matt Yost, Grant Cardon, Brad Crookston, Jennifer Reeve, and Earl Creech
Utah State University Specialists

Matt Yost
Agroclimate Specialist
PSC Dept

Grant Cardon
Soils Specialist
PSC Dept

Related Research
2015 Costs and Returns for Flood Irrigated Alfalfa, Box Elder County
Enterprise budgets are the building blocks of a farm or ranch. They represent estimates of income and expenses for a specific period of time using a set of production practices and inputs for that enterprise.

2015 Costs and Returns for Irrigated Soft White Wheat, Box Elder County
Enterprise budgets are the building blocks of a farm or ranch. They represent estimates of income and expenses for a specific period of time using a set of production practices and inputs for that enterprise.

2019 Costs and Returns for Irrigated Safflower, Northern Utah
Enterprise budgets are the building blocks of a farm or ranch. They represent estimates of income and expenses for a specific period of time using a set of production practices and inputs for that enterprise. This research contains sample costs and return

2022 Costs and Returns for Non-irrigated Flax in Utah
Enterprise budgets are created to help a grower to understand all the costs and returns associated with producing a crop and are usually expressed on a per-unit basis, such as per acre.
4R’s of Irrigation Management
The research community and fertilizer industry have developed and utilized a framework termed “4R nutrient management” to help improve fertilizer stewardship. For decades, national and international organizations and institutes such as The Fertilizer Inst

50 Common Questions About Field Crops
Utah State University (USU) Extension strives to provide research-based information and knowledge to help agricultural producers. Producers often have questions about several aspects of field crop production. This article is not comprehensive of all ques
Accurate Irrigation Water Flow Measurement in Pipes
Accurate flow measurement is important to irrigation water management and water rights accounting and protection. Accurate flow measurement is essential in ensuring equitable water distribution to water rights holders and shareholders within irrigation co
Adopting Organic Wheat: Grower Motivations and Concerns
A recent study of wheat producers in the western United States found that wheat growers were actually transitioning out of organic production due to concerns about pest control and profitability. This fact sheet provides an overview of the study results b
Agricultural Irrigated Land and Irrigation Water Use in Utah
This article is a summary of several estimates of the extent of agricultural irrigation in Utah and some associated trends.

Agricultural Producers’ Motivations and Challenges With Improving Soil Health in Utah
This study examines Utah agricultural producers' motivations and challenges in adopting soil health practices. It highlights the lack of localized resources and transferable knowledge as barriers, while emphasizing producers' desire to gain insights, enha

Agriculture Water Use and Economic Value in the Great Salt Lake Basin
This fact sheet provides information about the following topics in the context of the Great Salt Lake and its basin: Great Salt Lake facts, Human effects on the size of the lake, Changes to population and land use, Agricultural water use, Agriculture and

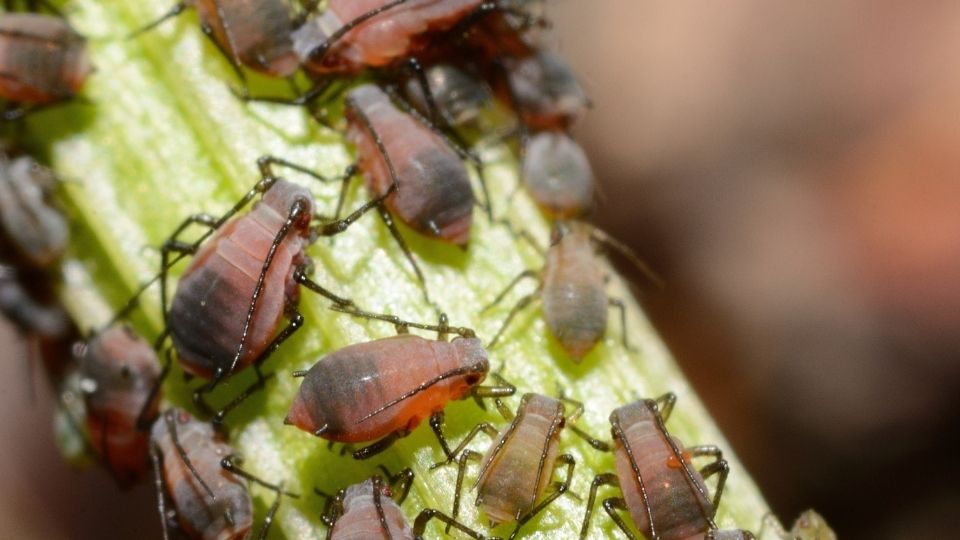
Aphids in Alfalfa
Aphids belong in the order Hemiptera and family Aphididae. Aphids are common insects in field and forage crops, with at least six kinds in Utah alfalfa. Aphids can be distinguished from other insects in alfalfa with a hand lens. In general, aphids are sof
Barley yellow dwarf virus (BYDV)
Barley yellow dwarf virus (BYDV) is found worldwide. It infects small grains like barley, wheat, oats and rice as well as many wild grass species. There are two strains of the barley yellow dwarf virus: BYDV-MAV and BYDV-PAV.
Boom Sprayer Calibration for Pesticide Applications
To protect your investment in agricultural pesticides, a boom sprayer should be calibrated at the start of the season and whenever application conditions change. Also, sprayer output should be periodically checked throughout the season to assure proper ap
Buying and Selling Corn Silage or Other High Moisture Feeds: Value the Feed not the Water
Alfalfa is the most important crop in Utah, both in terms of acreage and revenue. Although often overlooked, one of the most critical decisions made in alfalfa production is determining which variety to plant. This report summarizes dry matter (DM) yields
Characteristics of Organic Wheat Growers
A recent study was conducted with wheat growers in the western U.S. which found notable differences in the grower and farm characteristics that influence organic adoption, including older age and the lack of importance of gender and farming experience. Th
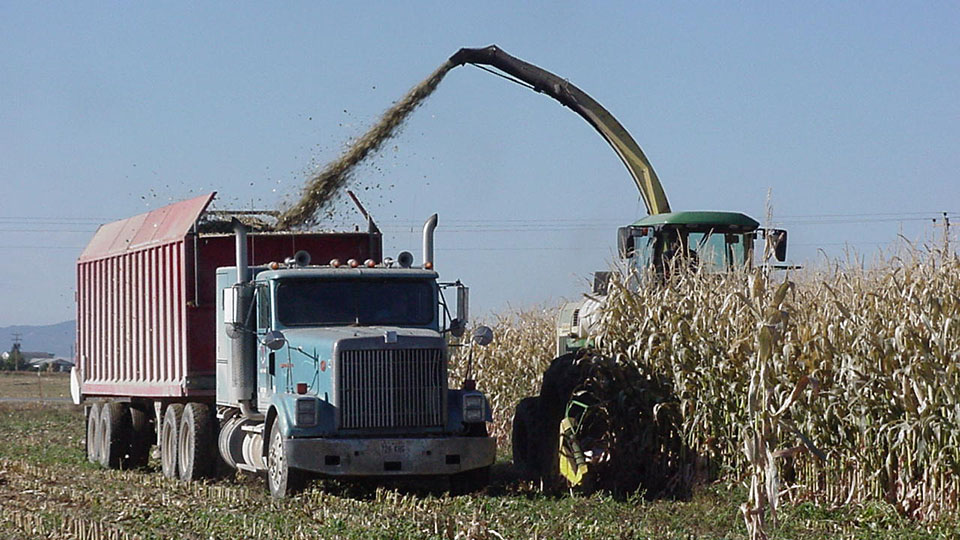
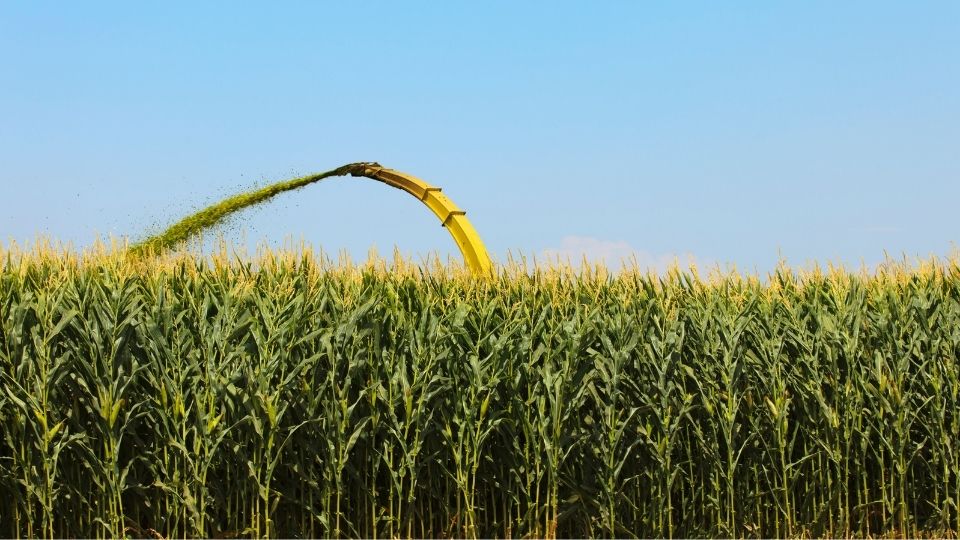
Chopping and Storing Quality Corn Silage
Properly harvested and stored, corn silage is extremely palatable, superior to other forages in energy content, a great fiber source, and relatively consistent in quality. The high palatability of corn silage encourages feed intake which contributes to hi

Comparison of Three Traps Used for Pocket Gopher Management (Thomomys Bottae) in Alfalfa Fields
Valley pocket gophers (Thomomys bottae) are a common agricultural pest in many areas of Utah, Nevada and California. Pocket gophers predominantly eat roots, although they will pull vegetation into their burrows, and eat plants immediately adjacent to thei
Considerations for Crop Rotation from Alfalfa to Corn
The importance of rotating out of a declining alfalfa stand is well established. As the alfalfa stand ages, forage yield and quality decline, while weed, insect, and disease pressures increase.

Corn Earworm
In Utah, there are typically three generations of corn earworm (CEW) each year. The first generation of adults either come from overwintering pupae (southern and central Utah) or migrate into northern Utah. The adult moth is tannish brown with a 1 1/2 inc
Corn Silage Variety Performance
This report summarizes on-farm performance of irrigated silage corn hybrids at Benson (Cache County) in 2006. The site is at 4439 ft elevation and has a long-term average of 2800 corn growing degree days (50/86° F) per year. Hybrids were seeded with a six
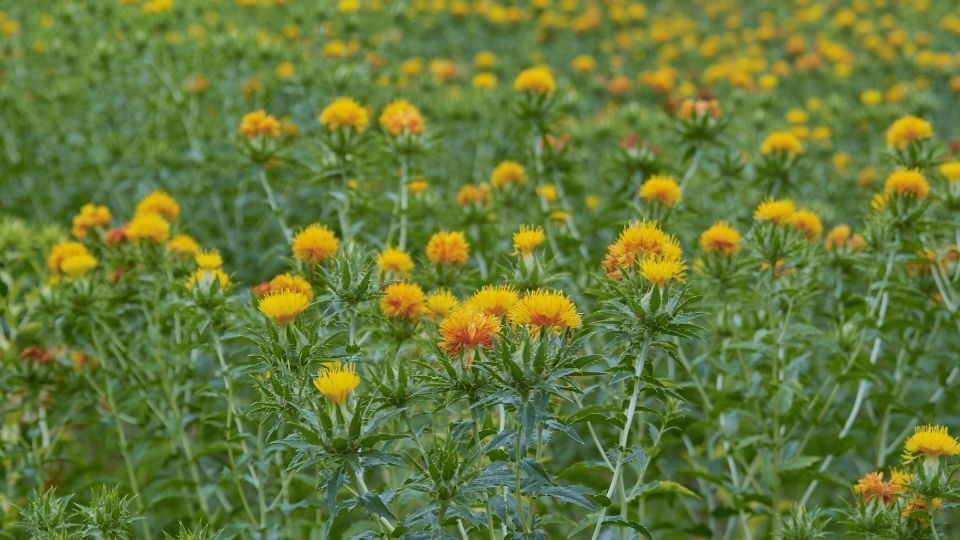
Costs and Returns for Non-Irrigated Safflower
Enterprise budgets are the building blocks of a farm or ranch. They represent estimates of income and expenses for a specific period of time using a set of production practices and inputs for that enterprise. Tables in this research is intended to be a gu

Costs and Returns for Roundup Ready™ Grain Corn
Enterprise budgets are the building blocks of a farm or ranch. They represent estimates of income and expenses for a specific period of time using a set of production practices and inputs for that enterprise. This research contains sample costs and return

Costs and Returns for Roundup Ready™ Silage Corn
Enterprise budgets are the building blocks of a farm or ranch. They represent estimates of income and expenses for a specific period of time using a set of production practices and inputs for that enterprise. This research contains sample costs and return
County-Level View of Irrigation Trends in Utah and the West
As water demand and scarcity increase simultaneously over the coming decades, water managers and growers will need to optimize water use on their irrigated lands. These challenges have been especially noticeable as the Western U.S.faces a prolonged “megad
Cover Crops for Utah
The purpose of this fact sheet is to provide the current state of knowledge on cover crop management for Utah based on USU research and local grower experience.

Crop Advisor Approaches to Soil Health Advising and Opportunities for Improvement
The report highlights that crop advisors in Utah and Idaho are increasingly addressing soil health, though barriers like cost, lack of localized information, and disagreements about soil health practices persist. Advisors from the NRCS are the most active

Crop Revenue Coverage 2007 Commodity Insurance Fact Sheet
Crop Revenue Coverage(CRC), provides revenue protection against a yield loss, a price decline, or a combination of both. CRC is available for these crop and counties Beaver, Box Elder, Cache, Carbon, Davis, Duchesne, Emery, Garfield, Iron, Juab, Millard,
Defense Against Drought
Utah’s climate can often be harsh and unpredictable. As the nation’s second driest state, Utah is commonly subject to droughts. Extensive statewide droughts have often lasted 5 to 6 years. It is imperative that farmers are well prepared to defend against
Deficit Irrigation of Pastures
Deficit irrigation is any irrigation level that does not meet the crop’s full evapotranspiration (ET) demand, meaning evaporation from plant and soil surface and transpiration through plant growth.
Diagnostic Testing for Nitrogen Soil Fertility
Environmental concerns over nitrate contamination of ground water, and the desire of land managers to increase the efficiency of their fertilizer investment, can both be satisfied more completely through diagnostic testing for nitrogen (N) soil fertility.
Downy Mildew of Alfalfa
Downy mildew is an obligate parasite. Even though they look like fungi they are not. They belong to the Oomycota and are more closely related to algae than true fungi. The most common alfalfa downy mildew species in the USA is Peronospora trifoliorum. In
Drought Tolerance Guide for Alfalfa in Utah
Crop variety selection is one of the most important choices on the farm. Crop genetics determine a significant portion of the yield potential and resource use efficiency. Crop types and genetics that use water more efficiently will become increasingly imp
Drought Tolerance Guide for Corn in Utah
Crop variety selection is one of the most important choices on the farm. Crop genetics determine a significant portion of the yield potential and resource use efficiency. Crop types and genetics that use water more efficiently will become increasingly imp
Drought Tolerance Guide for Small Grains in Utah
Crop variety selection is one of the most important choices on the farm. Crop genetics determine a significant portion of the yield potential and resource use efficiency.
Dwarf Bunt in Winter Wheat
The disease first appeared in Utah in the early 1930s in Cache County near the city of Paradise. The disease was soon found in Box Elder County near Hansel Valley. The outbreak of dwarf bunt became so severe that it affected other crops, such as barley.
Easy Calibration for Backpack and Canister (Handheld) Sprayers
If sprayers are not properly calibrated, it can result in over or under-application of chemicals, causing damage, reduced pest control, and potential safety concerns. Making the effort to properly mix chemicals and calibrate sprayers can save money and in
Easy Calibration for Boom Sprayers
Making the effort to properly mix chemicals and calibrate sprayers can save money and headaches in the long run. This fact sheet provides simple guidelines for calibrating boom sprayers.

Economic Feasibility of Solar Photovoltaic Irrigation Systems
The Great Basin is primarily located in Nevada, western Utah, and small sections of southern Oregon and Idaho. The Great Basin is noted for its arid conditions and high percentage of publically owned land. The potential for solar energy generation in the
Energy Conservation with Irrigation Water Management
Irrigators in Utah experienced rapidly increasing energy costs from the mid 1970s to the late 1980s. These costs remain relatively high. Those who are pumping from deep wells are particularly interested in ways to cut back on energy use without doing away

Evapotranspiration and Precipitation Data for Calculating Irrigation Water Requirements in Utah
In this fact sheet, we calculated average reference evapotranspiration and precipitation data for multiple locations in Utah, USA. To accomplish this, we collected the data from the Utah Climate Center and compiled it to show an average of 20 years of dat
Fertigation Facts
The purpose of this fact sheet is to provide general information on forms of fertigation for primary plant nutrient, fertigation timing, and fertigation economics.
Grass Pasture Response to Water and Nitrogen
The objective of this project is to study the response of pasture grass varieties to weather, irrigation, and fertility in a field experimental plot at a high elevation. The water variable is accomplished with a line source sprinkler irrigation system. Tw
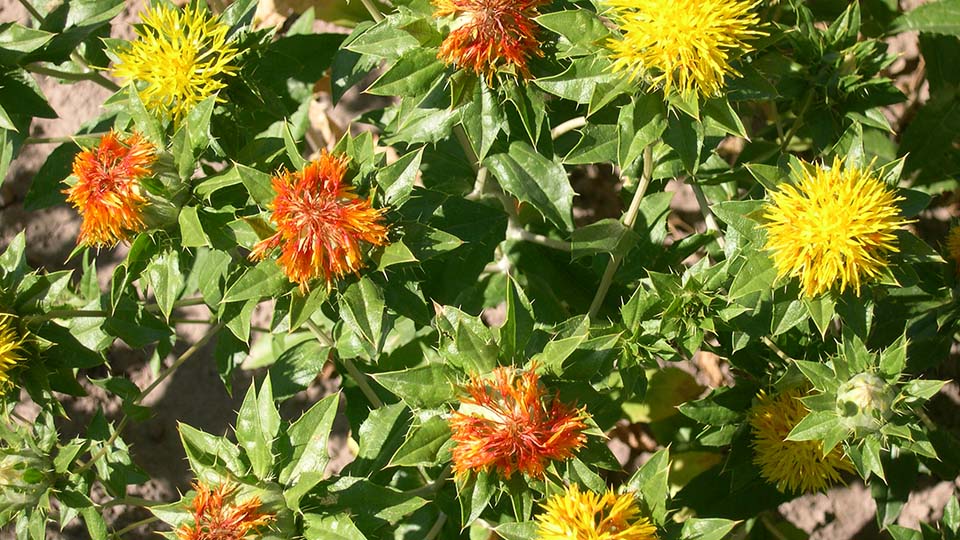
Growing Safflower in Utah
Northern Utah growers produced approximately 23 million pounds of safflower second only to California in U.S. production.
Guide to Irrigation Sprinkler Packages for Pivots and Laterals
Guide to Irrigation Sprinkler Packages for Pivots and Laterals
Guide to Pivot Track Management
Center pivot irrigation systems are the most popular form of irrigation in the western United States. A significant problem with center pivots is wheel track rutting. Deep wheel tracks can cause overirrigation because the pivot moves slower than intended
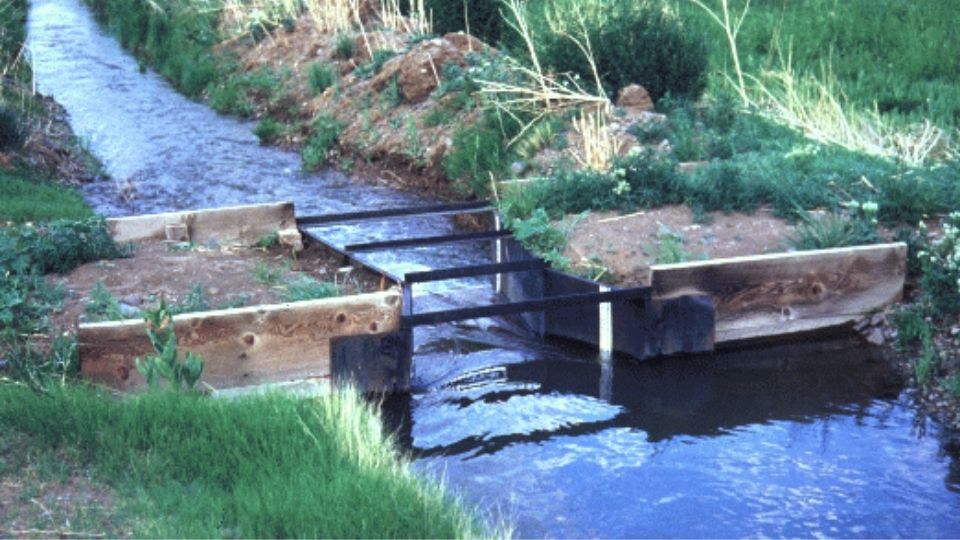
How Good is Your Water Measurement?
Accurate water measurement is essential to maintaining equity of water delivery within an irrigation company or water districts. Good management of our scarce water resource is dependent upon quantifying supplies and uses with accurate measurement techniq