Grass Pasture Response to Water and Nitrogen
Line Source Sprinkler Experiment at High Elevation Rich County Site
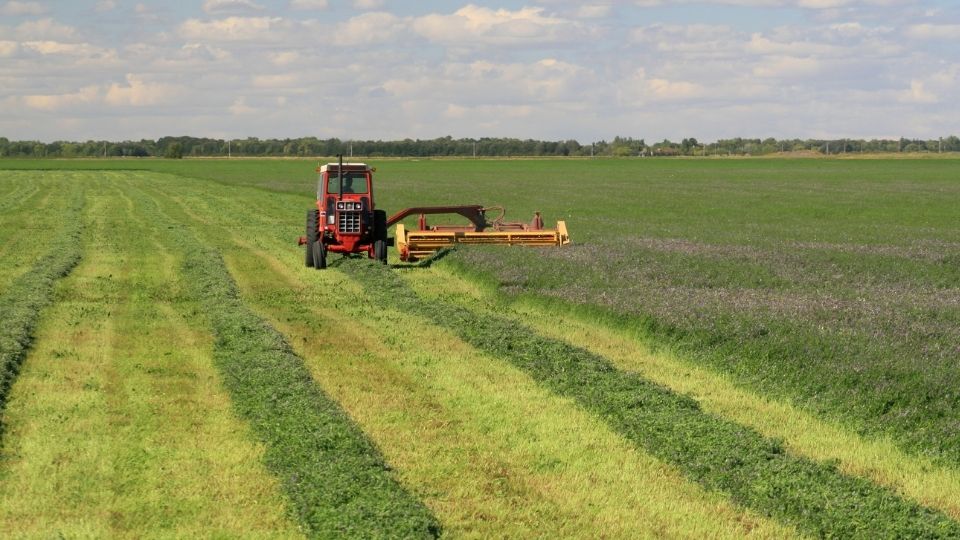
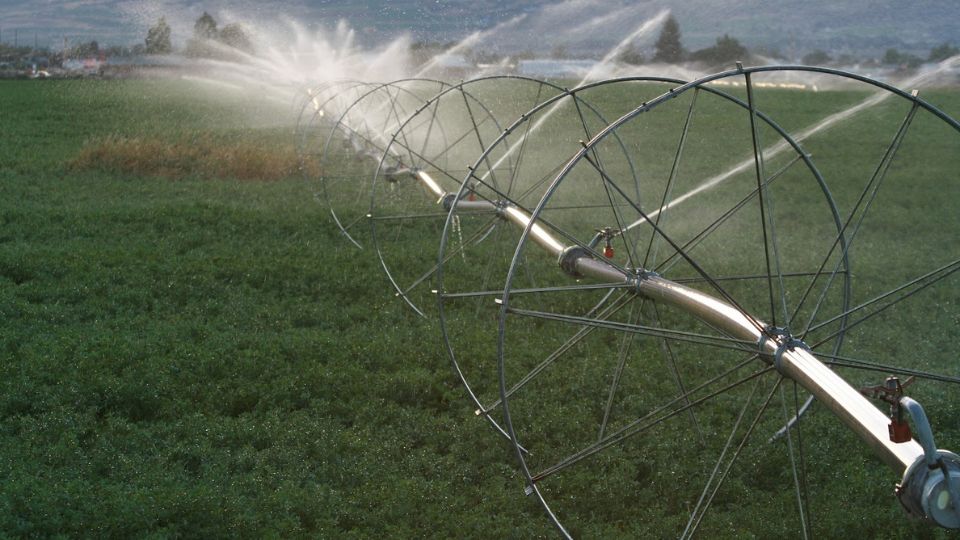
The objective of this project is to study the response of pasture grass varieties to weather, irrigation and fertility in a field experimental plot at a high elevation. The water variable is accomplished with a line source sprinkler irrigation system. Two nitrogen fertility levels were imposed on two of the grass varieties (Regar and NewHy).
Site and Experiment Description
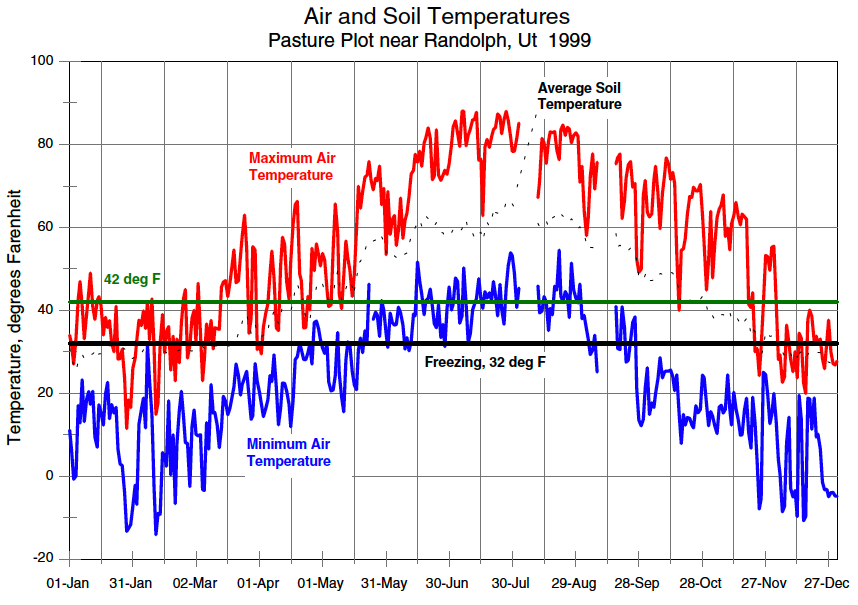
The field plots are at a high elevation (6300 ft.) site north of Randolph, Utah. The site has cold winters with maximum daily air temperatures well below freezing with minimum temperatures dropping well below zero degrees Fahrenheit (Figure 1). Historically, freezing temperatures have been experienced in all months. Day-night temperature swings of 50 degrees Fahrenheit are possible in the summer with high temperatures in the 80's and lows in the 30's. The soil is a Bockston Loam, consisting of very deep, well-drained, moderately permeable soil. Soil analysis indicated low nitrogen and low phosphorus levels (June 1996).
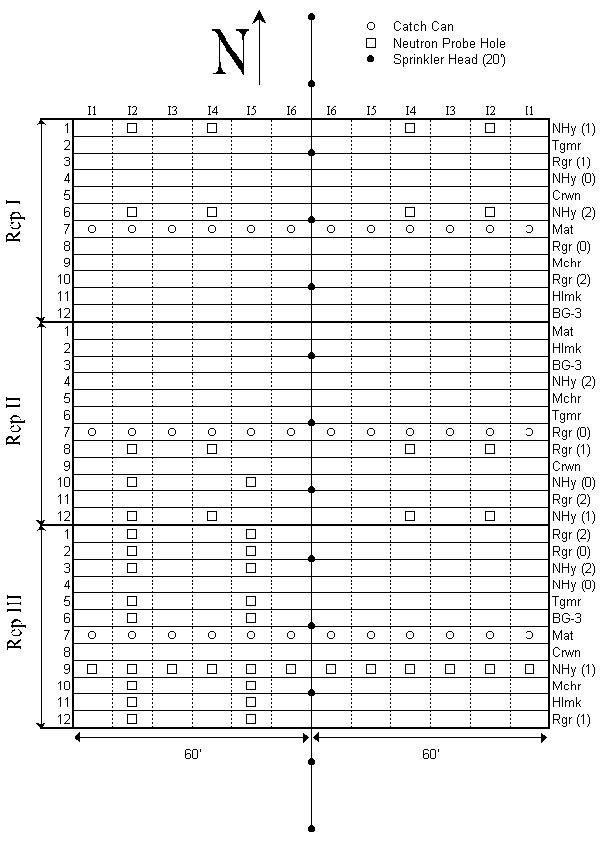
Eight grass varieties (Regar Meadow Brome, Halmark Orchardgrass, Manchar Smooth Brome, Matua Prairie Brome, NewHy, Tegmar Intermediate Wheatgrass, Crown Blend, and BG- 3 Perennial Rye mixes) were planted 28 July 1997. Regar and NewHy were duplicated with 0 and 2 times nitrogen treatment making 12 treatments with three replications (see Figure 2 for plot plan). Each plot is 5 feet wide by 140 feet long. The plots were uniformly irrigated two or three times per week for establishment. A good to excellent stand of all varieties was evident by September 1997. Irrigations were applied every 7-14 days beginning June 11, 1998, and continued through the growing season. Regular irrigation promoted uniform root development across the plot and evened out fertility variations.
The grass plots generally began to “green up” by mid April 1999. Fertilizer was applied on May 12 with a Gandy spreader. Phosphate (0-45-0) was applied at 162 lbs/acre perpendicular to the variety plots. The 1-N treatment of all grass varieties were fertilized with 103 lbs/acre nitrogen (34-0-0). Regar and NewHy 2-N plots received 206 lbs/acre and no nitrogen was added to the 0-N plots.
Neutron probe access tubes were installed in the various treatments as shown in Figure 2. Neutron probe readings in late July 1999 indicate root zone soil water depletion in the 24 to 30 inch depths for most varieties.
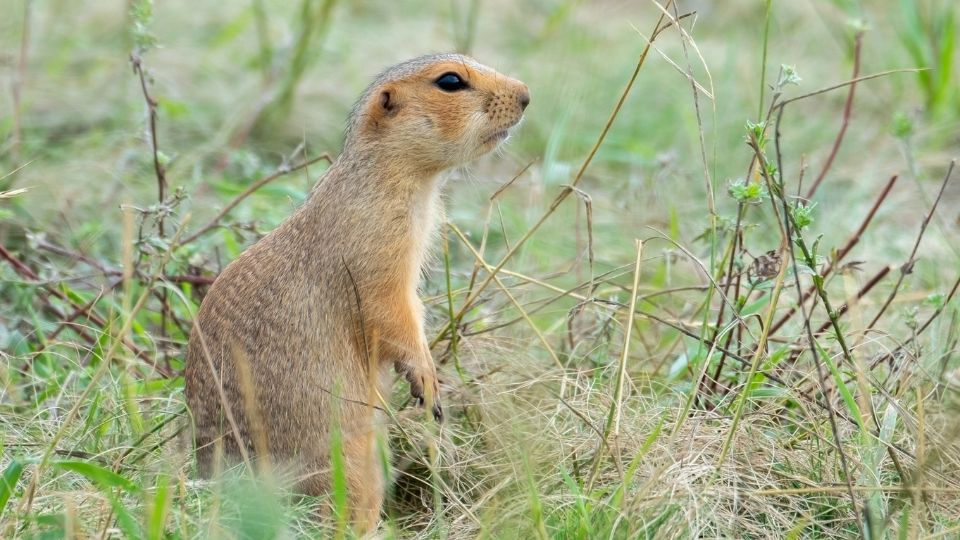
A serious ground squirrel infestation, combined with badger activity, influenced subplot harvest variability.
Field Observations
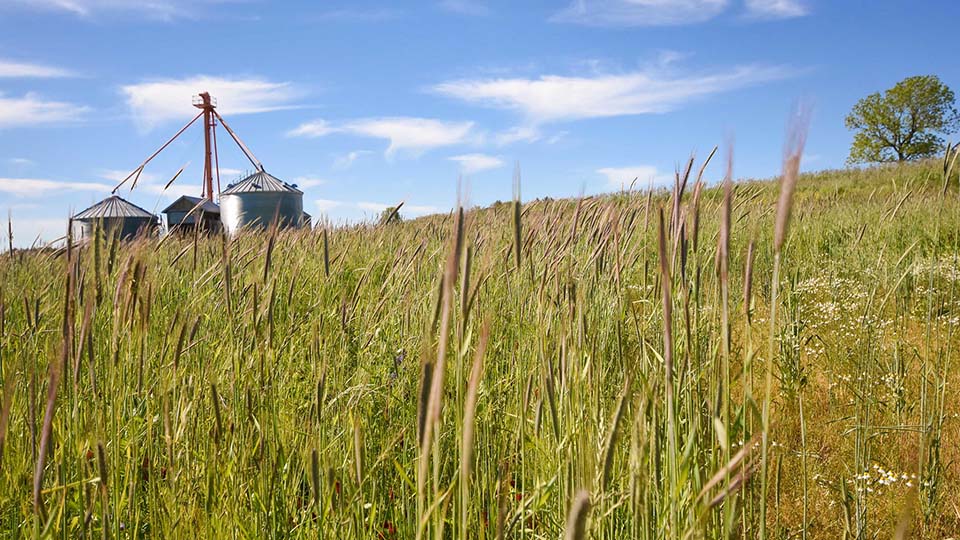
A visual appraisal rated all the varieties 5.5 or higher on vigor, stand density and color (scale 0-10) in early September 1997 after establishment. By early June 1998 the grass height was 18 inches or more for all plots except the Perennial Ryegrass and Matua Brome. The Matua did not survive the winter very well. Many of the Matua Brome plants came from seed in 1998 rather than as plants surviving the winter. By late June 1998 all the varieties, except the Perennial Rye and Tegmar Intermediate Wheatgrass, had fully emerged seed heads. Similar conditions were also observed by late June 1999.
Soil Water Measurements
Neutron probe readings of soil water content at 6 inch depth increments were taken weekly beginning in early April 1999. Due to the abundant rain during April and May (3.7 inches) the first line source irrigation was May 25 with a second on June 11. As a result, Figure 3 shows that the soil water content was similar in both “wet” and “dry” areas of the plot until just prior to the first clipping on June 10, 1999.
The occurrence and depth of individual rain and irrigation events are also shown in Figure 3 for the period April 1 - mid October, 1999. The line source irrigation variation became evident in late May when soil water content in the “dry” (I2) treatment (Figure 4) dropped below 50% of available water in the 2 ½ foot root zone. Whereas, the soil water content in a “wet” (I5) treatment was maintained well above 50% depletion throughout the season (Figure 3).
Irrigation
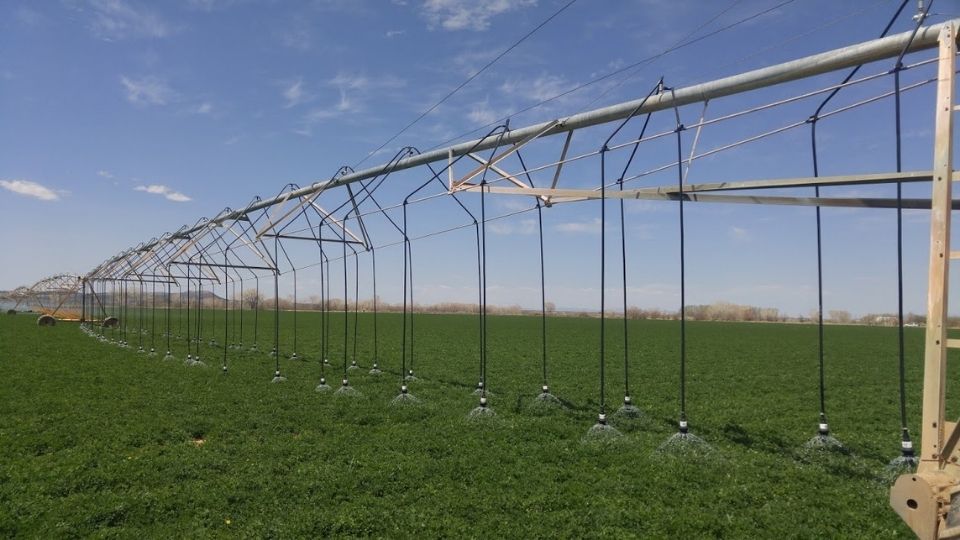
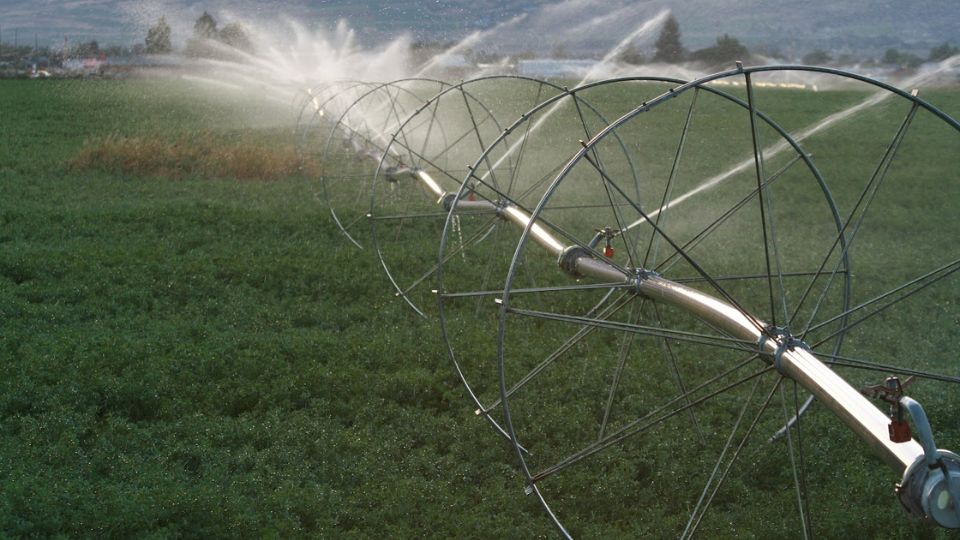
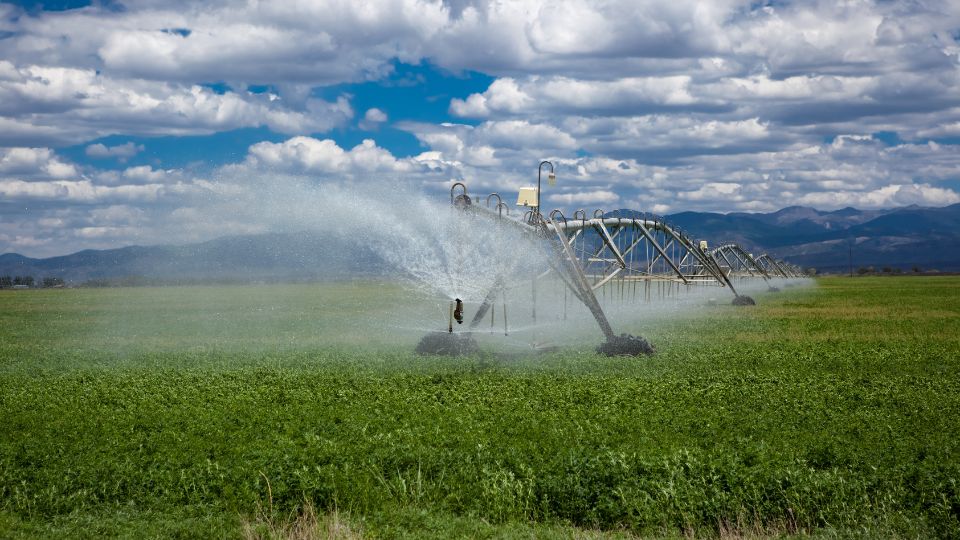
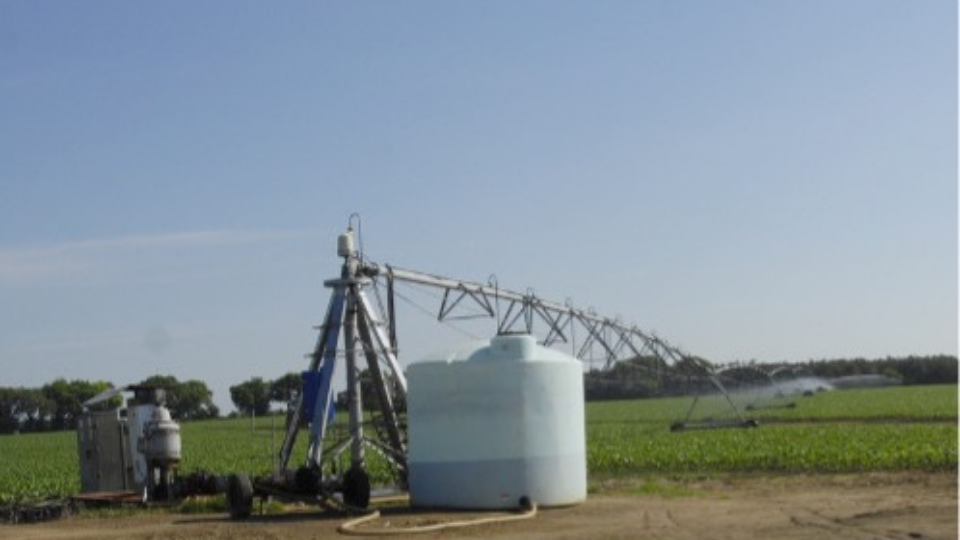
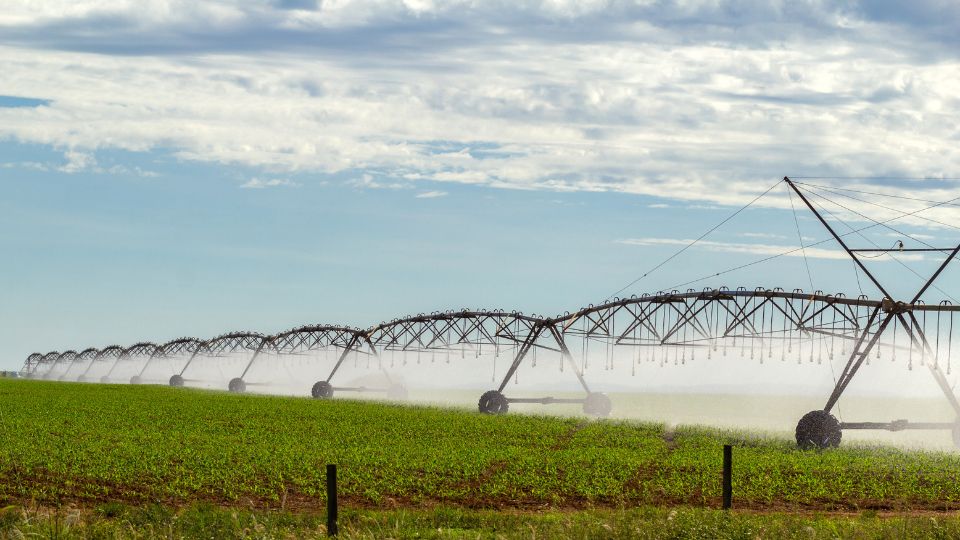
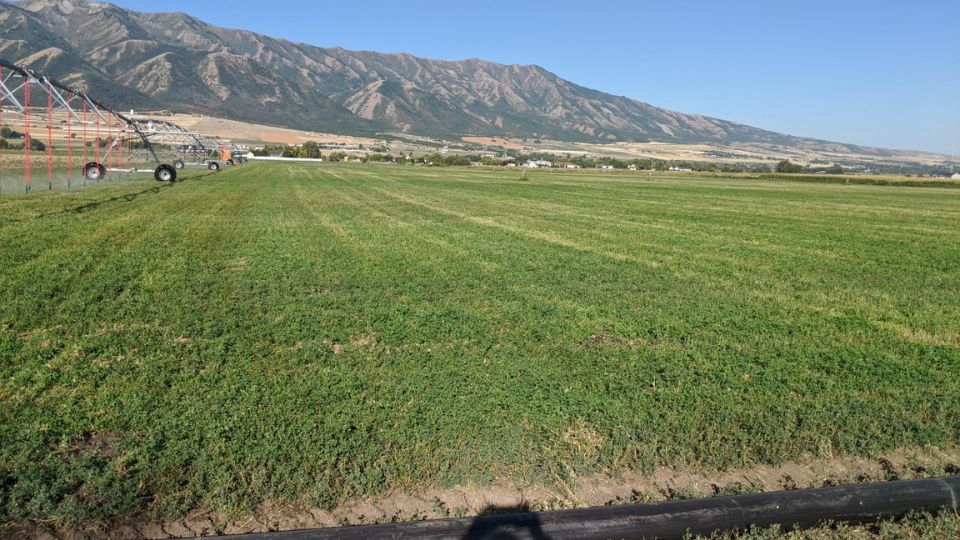
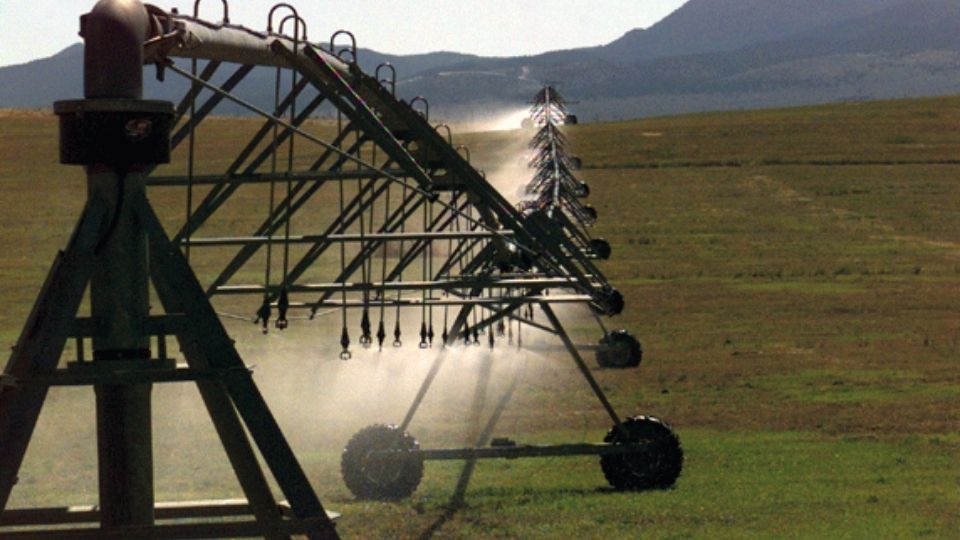
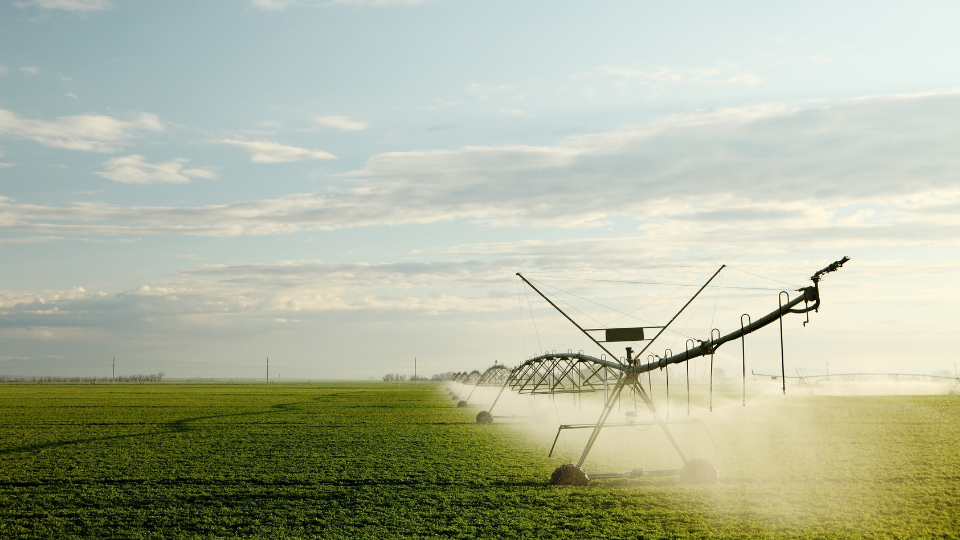
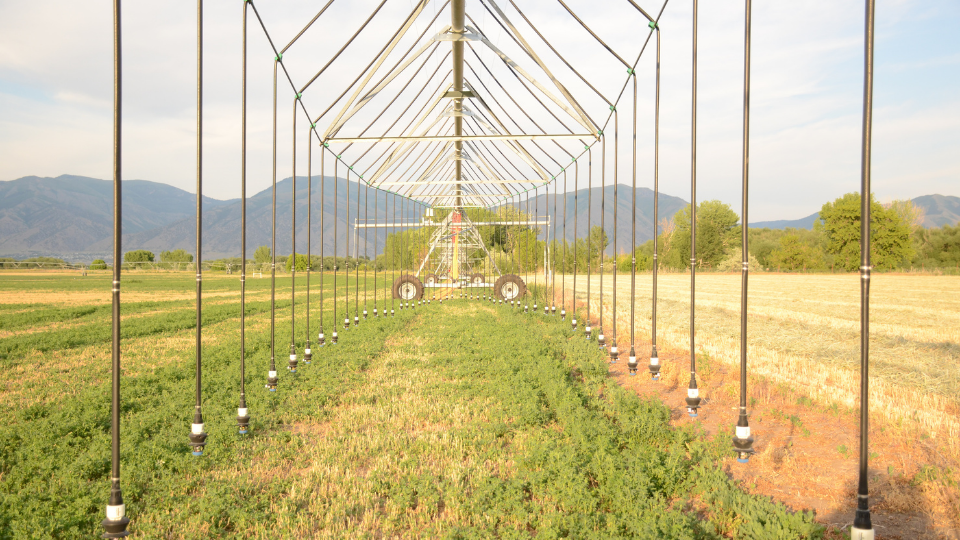
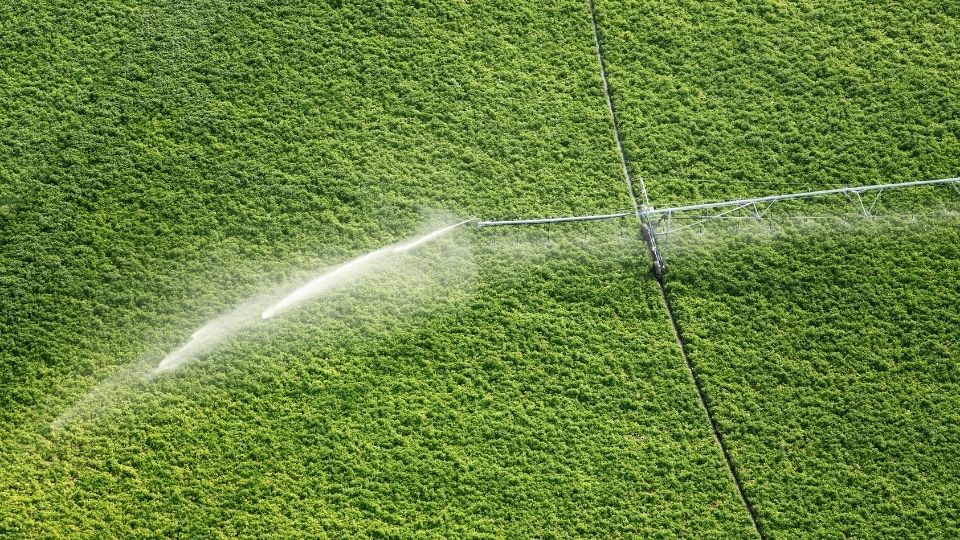
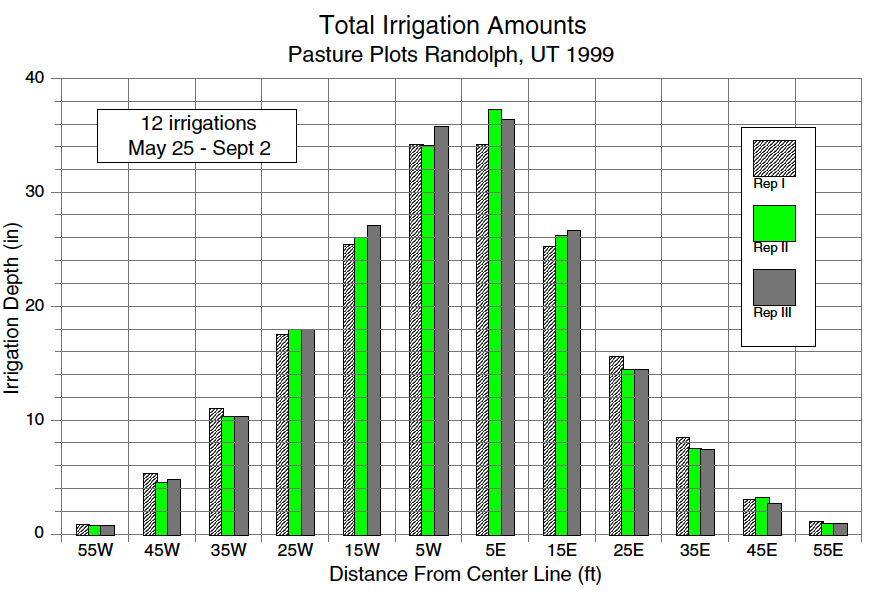
The line source consisted of a single line of closely spaced sprinklers, 20 ft apart, from south to north through the center of the plots (Figure 2). The irrigation water was collected in cans spaced at 10 ft intervals across the center of each replication. Due to a cool, wet spring only one line source irrigation occurred (May 25) prior to the first harvest. Twelve irrigations applied approximately 35 inches of water 5 feet from the line varying down to about 1 inch at 55 feet from the center (see Figure 5). Irrigations occurred at approximately 7 day intervals beginning June 11. Irrigation amounts vary from 0.8 inches (I1 - West average of three catch cans) to 36 inches (I6 - East) as shown in Figure 5. The variation is an almost linear increase from dry to wet on each side of the plots. This variation is also reflected in root zone soil water content as shown in Figure 3 and Figure 4. An additional 8 inches of rainfall occurred from April 1 through September 15, 1999.
Harvest Samples 1999
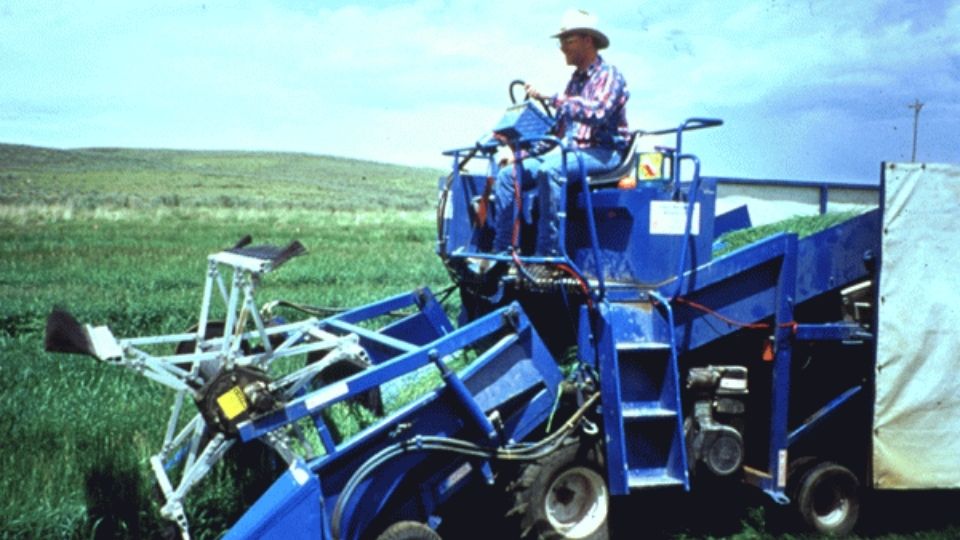
The first clipping was taken on June 10, 1999. Plot subsamples (2 ft by 2 ft) were hand clipped in all variety and fertility treatments at 15 feet west and 15 feet east of the center making 72 samples total. A small plot harvester was used to clean up the plots. Water level treatment subplot samples were not taken due to the lack of an obvious line source effect resulting from the abundant rainfall. Yields varied from 0.3 ton/acre (Crown Blend Perennial Rye) to 2.6 ton/acre (Regar Meadow Brome - 2 x nitrogen) as given in Table 1. Nutrient analysis (NIR) for protein, ADF, NDF, RFV and TDN are given in Table 1. The protein content varied from about 14% (Regar 0-N) to 25% (BG-3 Perennial Rye and NewHy 2-N) and TDN ranged from about 56% (Regar 0-N) to 68% (BG-3). Both Perennial Ryegrasses (Crown Blend and BG-3) had relative feed values (RFV) over 160 while Regar 0-N was lowest at 105. Protein, TDN and RFV increased with additional amounts of nitrogen (Regar and NewHy).
Yield
Dry matter yields (Table 1) at well watered plots were generally greater for the first cutting varying from 0.3 to 2.6 ton/acre than for the second cutting (1.1 ton/acre to 2.0 ton/acre), and greater for the second than the third (0.6 to 1.5 ton/acre).
The two exceptions were BG-3 and Crown Blend Perennial Ryegrasses, both of which had increases in yield from first to second cuttings. The yield of BG-3 also increased in the third cutting. This may be due to variability within the plot. These varieties may not have been growing vigorously early due to cool spring temperatures. There was also a significant difference in second and third cutting yields across the different irrigation levels, as expected.
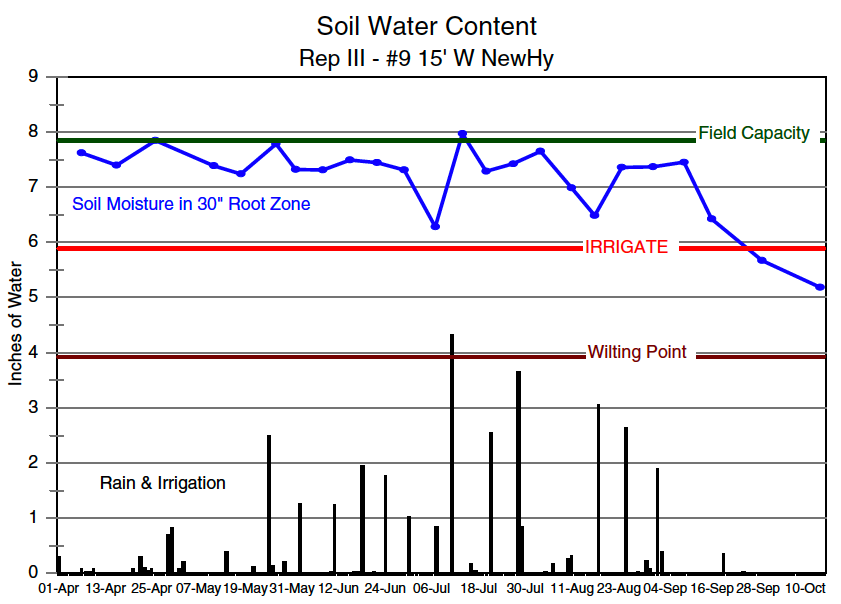
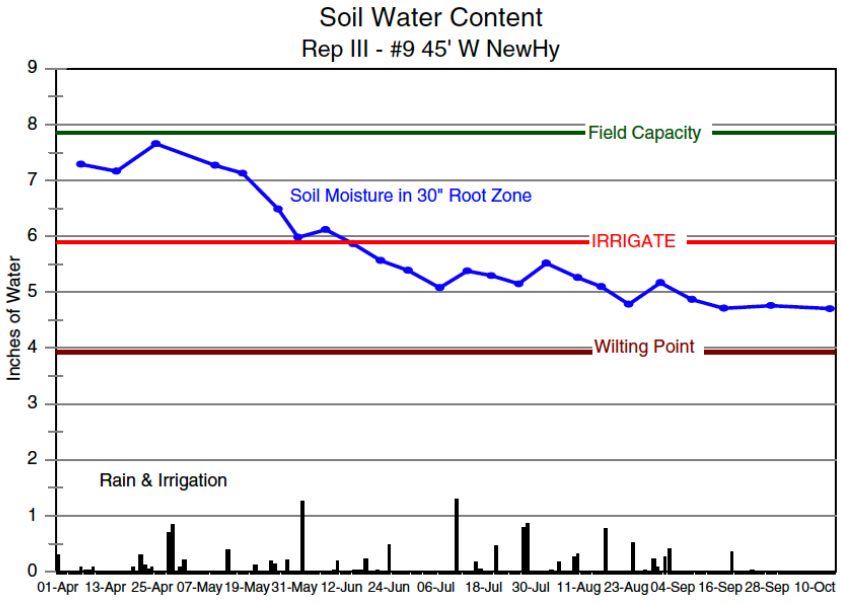
Table 1. Summary of Nutrient Analysis (NIR) & Dry Matter Yield for Irrigated Grass Pasture Plot near Randolph, Utah 1999 (Note: Yields shown are from the I5 water levels).
| Cutting Date | Protein | ADF | NDF | RFV | TDN | Yielf ton/acre | Protein lb/acre |
|---|---|---|---|---|---|---|---|
| First Cutting - 10 June 1999 | |||||||
| Regar Meadow Brome (2x Fertilizer) | 22.12 | 24.02 | 54.87 | 119.16 | 63.68 | 2.62 | 1157 |
| Regar Meadow Brome | 19.69 | 26.71 | 56.83 | 111.65 | 61.07 | 2.51 | 987 |
| Regar Meadow Brome (No Fertilizer) | 13.68 | 29.37 | 58.56 | 105.26 | 55.79 | 1.88 | 514 |
| NewHy (2x Fertilizer) | 25.63 | 20.37 | 52.19 | 130.45 | 67.39 | 1.83 | 936 |
| NewHy | 24.41 | 21.75 | 52.66 | 127.26 | 66.06 | 1.62 | 789 |
| NewHy (No Fertilizer) | 16.96 | 25.37 | 58.08 | 110.82 | 59.42 | 1.12 | 380 |
| Halmark Orchardgrass | 21.73 | 23.98 | 53.46 | 122.40 | 63.40 | 1.80 | 780 |
| Manchar Smooth Brome | 23.39 | 23.86 | 53.83 | 121.85 | 64.68 | 2.11 | 985 |
| Tegmar Intermediate Wheatgrass | 22.59 | 22.45 | 51.33 | 129.52 | 64.50 | 1.57 | 709 |
| BG-3 Perennial Ryegrass | 25.43 | 18.10 | 44.63 | 160.12 | 67.90 | 0.44 | 226 |
| Crown Blend Perennial Ryegrass | 23.69 | 18.51 | 43.19 | 164.96 | 66.48 | 0.27 | 128 |
| Matua Prairie Brome | 20.43 | 24.94 | 52.19 | 124.69 | 62.14 | 1.41 | 577 |
| Second Cutting - 15 July 1999 | |||||||
| Regar Meadow Brome (2x Fertilizer) | 17.90 | 29.43 | 60.18 | 102.02 | 58.93 | 1.95 | 699 |
| Regar Meadow Brome | 15.20 | 31.98 | 61.79 | 96.62 | 56.16 | 1.77 | 538 |
| Regar Meadow Brome (No Fertilizer) | 12.06 | 34.15 | 61.30 | 94.75 | 53.16 | 1.36 | 328 |
| NewHy (2x Fertilizer) | 22.70 | 24.77 | 56.70 | 114.39 | 63.89 | 1.74 | 790 |
| NewHy | 18.96 | 27.56 | 59.38 | 106.13 | 60.27 | 1.67 | 632 |
| NewHy (No Fertilizer) | 15.11 | 31.18 | 59.76 | 100.94 | 56.32 | 1.07 | 322 |
| Halmark Orchardgrass | 17.25 | 29.77 | 60.31 | 101.42 | 58.34 | 1.70 | 587 |
| Manchar Smooth Brome | 19.74 | 27.11 | 56.05 | 112.89 | 60.98 | 1.05 | 416 |
| Tegmar Intermediate Wheatgrass | 15.94 | 30.91 | 61.80 | 97.91 | 57.02 | 2.02 | 645 |
| BG-3 Perennial Ryegrass | 19.00 | 30.91 | 51.62 | 124.11 | 60.55 | 1.21 | 460 |
| Crown Blend Perennial Ryegrass | 18.02 | 28.21 | 51.96 | 121.25 | 59.37 | 1.39 | 502 |
| Matua Prairie Brome | 15.60 | 30.66 | 55.70 | 109.38 | 56.84 | 1.35 | 422 |
| Third Cutting - 14 September 1999 | |||||||
| Regar Meadow Brome (2x Fertilizer) | 14.17 | 27.67 | 53.49 | 117.33 | 56.65 | 1.51 | 428 |
| Regar Meadow Brome | 12.79 | 28.48 | 54.70 | 113.58 | 55.37 | 0.94 | 239 |
| Regar Meadow Brome (No Fertilizer) | 11.95 | 29.50 | 52.17 | 118.04 | 54.45 | 0.68 | 163 |
| NewHy (2x Fertilizer) | 20.67 | 21.77 | 52.48 | 127.78 | 63.26 | 0.93 | 386 |
| NewHy | 17.24 | 23.04 | 49.50 | 133.40 | 60.31 | 0.61 | 209 |
| NewHy (No Fertilizer) | 15.78 | 23.30 | 50.27 | 131.90 | 59.15 | 0.90 | 284 |
| Halmark Orchardgrass | 12.85 | 25.72 | 50.49 | 126.89 | 56.24 | 1.64 | 422 |
| Manchar Smooth Brome | 17.58 | 22.62 | 44.99 | 147.60 | 60.69 | 0.54 | 190 |
| Tegmar Intermediate Wheatgrass | 15.23 | 25.33 | 49.51 | 130.13 | 58.14 | 0.68 | 207 |
| BG-3 Perennial Ryegrass | 13.29 | 24.58 | 42.91 | 151.31 | 56.90 | 1.33 | 355 |
| Crown Blend Perennial Ryegrass | 13.69 | 25.71 | 44.93 | 143.43 | 56.87 | 1.10 | 300 |
| Matua Prairie Brome | 13.83 | 25.08 | 41.17 | 158.37 | 57.16 | 0.85 | 236 |
| Three Cutting Yield Weighted Average of Nutrients and Total Dry Matter Yield | |||||||
| Regar Meadow Brome (2x Fertilizer) | 18.79 | 26.66 | 56.23 | 113.20 | 60.41 | 6.08 | 2283 |
| Regar Meadow Brome | 16.93 | 28.82 | 58.13 | 106.89 | 58.38 | 5.21 | 1764 |
| Regar Meadow Brome (No Fertilizer) | 12.82 | 31.05 | 58.40 | 103.84 | 54.47 | 3.92 | 1005 |
| NewHy (2x Fertilizer) | 23.47 | 22.36 | 53.99 | 123.68 | 64.85 | 4.50 | 2112 |
| NewHy | 20.95 | 24.44 | 55.05 | 119.16 | 62.21 | 3.89 | 1630 |
| NewHy (No Fertilizer) | 15.98 | 26.77 | 56.38 | 113.55 | 58.30 | 3.09 | 986 |
| Halmark Orchardgrass | 17.41 | 26.45 | 54.78 | 116.88 | 59.33 | 5.14 | 1789 |
| Manchar Smooth Brome | 21.50 | 24.60 | 53.17 | 123.06 | 62.12 | 3.70 | 1591 |
| Tegmar Intermediate Wheatgrass | 18.27 | 26.91 | 56.00 | 114.64 | 59.89 | 4.27 | 1562 |
| BG-3 Perennial Ryegrass | 17.41 | 24.49 | 46.69 | 141.61 | 61.78 | 2.99 | 1041 |
| Crown Blend Perennial Ryegrass | 16.85 | 26.26 | 48.31 | 134.34 | 60.91 | 2.76 | 930 |
| Matua Prairie Brome | 17.07 | 27.11 | 50.90 | 126.90 | 58.71 | 3.62 | 1236 |
Note: Protein, %; ADF, Acid Detergent Fiber %; NDF, Neutral Detergent Fiber %; RFV, Relative Feed Value; TDN, Total Digestible Average of 3 replications for each (except 4 for NewHy & 2 for NewHy-No Fertilizer)
Seasonal average protein varied from 12.8% to 23.5% and TDN varied from 54.5% to 65%, respectively, for Regar 0-N and NewHy 2-N. The Perennial Ryegrass had the highest RFV (134 and 142), whereas, Regar 0-N (RFV = 104), and Regar 1-N (RFV = 107) were the lowest.
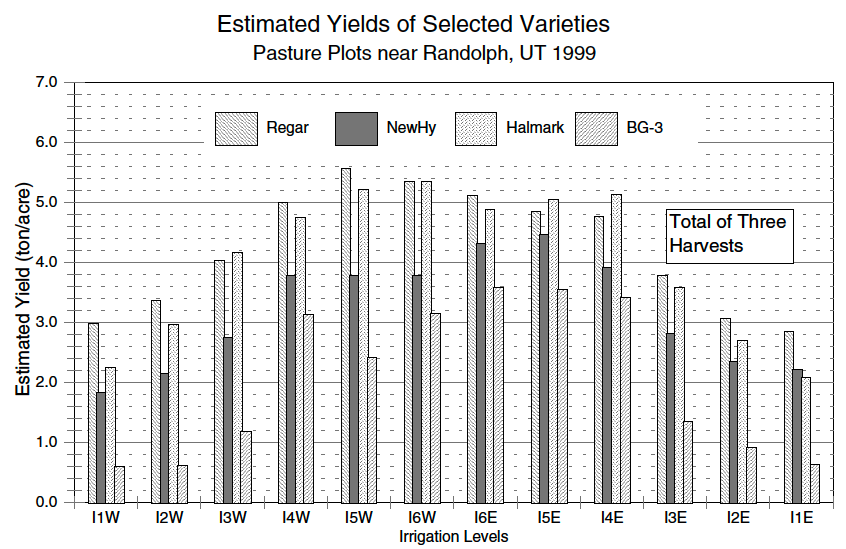
Figure 6 shows that yields increased in proportion with the increase in the irrigation amounts. The average seasonal dry matter yield of the four varieties in the well watered plots (I6 East) was nearly double the yield of the dry plots (I1 West).
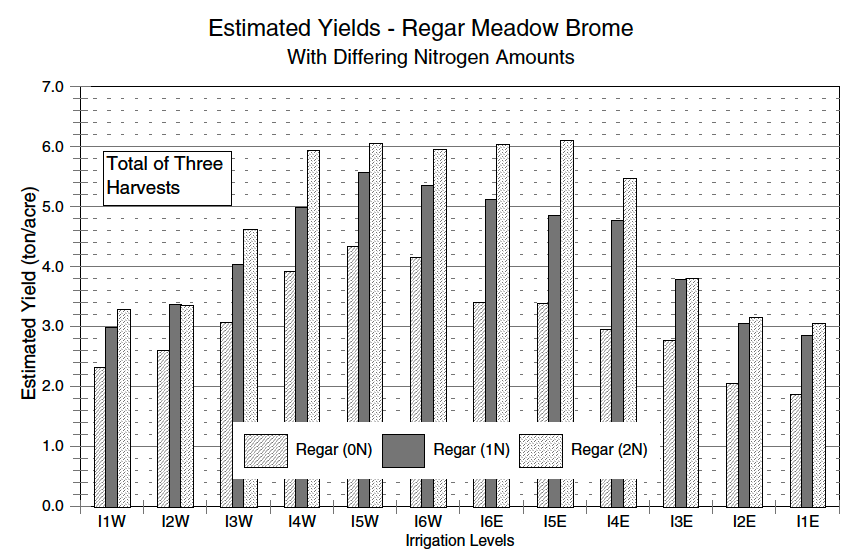
This relationship can also be seen in the effect of the increased nitrogen levels applied to the Regar Meadow Brome, with an obvious difference between the three treatments (Figure 7). The total dry matter yield production of 1-N levels show a 26% and 35% increase in yields compared to 0-N levels for NewHy and Regar, respectively (Table 1). The resulting increase in the 2-N treatment over the 1-N level is 16% and 14% for treatment. NewHy and Regar. Demonstrating a greater incremental increase in yield for the 1-N treatment.
Published June 2000
Utah State University Extension
Peer-reviewed fact sheet
Authors
Robert W. Hill, Biological & Irrigation Engineering; Robert Newhall, Plant, Soils & Biometeorology; Scott Williams, Extension Agent - Rich County; and Brian Andrew and Sheridan Nicholas, BIE Graduate Research Assistants
Related Research


