Irrigation Water Quality Sampling Guide
Why Sample?
The suitability of a water source for irrigation depends on the water quality, and some sources may be altogether unsuitable for practical use. Additional considerations include the plant species being irrigated, the end use of the plants, the irrigation system type, the texture and chemical quality of the soil, and the quantity of precipitation. Some water may require treatment or special management before using it for irrigation. Assessing irrigation water quality includes testing for chemical and biological constituents, which begins with proper water sampling.
What to Sample/Test?
Salinity
In Utah, the most common concerns for irrigation water quality relate to salinity. Excessive salt concentrations from irrigation water can build up in the soil and impair the ability of plants to extract water. Excessive salt can also be toxic to plants when in the soil or on plant leaves (Hoffman & Shalhevet, 2007). The total salt concentration is measured in terms of electrical conductivity (EC) because salts are electrolytes (they conduct electricity when dissolved in water). There are many kinds of salt ions in the soil, and EC does not differentiate among these. In some cases, salt accumulation can be managed by leaching by applying additional irrigation water. Most samples of irrigation water processed by the Utah State University Analytical Laboratories (USUAL) in the past several years have had relatively low EC (2 dS/m or less), though some have been 20 dS/m or greater (Figure 1).
Sodium
Excessive sodium in relation to other positive ions can reduce water infiltration into the soil. This is measured using the sodium adsorption ratio (SAR), which is the ratio of sodium relative to calcium and magnesium. The impact of sodium on water infiltration also depends upon irrigation water EC and pH (Suarez, 2012). Most of the irrigation water samples processed by the USUAL from 2019–2022 had SAR values of less than 4, though some were much greater (Figure 1).
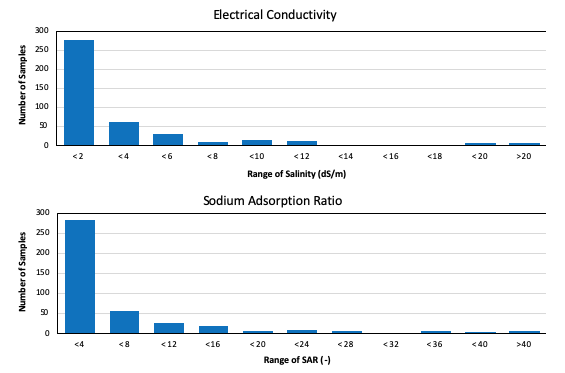
Figure 1. Electrical Conductivities and Sodium Adsorption Ratios of Irrigation Water Samples Processed by the Utah State University Analytical Laboratories in 2019–2022
Trace Element Toxicities
In addition to salinity, trace elements can also be phytotoxic when they accumulate in the soil (Chelinski et al., 2022). In irrigation water, boron is a common element of concern. In some cases, the guidelines for other elements are based on the U.S. Environmental Protection Agency (EPA) guidelines for potable water; however, the EPA guidelines are often more stringent than necessary for irrigation (Suarez, 2012; Table 1). Irrigation water should be tested for trace elements when a new water source is first developed or if there is a reason for concern. For example, if the source water is at risk of pollution from stormwater.
Table 1. Additional Elements of Concern Beyond Salinity and Boron for Irrigation Water Quality
|
Arsenic (As) |
Cobalt (Co) |
Lithium (Li)* |
Selenium (Se) |
|
Beryllium (Be)* |
Copper (Cu) |
Manganese (Mn) |
Vanadium (V)* |
|
Cadmium (Cd) |
Fluoride (F)* |
Molybdenum (Mb) |
Zinc (Zn) |
|
Chromium (Cr) |
Lead (Pb) |
Nickle (Ni) |
|
|
Source: Suarez (2012). |
|||
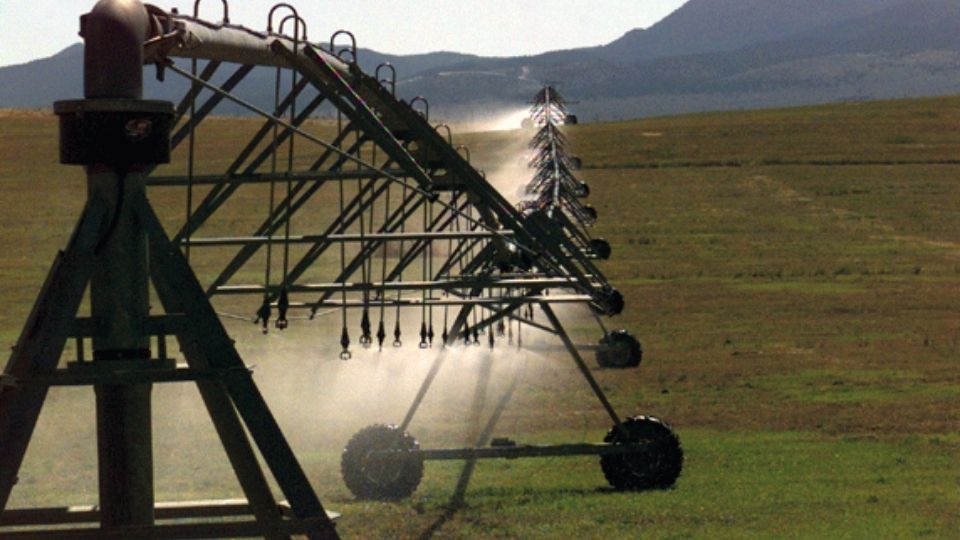
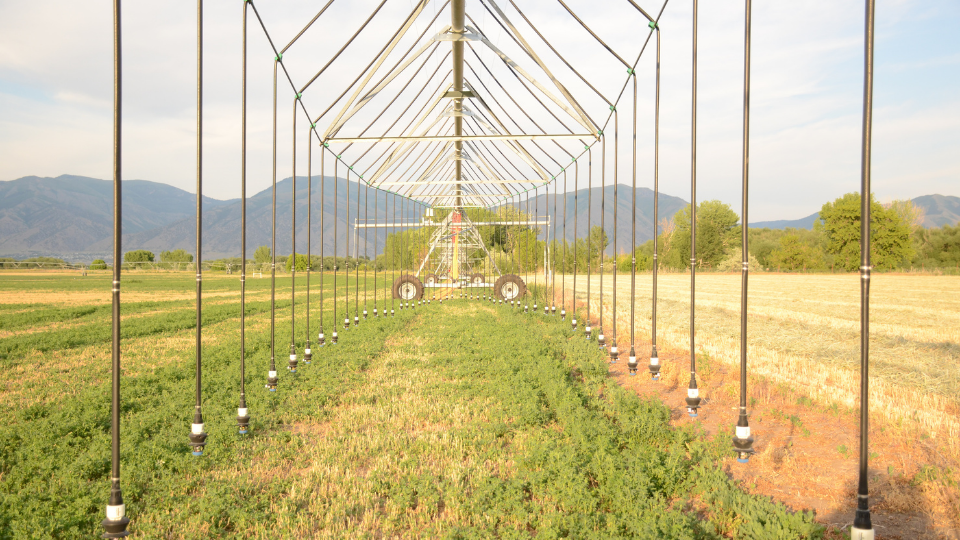
Irrigation Equipment Concerns
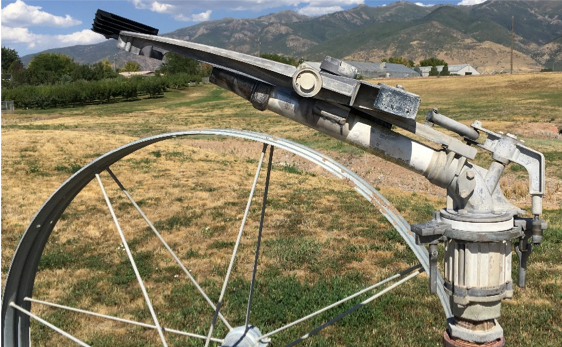
Figure 2. Sprinkler Gun
Note. The mineral (hard water) scaling on this large gun sprinkler will have a negligible effect on its operation, while similar scaling could have a notable impact on a drip irrigation system.
For sprinkler and drip irrigation systems, assessing other chemical qualities of the irrigation water may be necessary. The hardness (based on bicarbonate and carbonate) and pH of irrigation water are important when considering mineral scaling risk in irrigation systems (Figure 2). Total suspended solids (TSS) may be of concern if sedimentation in pipelines or driplines is a risk and for identifying filtration needs (Figure 3). TSS is typically reported in milligrams per liter (mg/l) units, which is equivalent to parts per million (ppm). For reference, 1,000 mg/l equals 1.07 ounces per gallon or 1,540 pounds per acre-foot. For irrigation systems, particle size is more important than TSS. The presence of larger particles (sands and silts) in irrigation water can cause sediment buildup in irrigation systems.
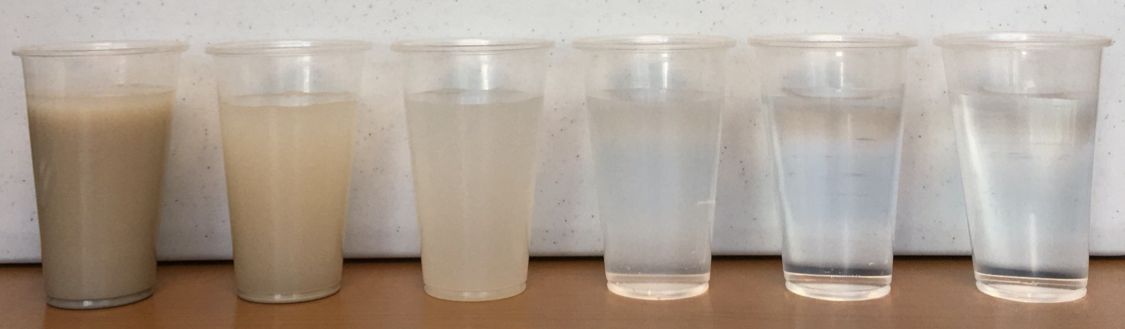
Figure 3. Water With Different Total Suspended Solids Contents:
(left to right) 100,000 mg/l, 10,000 mg/l; 1,000 mg/l; 100 mg/l; 10 mg/l; and 0 mg/l
Nutrients
Irrigation water can carry significant nutrient concentrations. Unlike potable water, which has EPA limits on nutrients (EPA, 2023), such is often not a concern in irrigation. However, irrigation water nutrient concentrations may reduce fertilizer needs and are thus important when developing a nutrient management plan (NMP). A common nutrient found in irrigation water is nitrate. Most water samples processed by the USUAL in 2021 had low nitrate-nitrogen (Figure 4). Another plant nutrient present in some Utah waters is sulfur (Figure 4). The wide range of concentrations of both these nutrients is why testing is important when developing NMPs.
Figure 4. Nitrate-Nitrogen and Sulfur Concentrations in Water Samples Processed by the
Utah State University Analytical Laboratories in 2021
Food Safety and Pathogens
Irrigation water can harbor pathogens that can contaminate food crops and cause plant disease. Pathogen presence in surface water and groundwater can result from runoff from land-applied manure, direct fecal deposition from livestock cattle and wildlife, overflow from manure lagoons and storage sites, leaky sewer lines, and underground flow from septic drainage fields. Surface waters have the highest risk of pathogen contamination, particularly when livestock are present. Irrigation canals are most at risk for pathogen loads during and immediately following rainfall. Depending on treatment measures, effluent from treatment lagoons can be high in pathogens (Hashem & Qi, 2021; Owusu-Twum & Sharara, 2022). Groundwater wells carry a lower risk but are still susceptible to contamination.
Pathogen testing of irrigation water for fruit and vegetable crops is regulated under the Food Safety Modernization Act (U.S. Food and Drug Administration [FDA], 2022). Common concerning pathogens include the bacteria E. coli, Salmonella enterica, and Listeria monocytogenes, and viruses such as noroviruses. In general, testing for the presence of E. coli is the best way to assess fecal contamination in irrigation water. E. coli results are reported as the total colony-forming units (CFU) per 100 mL of water. Average E. coli concentrations of <126 CFU/100 mL are acceptable, and maximum concentrations should not exceed 410 CFU/100 mL during adverse conditions like following rain events (FDA, 2022). E. coli can be analyzed through an approved laboratory found in this Certified Laboratories report from the Utah Department of Health. USU does not currently provide pathogen testing services.
Other Pollutants
Irrigation water should be tested for additional pollutants if a concern exists. For example, if untreated urban stormwater runoff enters a water source, hydrocarbons and other pollutants may be introduced.
When to Sample?
Irrigation water sources should be tested before the first use by a given user. Other times to test irrigation water quality include when a new source is added to an irrigation system after a significant change to a water source (e.g., a significant drawdown of an aquifer, deepening of a well, changes in upstream return flows to a surface water source), or a new crop is to be grown. Test water quality at least two times during the irrigation season (early and late). Groundwater levels and surface water flows in Utah are typically at their highest early in the season. Later in the season, aquifer drawdown or reduced surface water flows may concentrate solutes in the water. So, late-season water quality may be worse than early-season (Figure 5). Understanding how water quality changes over time can improve irrigation water management.
Figure 5. Electrical Conductivity and Sodium Adsorption Ratio for the U.S. Geological Survey Station:
Colorado River Near Colorado-Utah State Line, 2017–2021
Data source: U.S. Geological Survey (USGS), 2022
Where to Sample?
The sampling location depends upon the water source and irrigation system. Samples should be collected near the point of use. For sprinkler and drip irrigation systems, collect samples from a tap in the pressurized pipe or from a sprinkler. For surface irrigated fields, collect the sample near the field head gate because water quality can change along a channel.
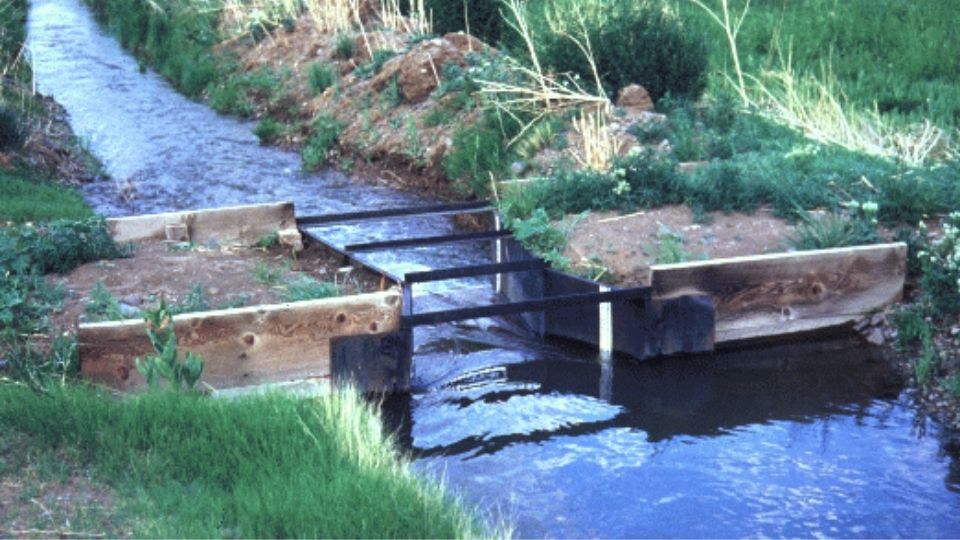
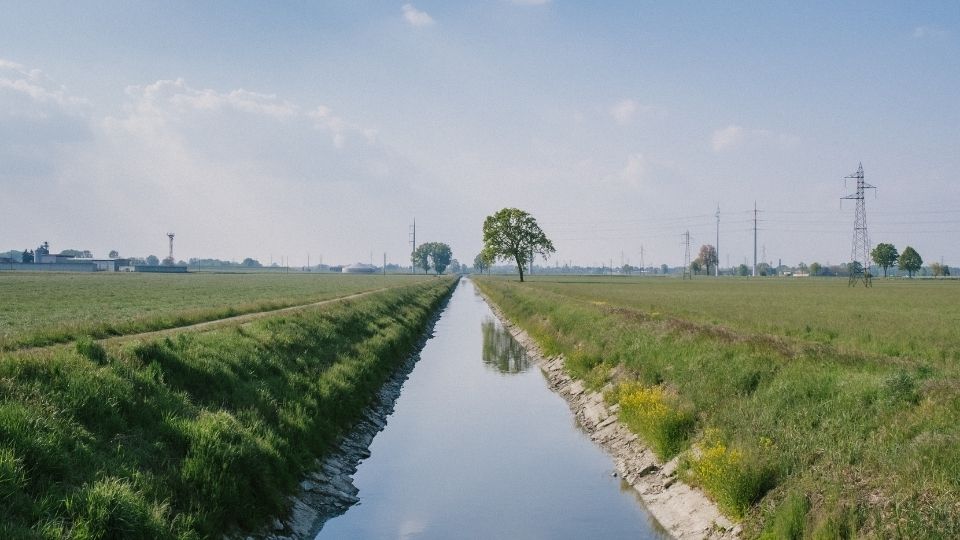
Sampling From Surface Water Sources
Samples from flowing surface water (canals or streams) should be collected mid-stream and below the surface in the upper-middle depth of flow (Figure 6; EPA, 2006). This location typically has the greatest flow velocity and should provide the best mixing of dissolved constituents. This location is not ideal for TSS, which should be sampled over the range of depths that contribute to irrigation flow (consider the depth of the pump intake, turnout gate, etc.; USGS [2006]). For open channels, it may be helpful to use a sampling container attached to the end of a pole (Figure 6). Both the sampling container and shipping container should be triple-rinsed in the source water before sample collection.
Figure 6. Example Water Sample Collection Location From a Canal or Stream
Sampling From Wells
When collecting a water sample from an irrigation system fed by a well, the well’s borehole must first be properly evacuated. When a well is not being pumped, the water in the well stagnates and may not represent the surrounding aquifer. Sampling should occur after pumping, at a minimum, the volume of one wet borehole of water out of the well (USGS, 2006). The time needed to pump one wet borehole volume can be computed as:
where
t = Time to pump one wet borehole volume of water (minutes)
B = Total borehole depth (ft; Figure 7)
W = Depth-to-Water (ft).
D = Diameter of the borehole (in.).
Q = Pump flow rate (gallons per minute, gpm).
If not known, the diameter of the well (D) and the total borehole depth (B) can typically be obtained from the well drilling log available from the Utah Division of Water Rights. The depth-to-water (W) can be measured with an electronic sounder, or the static (non-pumping) depth from the well log may be used.
Calculation Example
A well is 200 feet deep, was drilled to an 18-inch diameter, and has a 14-inch diameter casing. The static water level is 100 feet below the ground surface. The pumping rate will be about 500 gallons per minute (gpm).
The well depth, B, is 200 feet and the depth-to-water, W, is 100 feet, giving 200 feet – 100 feet = 100 feet of water in the well. The diameter, D, is 18 inches (the casing diameter is not needed). The minimum pumping time before collecting a sample is 0.041 × (200 feet – 100 feet) × 18 inches × 18 inches ÷ 500 gallons per minute = 2.7 minutes. The well should be pumped at least 3 minutes before sample collection.
Water samples can be collected from any discharge of the well before the water reaches the ground.
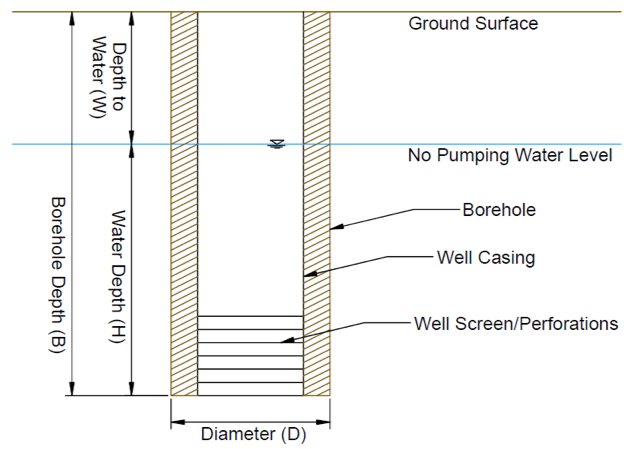
Figure 7. Well Borehole Dimensions
How to Sample/Test?
Irrigation water quality can be tested using field methods or laboratory methods.
Field Methods
Field methods include electrical sensors or chemical analysis kits that test for EC and pH. Typically, an electronic probe is placed in a small container of the water or directly into the water source (Figures 8 and 9). Testing probes vary in accuracy and should be periodically recalibrated per the manufacturer’s recommendations. Field methods are particularly helpful if frequent water quality assessments must be made or if many sources are to be tested. Field methods provide near-instantaneous results. Some probes can even be configured to measure and record at regular intervals for a prolonged period. Good quality, small handheld probes like in Figure 8 (right) may cost around $100 for an EC-only probe or about double that for a probe that also measures pH. Probes like the one in Figure 8 (left) are about $1,200 or more each. The difference between the two probe types is typically in accuracy and probe features. The smaller probe is sufficient for most irrigation purposes.
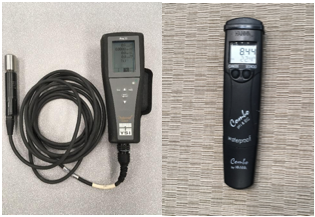
Figure 8. Example Photos of Handheld Water Quality Field Probes
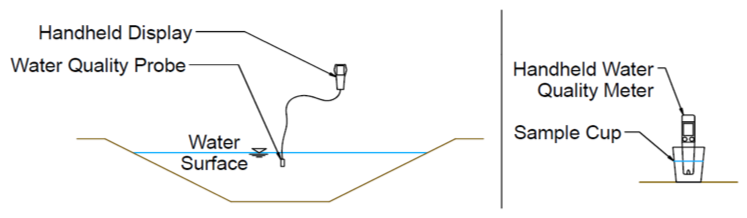
Figure 9. Examples of Water Quality Sampling With Handheld Field Probes
Water Sampling Methods for Lab Testing
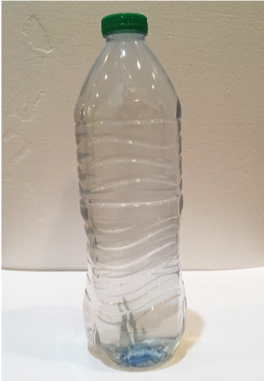
Figure 10. Water Sample in a Water Bottle, Triple-Rinsed in the Source Water Before Collection
Labs can test for many more chemical and biological constituents than possible with field probes, but methodologies vary by lab. Results from lab analyses are not instantly available as labs require time to process samples and generate reports. However, many labs can certify their results, which can be necessary in some situations.
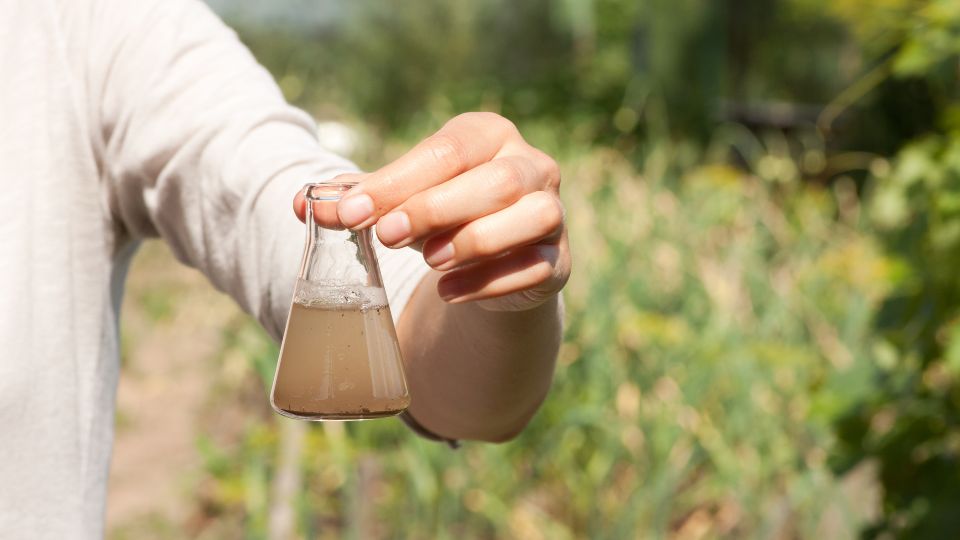
Water sampling methods include sample collection, sample storage, and sample transportation. Water sampling techniques are dependent upon the tested constituents and the water source. Some labs may provide containers for samples and instructions on collecting samples. For irrigation, it is acceptable to use a self-supplied container like a cleaned, empty drinking water bottle (Figure 10). The USUAL requests an 8- to 12-ounce container. Before sampling, rinse the container in the source water three times, and then collect the sample by filling the container to the top, capping tightly, and drying the outside of the bottle (USUAL, 2020; Figure 10). Submit with the lab’s paperwork, which also provides sampling and shipping directions. For irrigation, a single, properly collected sample is typically sufficient for each location and sampling time. Avoid mixing samples from multiple locations or times.
Send water samples to the lab as soon as possible. If the sample is being tested for non-elemental compounds (for example, nitrate), the sample should be delivered to the lab on the same day or via overnight delivery (EPA, 2016). Irrigation water quality does not require the same level of accuracy as drinking water analyses, and therefore, preservatives like acids may not be necessary if samples are sent to the lab promptly.
Testing Provided by the Utah State University Analytical Laboratories
The USUAL provides several water quality testing options for irrigation water (Table 2). For routine testing, the Irrigation Water Analysis is sufficient. The combined Irrigation and Livestock Water Analysis is appropriate when developing an NMP when a new water source is developed, or when there are specific toxicity concerns. Currently (2023), the USUAL charges $50 for an Irrigation Water Quality analysis and $65 for an Irrigation and Livestock Water Quality analysis, and the turnaround time is about one week.
Table 2. Irrigation Water Quality Tests Provided by the Utah State University Analytical Laboratories (USUAL)
|
Irrigation Water Analysis |
||||
|
Salinity (EC) |
Boron (B) |
Chloride (Cl) |
Evaluation |
|
|
Sodium (Na) |
Bicarbonate (HCO) |
Sulfate (SO4) |
||
|
Calcium (Ca) + Magnesium (Mg) |
Sodium adsorption ratio (SAR) |
Residual sodium carbonate (NaCO3) |
Irrigation water classification |
|
|
Livestock Water Analysis |
||||
|
pH |
Nitrate (NO3) |
Chloride (Cl) |
Salinity (EC) |
|
|
Elemental analysis (see below) |
||||
|
Combined Irrigation and Livestock Water Analysis |
||||
|
Bicarbonate and/or Carbonate Only Analysis |
||||
|
Elemental Analysis |
||||
|
Aluminum (Al) |
Cobalt (Co) |
Molybdenum (Mo) |
Sulfate-S (S) |
|
|
Arsenic (As) |
Copper (Cu) |
Nickel (Ni) |
Sodium (Na) |
|
|
Boron (B) |
Iron (Fe) |
Phosphorus (P) |
Strontium (Sr) |
|
|
Calcium (Ca) |
Lead (Pb) |
Potassium (K) |
Zinc (Zn) |
|
|
Cadmium (Cd) |
Magnesium (Mg) |
Selenium (Se) |
||
|
Chromium (Cr) |
Manganese (Mn) |
Silicon (Si) |
||
|
Chloride (Cl) Only Analysis |
||||
|
Salinity (EC) Only Analysis |
||||
|
Nitrate-N Only Analysis |
||||
|
pH Only Analysis |
||||
Summary
Understanding irrigation water quality is an important part of irrigation water management. Water quality testing begins with identifying constituents for which to test. Proper sample collection is important for characterizing a water source.
Acknowledgments
This fact sheet is based, in part, on a presentation titled “Water Sample for Physical Properties and Biological Health Concerns” by Niel Allen, Utah State University, given on March 17, 2021.
References
-
Chiliniski, M., Stock, M., Grossl, P., & Oliver, E. (2022). Trace element contamination in urban soils: Testing and management [Fact sheet]. Utah State University Extension. https://digitalcommons.usu.edu/cgi/viewcontent.cgi?article=3281&context=extension_curall
-
Hashem, M. S., & Qi, X. (2021). Treated wastewater irrigation—a review. Water, 13(11), 1527. https://doi.org/10.3390/w13111527
-
Hoffman, G. J., & Shalhevet, J. (2007). Chapter 7: Controlling salinity. In G.J. Hoffman, R. G. Evans, M. E. Jensen, D. L. Martin, & R. L. Elliot (Eds.), Design and operation of farm irrigation systems (2nd ed.). American Society of Agricultural and Biological Engineers.
-
Owusu-Twum, M. Y., & Sharara, M.A. (2020). Sludge management in anaerobic swine lagoons: A review. Journal of Environmental Management, 271, 110949. https://doi.org/10.1016/j.jenvman.2020.110949
-
Suarez, D. L. (2012). Chapter 11: Irrigation water quality assessments. In W. W. Wallender & K. K. Tanji (Eds.), Agricultural salinity assessment and management. ASCE Manuals and Reports on Engineering Practice, No. 71. 2nd ed. American Society of Civil Engineers.
-
U.S. Environmental Protection Agency (EPA). (2006). Chapter 17: Bacterial indicators of potential pathogens. In Voluntary estuary monitoring manual, EPA-842-B06-003. 2nd ed. https://www.epa.gov/sites/default/files/2015-09/documents/2009_03_13_estuaries_monitor_chap17.pdf
-
U.S. Environmental Protection Agency (EPA). (2016). Quick guide to drinking water sample collection [2nd update]. https://www.epa.gov/sites/default/files/2015-11/documents/drinking_water_sample_collection.pdf
-
U.S. Environmental Protection Agency (EPA). (2023). National primary drinking water regulations. https://www.epa.gov/ground-water-and-drinking-water/national-primary-drinking-water-regulations.
-
U.S. Food and Drug Administration (FDA). (2021). Agricultural water proposed rule. https://www.fda.gov/media/154334/download.
-
U.S. Geological Survey (USGS). (2006). Chapter A4: Collection of water samples. In National field manual for the collection of water-quality data. https://pubs.usgs.gov/twri/twri9a4/twri9a4_Chap4_v2.pdf.
-
U.S. Geological Survey (USGS). (2022). National water information system. Retrieved April 5, 2022, from https://waterdata.usgs.gov/nwis.
-
Utah State University Analytical Laboratories (USUAL). (2020). Irrigation/Livestock water sample information sheet. http://www.usual.usu.edu/files/waterform2020.pdf
Published September 2023
Utah State University Extension
Peer-reviewed fact sheet
Authors
Burdette Barker, Utah State University (USU) Extension Irrigation Specialist;
Matt Yost, USU Extension Agroclimate Specialist;
Erin Rivers, USU Extension Water Quality Specialist;
Rhonda Miller, USU Extension Agricultural Environmental Quality Specialist;
Kalen Taylor, USU Extension Assistant Professor, Millard County;
Tiffany Evans, USU Analytical Laboratories Manager

Burdette Barker
Irrigation

Matt Yost
Agroclimate Specialist
PSC Dept

Rhonda Miller
Agricultural Environmental Quality Specialist
ASTE Dept

Kalen Taylor
Extension Assistant Professor | Agriculture | Millard County
Agriculture and Natural Resources
Related Research
4R’s of Irrigation Management
The research community and fertilizer industry have developed and utilized a framework termed “4R nutrient management” to help improve fertilizer stewardship. For decades, national and international organizations and institutes such as The Fertilizer Inst
Accurate Irrigation Water Flow Measurement in Pipes
Accurate flow measurement is important to irrigation water management and water rights accounting and protection. Accurate flow measurement is essential in ensuring equitable water distribution to water rights holders and shareholders within irrigation co
County-Level View of Irrigation Trends in Utah and the West
As water demand and scarcity increase simultaneously over the coming decades, water managers and growers will need to optimize water use on their irrigated lands. These challenges have been especially noticeable as the Western U.S.faces a prolonged “megad
Defense Against Drought
Utah’s climate can often be harsh and unpredictable. As the nation’s second driest state, Utah is commonly subject to droughts. Extensive statewide droughts have often lasted 5 to 6 years. It is imperative that farmers are well prepared to defend against
Deficit Irrigation of Pastures
Deficit irrigation is any irrigation level that does not meet the crop’s full evapotranspiration (ET) demand, meaning evaporation from plant and soil surface and transpiration through plant growth.
Drought Tolerance Guide for Alfalfa in Utah
Crop variety selection is one of the most important choices on the farm. Crop genetics determine a significant portion of the yield potential and resource use efficiency. Crop types and genetics that use water more efficiently will become increasingly imp
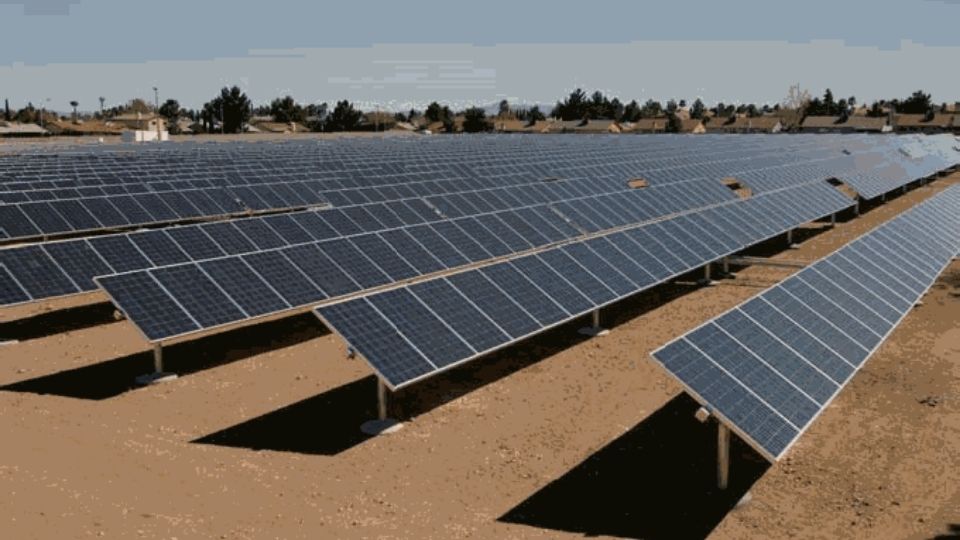
Economic Feasibility of Solar Photovoltaic Irrigation Systems
The Great Basin is primarily located in Nevada, western Utah, and small sections of southern Oregon and Idaho. The Great Basin is noted for its arid conditions and high percentage of publically owned land. The potential for solar energy generation in the
Energy Conservation with Irrigation Water Management
Irrigators in Utah experienced rapidly increasing energy costs from the mid 1970s to the late 1980s. These costs remain relatively high. Those who are pumping from deep wells are particularly interested in ways to cut back on energy use without doing away
Guide to Irrigation Sprinkler Packages for Pivots and Laterals
Guide to Irrigation Sprinkler Packages for Pivots and Laterals
How Good is Your Water Measurement?
Accurate water measurement is essential to maintaining equity of water delivery within an irrigation company or water districts. Good management of our scarce water resource is dependent upon quantifying supplies and uses with accurate measurement techniq
Irrigation Canal Lining?
Irrigation canals placed in native soil or lined with earth can have seepage water losses varying from 20 percent to more than 50 percent. Well designed, new compacted earth lined canals can have reduced seepage losses similar to concrete lined channels.
Irrigation Water Loss and Recovery in Utah
When deciding which irrigation systems to adopt, permit, or promote, it is important to consider how their efficiency and losses affect the water balance of Utah’s watersheds and drainage basins. Irrigators have no control over precipitation and only limi
Irrigation Water Quality Sampling Guide
The suitability of a water source for irrigation depends on the water quality, and some sources may be altogether unsuitable for practical use.
Managing Saline and Sodic Soils and Irrigation Water
Salt is important in plant and soil management. Excessive salt concentrations in soil can cause water to be less available to plants because of the osmotic forces of salt in the soil water. Excessive concentrations of some salt ions can also be toxic to p
Managing Soil pH for Crop Production in Calcareous-Alkaline Soil
In semiarid soils of the Western U.S., altering soil pH is not easily accomplished nor straightforward. Recall that pH is a measure of the acidity or alkalinity of a substance. More specifically, Utah’s soil pH range can be 1,000 times more acidic or alka
Mobile Drip Irrigation for Pivots and Laterals
New technologies like MDI have the potential to improve irrigation efficiency thereby increasing water available to the crop and conserving water by reducing loss. If you are considering MDI on your farm, it will be important to carefully review its poten
Precision Irrigation Guide for Center Pivots
Precision irrigation is a process involving technology and specialized equipment to improve the efficiency and effectiveness of agriculture irrigation management. This management process is beneficial in allocating water based on spatial variability throu
Soil Sampling Guide for Crops
Why conduct soil sampling for crops? The answer is simple and intuitive for most involved in agriculture. Regular soil sampling, testing, and associated guidance on fertilization and soil amendments help develop and maintain more productive and healthy
Strategies for Deficit Irrigation of Forage Crops
Deficit irrigation strategies with varying effectiveness can be employed in many cases to maximize production and profit. These strategies can include modifying irrigation schedules, concentrating irrigation to critical crop growth stages, reducing rates,
Ten Considerations for Solar-Powered Irrigation in Utah
Generating power from solar energy used to be one of the most expensive options in Utah. This scenario is changing. According to the American Council on Renewable Energy (ACORE, 2021), the cost of solar power production went down by 90% between 2009 and 2
Understanding Irrigation Water Optimization
It is important to consider the possible hydrologic impacts of irrigation optimization efforts to avoid implementing practices that have little appreciable effect relative to the desired outcome. Examples of desired outcomes include increasing supply reli

Utah Surface Irrigation Water Optimization Opportunities and Barriers
This peer-reviewed fact sheet from Utah State University Extension summarizes a statewide survey of surface irrigators, highlighting current practices, barriers, and opportunities for water optimization in Utah agriculture. It emphasizes the importance of
Variable Frequency Drives for Irrigation Pumps
A VFD can make sense in a variety of irrigation applications. Here are 6 of the major applications where one might consider a VFD (also see Henry and Stringham, 2013 and USDA-NRCS, 2010):
Water Rights in Utah
If you are connected to a municipal system, your water is probably categorized as “culinary or municipal water” and is used for everything from drinking and bathing to washing the car to watering tomatoes. However the Utah Division of Water Rights takes a
25 Rules of Thumb for Field Crops
University Extension services are widely known for scientific information on best practices for field crop production. Many Extension experts commonly offer the same tips or "rules of thumb" to growers. This article is certainly not a comprehensive list o
Irrigation Advance Sensors Are Having Large Impacts in Surface Irrigation
There are many good things about surface irrigation, but the labor requirements and large water withdrawals can diminish its feasibility in situations with limited access to labor or water. In this fact sheet, we will describe two of these systems current