U.S. West Consumer Preferences for Specialty Labeled Processed Foods
Introduction
Highlights
- Producers, food makers, and processors can use this fact sheet’s information to improve decision-making related to product development, pricing, placement, and promotion.
- Survey results suggest that while consumers view both organic and local products favorably, health and safety attributes are important for organic products, and freshness and taste attributes are more important for local products.
- Product options that included two labels were valued higher than the products that only included one specialty label.
- Consumers’ willingness to pay underscores the value consumers place on specialty production practices.
In the United States, consumer demand for specialty processed foods is increasingly centered on natural, organic, and local offerings that represent health and ethical values. In 2023, organic food sales reached approximately $63.8 billion, reflecting a 3.4% increase from the previous year, with packaged food categories such as sauces, baked goods, and baby foods leading the growth (Gillco, 2022). Health remains the strongest motivator for organic food consumption, with more than 55% of consumers choosing organic foods to avoid pesticides and synthetic additives (Funk & Kennedy, 2016). While only about one-third of consumers believe organic foods taste better, this perception is significantly higher among frequent organic food buyers (Funk & Kennedy, 2016).
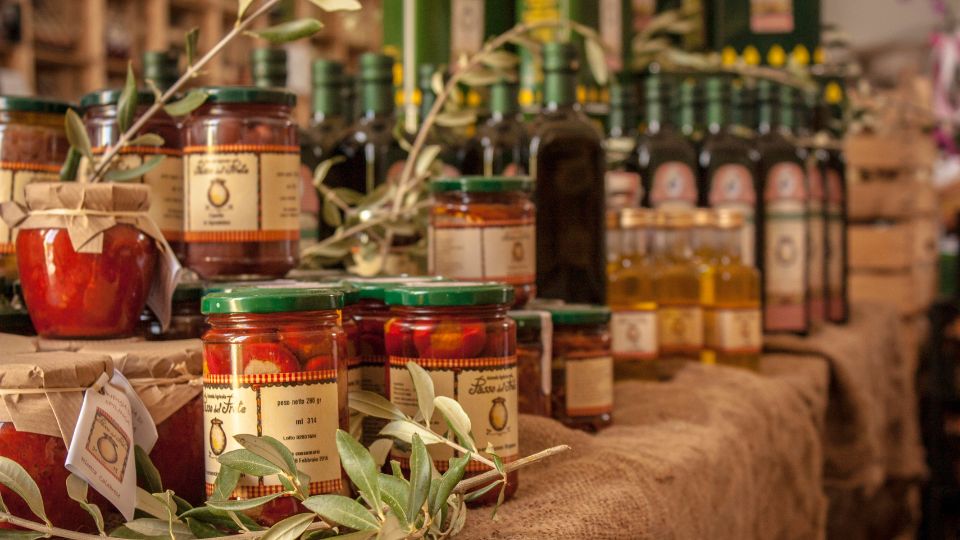
Preferences for locally labelled foods are also prominent as consumers associate local sourcing with supporting the regional economy, greater variety, and healthier options (Stanton et al., 2018). Farmers markets amplify this demand by fostering community connections and strengthening consumer trust. These values align with the growing clean label movement, in which shoppers prioritize minimally processed foods free from artificial additives, preservatives, or hormones, and seek transparency in ingredient lists (GlobeNewswire, 2024; Williams, 2023).
A study was conducted by Utah State University (USU) in the fall of 2024 to determine western U.S. consumer preferences and willingness to pay (WTP) for specialty labelled processed food products. Qualtrics collected study data from consumers using an online survey via the Qualtrics response system. A total of 1,282 responses were collected from all U.S. western states and territories. The following fact sheet provides an overview of study results in terms of respondent preferences for specialty labeled processed foods. Specifically, consumer knowledge and familiarity with various specialty production and labeling programs, including organic, local, grass-fed, and non-GMO, were examined, along with specialty food consumption habits and attitudes. Finally, consumer pricing preferences for each of the three processed products examined are discussed.
The information included in this fact sheet can be used by producers, food makers, and processors to improve decision-making related to product development, pricing, placement, and promotion. Additional fact sheets in this series examine consumer preferences and consumption habits for processed foods, as well as target market identification for three specific processed products.
Results Overview
Specialty Food Label Familiarity and Attitudes
Respondents were asked to indicate their familiarity on a scale of 1 to 5 (not at all familiar to extremely familiar) with various specialty production and labeling programs, specifically the “certified organic,” “locally grown,” “non-GMO,” and “grass-fed” programs. There was minimal variation in their familiarity across programs and less than a third, or approximately 25% to 27% of the respondents, reported being very familiar or extremely familiar with any one program. Respondents were most familiar with the grass-fed program and least familiar with the non-GMO program.
Similarly, respondents were asked to indicate how often they consumed foods with these specialty labels. As shown in Table 1, respondents consumed organic and locally grown foods more often than grass-fed or non-GMO foods, with just over 36% and 37% consuming organic and locally grown foods at least once a week, respectively. Fewer respondents (31%) consume grass-fed products at least once week.
Table 1. Specialty Labeled Food Consumption
| Specialty label | Never | Once a month or less |
Several times a month |
Once a week | Several times a week |
|---|---|---|---|---|---|
| Organic | 11.23% | 25.51% | 26.83% | 14.04% | 22.39% |
| Non-GMO | 15.44% | 22.07% | 27.77% | 15.05% | 19.66% |
| Grass-fed | 17.00% | 26.37% | 25.43% | 16.54% | 14.66% |
| Locally grown | 8.74% | 23.95% | 30.19% | 15.91% | 21.22% |
To assess respondent attitudes, they were asked to rate their agreement (strongly agree to strongly disagree) with statements about organic products. As shown in Figure 1, respondents agreed most with the statement “Organic products are too expensive,” with 71% of the respondents somewhat agreeing or strongly agreeing. This suggests that price may be a barrier to organic purchases for some consumers. The statement respondents agreed with the least was “Organic products are not important to me,” as only 31% of the respondents somewhat agreed or strongly agreed with the statement. Respondents agreed heavily with statements that organic products are healthier, safer, and fresher.
Figure 1. Organic Product Attitudes
Additionally, respondents were asked to rate their agreement with statements about local products (see Figure 2). Respondents agreed most with the statement “Local products benefit local farmers,” with more than half (51%) of the respondents strongly agreeing and an additional 30% of the respondents somewhat agreeing. At least half of the respondents also somewhat agreed or strongly agreed with the statements “Local products are fresher than nonlocal products” and “Local products taste better than nonlocal products.” Respondents agreed the least with the statement “Local products are not important to me,” with only 25% of the respondents agreeing.
Figure 2. Local Product Attitudes

When comparing respondent agreement ratings across statements for organic products and local products, respondents agreed more with statements about organic products being healthier, safer, and too expensive than they agreed with similar statements about local products. However, respondents agreed more with statements about local products being fresher and tasting better than they did with similar statements about organic products. These results suggest that while consumers view both organic and local products favorably, health and safety attributes are important for organic products, and freshness and taste attributes are more important for local products.
Willingness to Pay for Specialty Labeled Processed Food Products
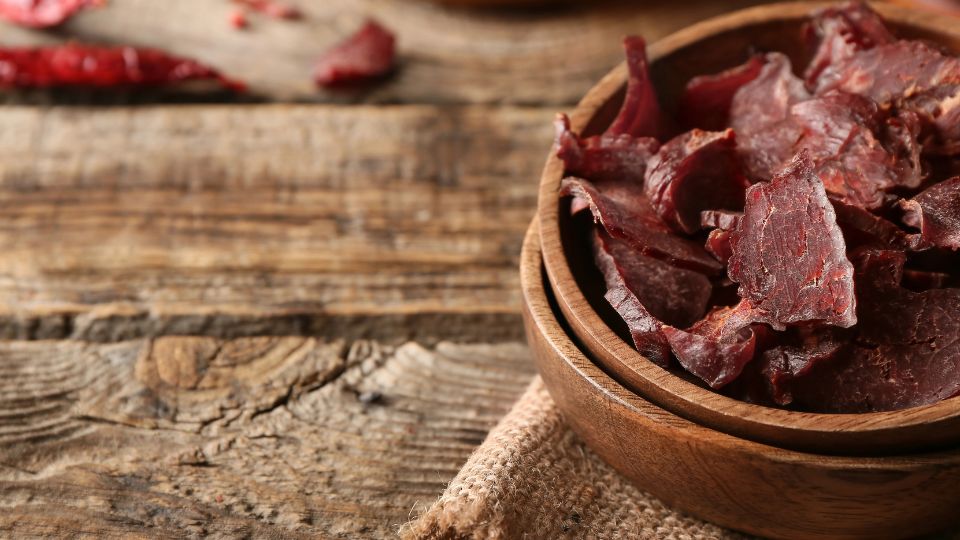
Through a bidding process, respondent WTP or pricing was calculated for three processed foods: beef jerky, tart cherry juice, and mild salsa, each with various specialty labels. Respondents were willing to pay the most for the 8-ounce beef jerky labeled organic and grass-fed, closely followed by the beef jerky product labeled local and grass-fed (see Figure 3). The non-labeled beef jerky was valued at least $2.53 less than the other jerky products. The products with two labels were valued at least $0.60 more than products with only one label. Among the products with only one label, grass-fed beef jerky had the highest value.
Figure 3. WTP for Beef Jerky Products (8-ounce package)

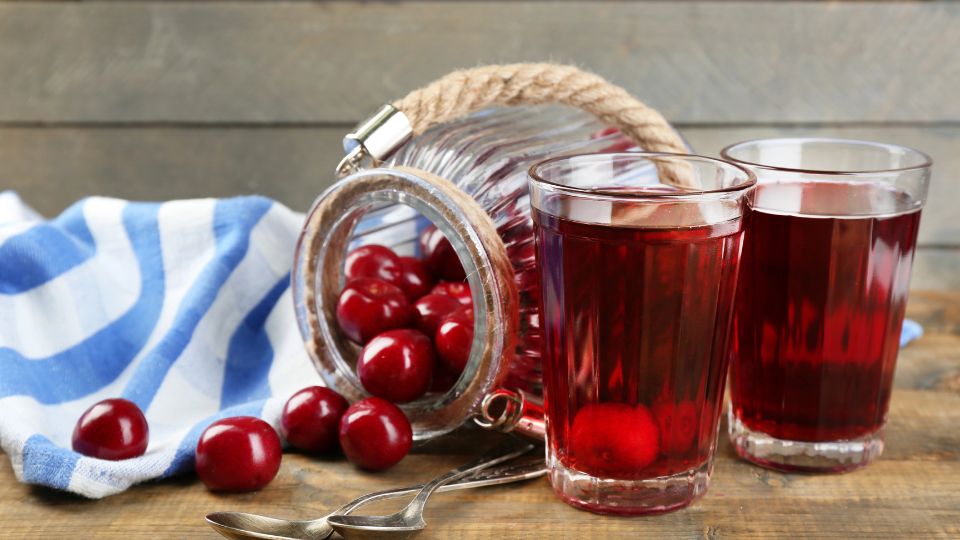
Respondents were willing to pay the most for the local and organic labeled tart cherry juice (32 ounces; see Figure 4). The product options that included two specialty labels were valued at least $0.24 higher than those with only a single label. The highest-valued single label was organic, valued at $6.25 for a 32-ounce bottle. The least valued single label was non-GMO at $5.87. Consumers were willing to pay the least for non-labeled tart cherry juice, at least $1.01 less than any of the labeled products.

Respondents were willing to pay the most for local and organic labeled mild salsa (16 ounces; see Figure 5). Again, all product options that included two labels were valued higher than the products that only included one specialty label. The organic salsa was the single label valued most at $3.75, while non-GMO was the single label least valued. The non-labeled salsa was valued least at $2.78, $0.68 or more below all the other options.
Figure 5. WTP for Mild Salsa Products (16-ounce bottle)
Across all three processed products, respondents were willing to pay more for products with two specialty labels, especially compared to products with no labels, showing that consumers value labels and are willing to pay premiums for products with the labeled characteristics.
Conclusions

This publication demonstrates that consumers in the western U.S. place significant value on specialty labels such as organic, local, grass-fed, and non-GMO when purchasing processed food products. While familiarity with these programs was moderate, organic and locally labeled product consumption occurred most frequently, indicating that health, safety, freshness, and taste remain strong motivators. Price continues to be a barrier, especially for organic products, but some consumers value both organic and local foods due to their perceived health benefits, safety, and contributions to local economies.
Across all three processed food products studied (beef jerky, tart cherry juice, and salsa), consumers consistently demonstrated a willingness to pay more for items carrying specialty labels, particularly those with combined labels. This willingness underscores the value consumers place on specialty production practices. For food producers and processors, these results indicate that offering products with credible specialty certifications and clear labeling can capture consumer demand and justify premium pricing in the marketplace.
Recommendations
- Prioritize specialty labels—especially dual-label combinations (e.g., organic + local)—to capture higher consumer willingness to pay.
- Emphasize the following key consumer values in marketing.
- Organic: highlight health and safety benefits.
- Local: highlight freshness, taste, and support for local farmers.
- Improve transparency in labeling and educate consumers about less familiar labels, such as non-GMO.
- Address price sensitivity by:
- Offering smaller or more affordable package sizes.
- Highlighting the added value of products with multiple specialty labels.
- Communicating long-term benefits of healthier or safer options.
- Strengthen market presence through partnerships with retailers, farmers markets, and online platforms that emphasize specialty and clean label foods.
- Use clear, consistent branding to build consumer trust and reduce confusion in the specialty food marketplace.
Acknowledgments
Funding for this publication was made possible by a grant/cooperative agreement from the U.S. Department of Agriculture (USDA) Agricultural Marketing Service. Its contents are solely the responsibility of the authors and do not necessarily represent the official views of the USDA.
The authors used ChatGPT to generate the “Recommendations” section from the fact sheet text, which the authors edited to ensure accuracy. Authors take full responsibility for the content.
References
- Funk, C., & Kennedy, B. (2016, December 1). Americans’ views about and consumption of organic foods. Pew Research Center. https://www.pewresearch.org/science/2016/12/01/americans-views-about-and-consumption-of-organic-foods
- Gillco. (2022, July 20). 15 organic food statistics that may surprise you. Gillco Products, LLC., Azelis. https://gillco.com/2022/07/20/organic-food-statistics-that-may-surprise-you
- GlobeNewswire. (2024, September 24). US packaged organic and clean label food shoppers report 2024: Market trends & opportunities. Digital Media Innovations, LLC. https://www.globenewswire.com/news-release/2024/09/24/2951894/28124/en/US-Packaged-Organic-and-Clean-Label-Food-Shoppers-Report-2024-Market-Trends-Opportunities-in-Packaged-Foods-Consumer-Perceptions-and-Trends-Shaping-the-US-Food-Market.html
- Stanton, J., Wirth, F., & Dao, Y. (2018). An analysis of consumers’ preferences between locally grown/processed food and organic food. Current Investigations in Agriculture and Current Research, 4(1).
- Williams, L. (2023). Consumers associate natural, organic with clean label. Prepared Foods. https://www.preparedfoods.com/articles/127006-consumers-associate-natural-organic-with-clean-label

November 2025
Utah State University Extension
Peer-reviewed fact sheet
Authors
Kynda Curtis, Professor and USU Extension Specialist, Department of Applied Economics; Makaylie Langford, Research Assistant, Department of Applied Economics; Karin Allen, Associate Professor and USU Extension Specialist, Department of Nutrition, Dietetics, and Food Sciences; Ruby Ward, Professor and USU Extension Specialist, Department of Applied Economics

Kynda Curtis
Food Systems Specialist
APEC Dept

Karin Allen
Food Quality & Entrepreneurship Specialist
NDFS Dept

Ruby Ward
Agricultural Entrepreneurship Specialist
APEC Dept
Related Research

Agricultural Producer and Food Maker Food Processing Operation Needs Assessment Overview
Utah State University’s 2024 needs assessment explores the educational, funding, and infrastructure needs of Utah farmers, ranchers, and food makers involved in value-added food production. Results highlight respondent demographics, products, markets, lab

Assessing Utah's Agricultural Producer and Small Processor Interest in Value-Added Food Production
This fact sheet presents findings from a study on value-added food production among Utah farmers, ranchers, and food processors. Highlighting operational characteristics, production timelines, markets, sales goals, and key resources needed to support loca

Target Consumers for Beef Jerky
This study identifies the target market for packaged beef jerky in the western U.S., highlighting consumer demographics, purchasing habits, and willingness to pay premiums for organic, grass-fed, and locally sourced products.
Target Consumers for Beef Jerky
This study identifies the target market for packaged beef jerky in the western U.S., highlighting consumer demographics, purchasing habits, and willingness to pay premiums for organic, grass-fed, and locally sourced products.

Target Consumers for Bottled Mild Salsa
This fact sheet summarizes USU research on western U.S. consumers who purchase mild salsa, highlighting their demographics, food habits, and preferences. Target consumers are middle-aged, highly educated, engaged in local food systems, and willing to pay
Target Consumers for Bottled Tart Cherry Juice
This fact sheet provides an overview of the study results conducted by Utah State University to determine western U.S. consumer preferences and willingness to pay for regionally sourced processed food products. This fact sheet addresses target consumers f
U.S. West Consumer Preferences for Specialty Labeled Processed Foods
Highlighting consumer preferences and willingness to pay for specialty-labeled processed foods, including organic, local, grass-fed, and non-GMO products. Survey results show strong consumer value for health, safety, freshness, and transparency, especiall

U.S. West Consumer Processed Food Preferences and Consumption Habits
This article summarizes a 2024 Utah State University study examining processed food preferences and purchasing behaviors among 1,282 consumers across the western United States. Findings highlight key values such as taste, price, product quality, and trust

Utah's Value-Added Food Processing Options
Explaining what value-added foods are and how producers can increase profit through processing, direct marketing, and vertical integration. Also outlining Utah’s regulatory options and programs to help small food businesses choose the right path for produ