U.S. West Consumer Processed Food Preferences and Consumption Habits

Introduction
Highlights
- Researchers surveyed 1,282 consumers across the U.S. western states and territories about processed food products.
- Producers, food makers, and processors can use the information included here to improve decision-making related to product development, pricing, placement, and promotion.
- Western U.S. consumers value taste, price, and product quality above all when making processed food purchases.
- Labels such as “natural,” “local,” and “organic” resonate with many shoppers, reflecting an interest in health, nutrition, and food origin.
- Food makers can expand market opportunities by offering products that emphasize freshness, flavor, and trusted labeling, while also tailoring distribution strategies to product type.
A study was conducted by Utah State University (USU) in the fall of 2024 to determine western U.S. consumer preferences and willingness to pay (WTP) (i.e., pricing) for regionally sourced processed food products. Study data were collected via an online survey of consumers using the Qualtrics response system. A total of 1,282 responses were collected from all U.S. western states and territories. Qualtrics recruited respondents to ensure that sample averages for age, education level, and annual household income were representative of the region’s demographics.
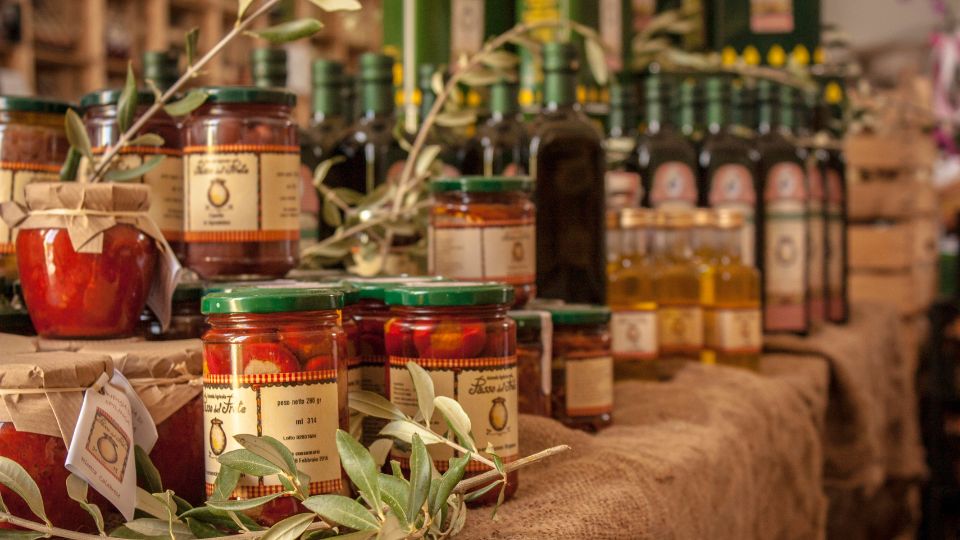
The survey included questions on respondent demographics, food-related lifestyle and behaviors, consumption habits and expenditures, and preferences for specialty labeled foods and food characteristics. Consumer preferences, purchasing habits, and pricing were examined for three processed food products: packaged beef jerky, bottled mild salsa, and bottled tart cherry juice. These products were chosen due to raw product availability in the study region as well as their popularity with cottage and small food makers and processors.
This fact sheet provides an overview of study results, including respondent demographics, common lifestyle and food behaviors, product characteristics, and labeling preferences, as well as processed food purchasing and consumption habits. Producers, food makers, and processors can use the information included in this fact sheet to improve decision-making related to product development, pricing, placement, and promotion. Additional fact sheets in this series examine consumer preferences and WTP for specialty labeled foods, as well as the impact of providing labeling information. Three fact sheets discuss target markets or consumer groups for each of the processed products examined.
Results Overview
Demographics
Table 1 shows the percentage of survey respondents from each state or territory. The largest portion of respondents were between ages 35 and 54 (37%), followed by those aged 18 to 34 years (29%). Nearly two-thirds (65%) of the respondents identified as women, and just over a third (34%) as men. Respondents were primarily White (67%), followed by Hispanic or Latino (11%). Respondents were evenly spread between being married or single, with about 10% reporting their marital status as “other.” The majority (63%) of respondents did not have children under age 18 living in their households.
Nearly all (96%) of the respondents held at least a high school diploma or a GED, and almost two-thirds (65%) had at least some college education or an associate’s degree. Over half (58%) of the respondents were employed part-time, while 45% were employed full-time. Half (49%) of the respondents had annual household incomes of $59,999 or less, and nearly a quarter (24%) had annual incomes below $30,000—the federal poverty level for a family of four (Healthcare.gov, 2025).
Finally, most respondents had some role in grocery shopping for their household, as three-quarters (76%) reported being the primary grocery shopper, and an additional 22% reported being involved in grocery shopping in some capacity.
Table 1. Sample Demographics
| Characteristic | Category | Sample (%) |
|---|---|---|
| State of residence | Alaska | 1.09% |
| California | 22.93% | |
| Oregon | 9.44% | |
| Washington | 10.69% | |
| Idaho | 3.82% | |
| Montana | 1.48% | |
| Hawaii | 2.11% | |
| Utah | 10.14% | |
| Arizona | 11.62% | |
| Colorado | 9.59% | |
| Wyoming | 1.33% | |
| New Mexico | 3.90% | |
| Nevada | 11.47% | |
| Northern Mariana Islands/Guam/American Samoa | 0.07% | |
| Age | 18–34 years | 29.02% |
| 35–54 years | 37.60% | |
| 55–64 years | 14.74% | |
| 65 years and over | 18.64% | |
| Education level | Middle school | 0.31% |
| Some high school | 3.67% | |
| High school graduate or GED | 31.20% | |
| Associate’s degree or some college | 28.39% | |
| Bachelor’s degree | 18.33% | |
| Graduate degree or higher | 18.10% | |
| Annual income | Less than $20,000 | 12.25% |
| $20,000–$39,999 | 19.50% | |
| $40,000–$59,999 | 17.94% | |
| $60,000–$79,999 | 18.25% | |
| $80,000–$99,999 | 8.66% | |
| $100,000–$149,999 | 14.51% | |
| $150,000 and more | 8.89% | |
| Employment status | Full-time employed | 44.62% |
| Part-time employed | 13.34% | |
| Unemployed | 10.53% | |
| Homemaker | 7.49% | |
| Retired | 20.36% | |
| Student | 3.67% | |
| Marital status | Single | 45.79% |
| Married | 44.38% | |
| Other | 9.83% | |
| Children in household | Yes | 37.29% |
| No | 62.71% | |
| Gender | Man | 34.87% |
| Woman | 64.51% | |
| Non-binary | 0.47% | |
| Prefer to self-describe | 0.08% | |
| Prefer not to respond | 0.08% | |
| Ethnicity | Black or African American | 8.27% |
| American Indian or Alaskan Native | 1.79% | |
| Asian | 5.54% | |
| Native Hawaiian and other Pacific Islander | 1.09% | |
| White | 67.39% | |
| Hispanic or Latino | 11.31% | |
| Other | 7.80% |
Lifestyle and Food Behaviors
Respondents were asked to report their agreement with several statements about their food-related behaviors and lifestyle on a scale of 1 to 5 (strongly disagree to strongly agree). As shown in Figure 1, they agreed most with the statement “I eat fresh produce daily,” with a third (34%) strongly agreeing and an additional 42% somewhat agreeing. They agreed least with the statement “I follow a vegetarian diet,” as 55% strongly disagreed. Together these results suggest that most respondents follow a varied diet.
At least half (50%) of the respondents agreed that they bought food from local farmers when available, that physical activity was an important part of their routine, or that they were concerned about food safety or food origin. There was limited agreement among respondents with statements about having food allergies or restrictions or growing their own food.
Researchers questioned respondents about their participation in food and agricultural activities. The most popular activity was shopping at farmers markets, which was the only activity reported by more than half of the respondents. The next most popular activity was eating at local-sourcing restaurants, reported by 35% of the respondents. Although nearly a quarter (24%) of the respondents reported visiting a local farm, only 11% reported traveling overnight, which suggests that most of those who visited farms did not travel far to do so.
Figure 1. Lifestyle and Food Behaviors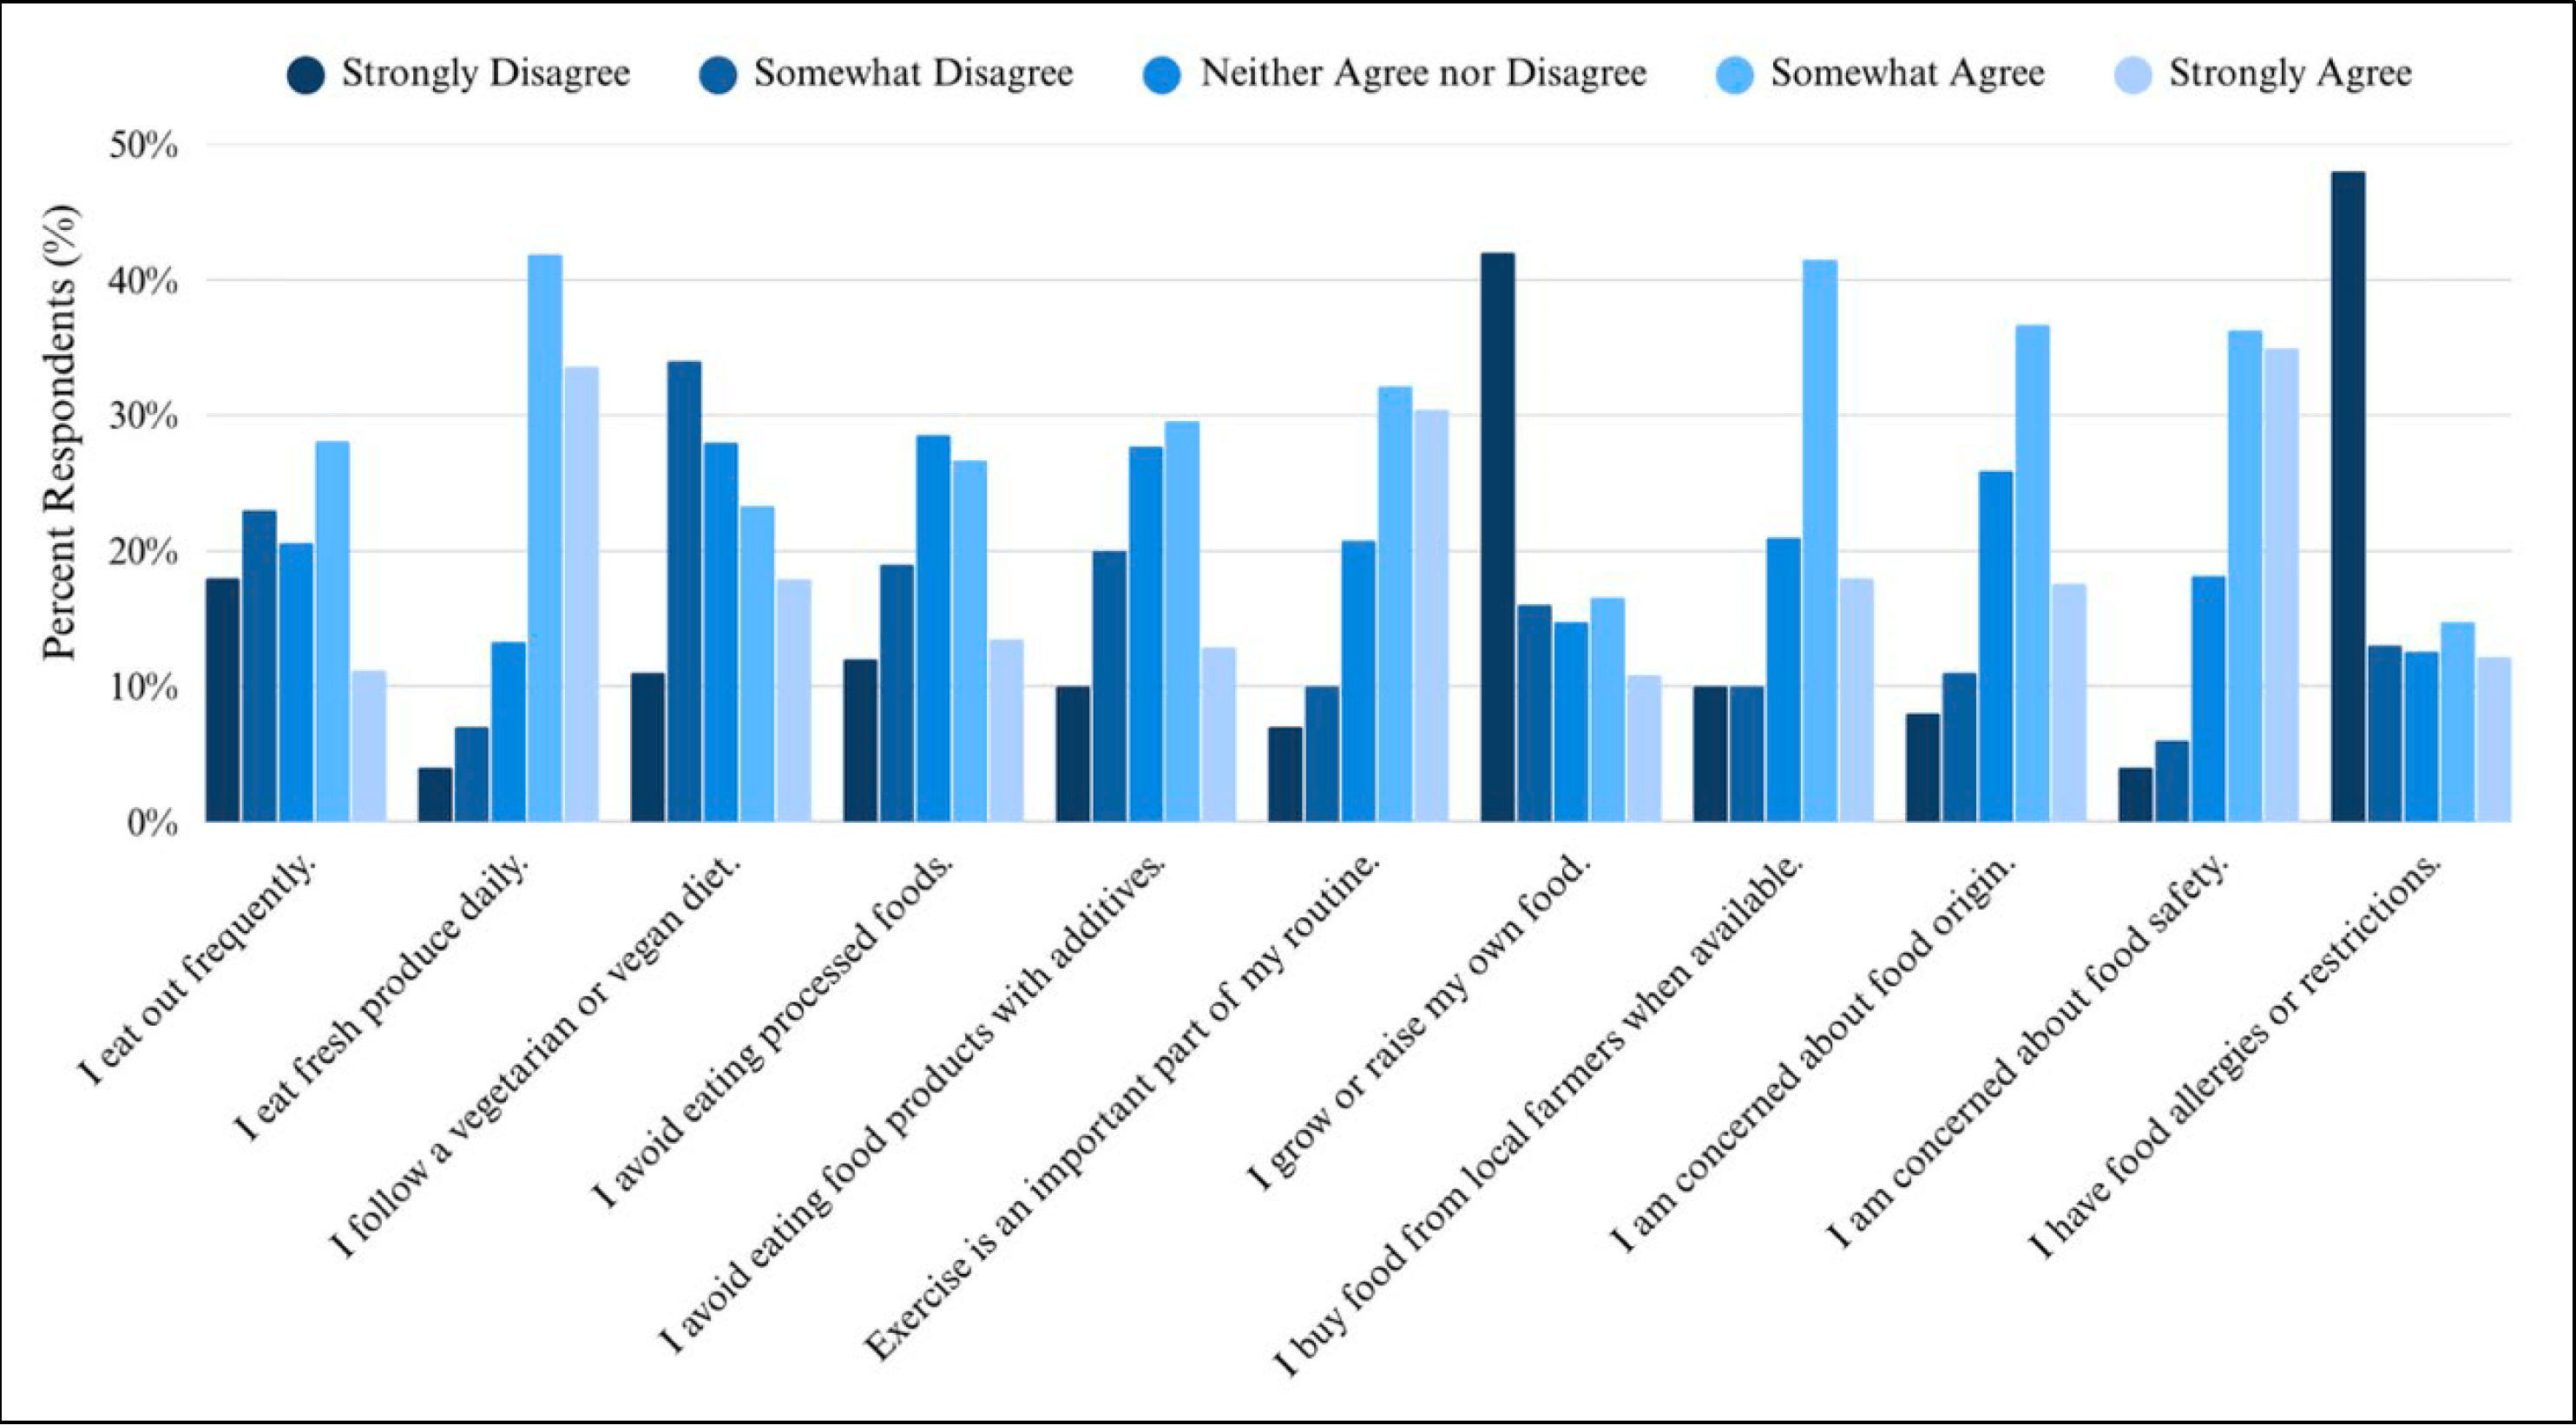
Product Characteristic and Labeling Preferences
Respondents were asked to indicate how often they review package labels and product information when making purchases (see Table 2). Respondents reported referring to front labels and package size labels most often. Nearly half of the respondents reported referring to package size (47%) and front labels (49%) most of the time or always when making purchase decisions. Allergy warnings were referred to the least often, which is likely related to the small proportion of respondents who reported having food allergies.
Table 2. Package Label/Information Review Frequency
| Label/Information | Never | Sometimes | Half of the Time | Most of the Time | Always |
|---|---|---|---|---|---|
| Nutrition Facts panel | 11.15% | 33.00% | 14.59% | 23.32% | 17.94% |
| Ingredient list | 9.59% | 30.73% | 20.36% | 22.46% | 16.85% |
| Serving size | 15.13% | 29.72% | 19.03% | 21.53% | 14.59% |
| Package size | 9.13% | 25.20% | 18.56% | 24.96% | 22.15% |
| Allergy warnings | 38.14% | 20.51% | 11.31% | 13.18% | 16.85% |
| Front labels | 10.84% | 24.57% | 15.91% | 24.96% | 23.71% |
Respondents were asked to indicate which product characteristics they consider when purchasing foods (see Figure 2). Taste and price were the primary characteristics considered important, with more than 80% of the respondents reporting that they considered taste or price in purchase decisions. Freshness and nutritional value were also important to more than half (50%) of the respondents. Appearance and size were also relatively important.
Figure 2. Product Characteristics of Importance in Purchase Decisions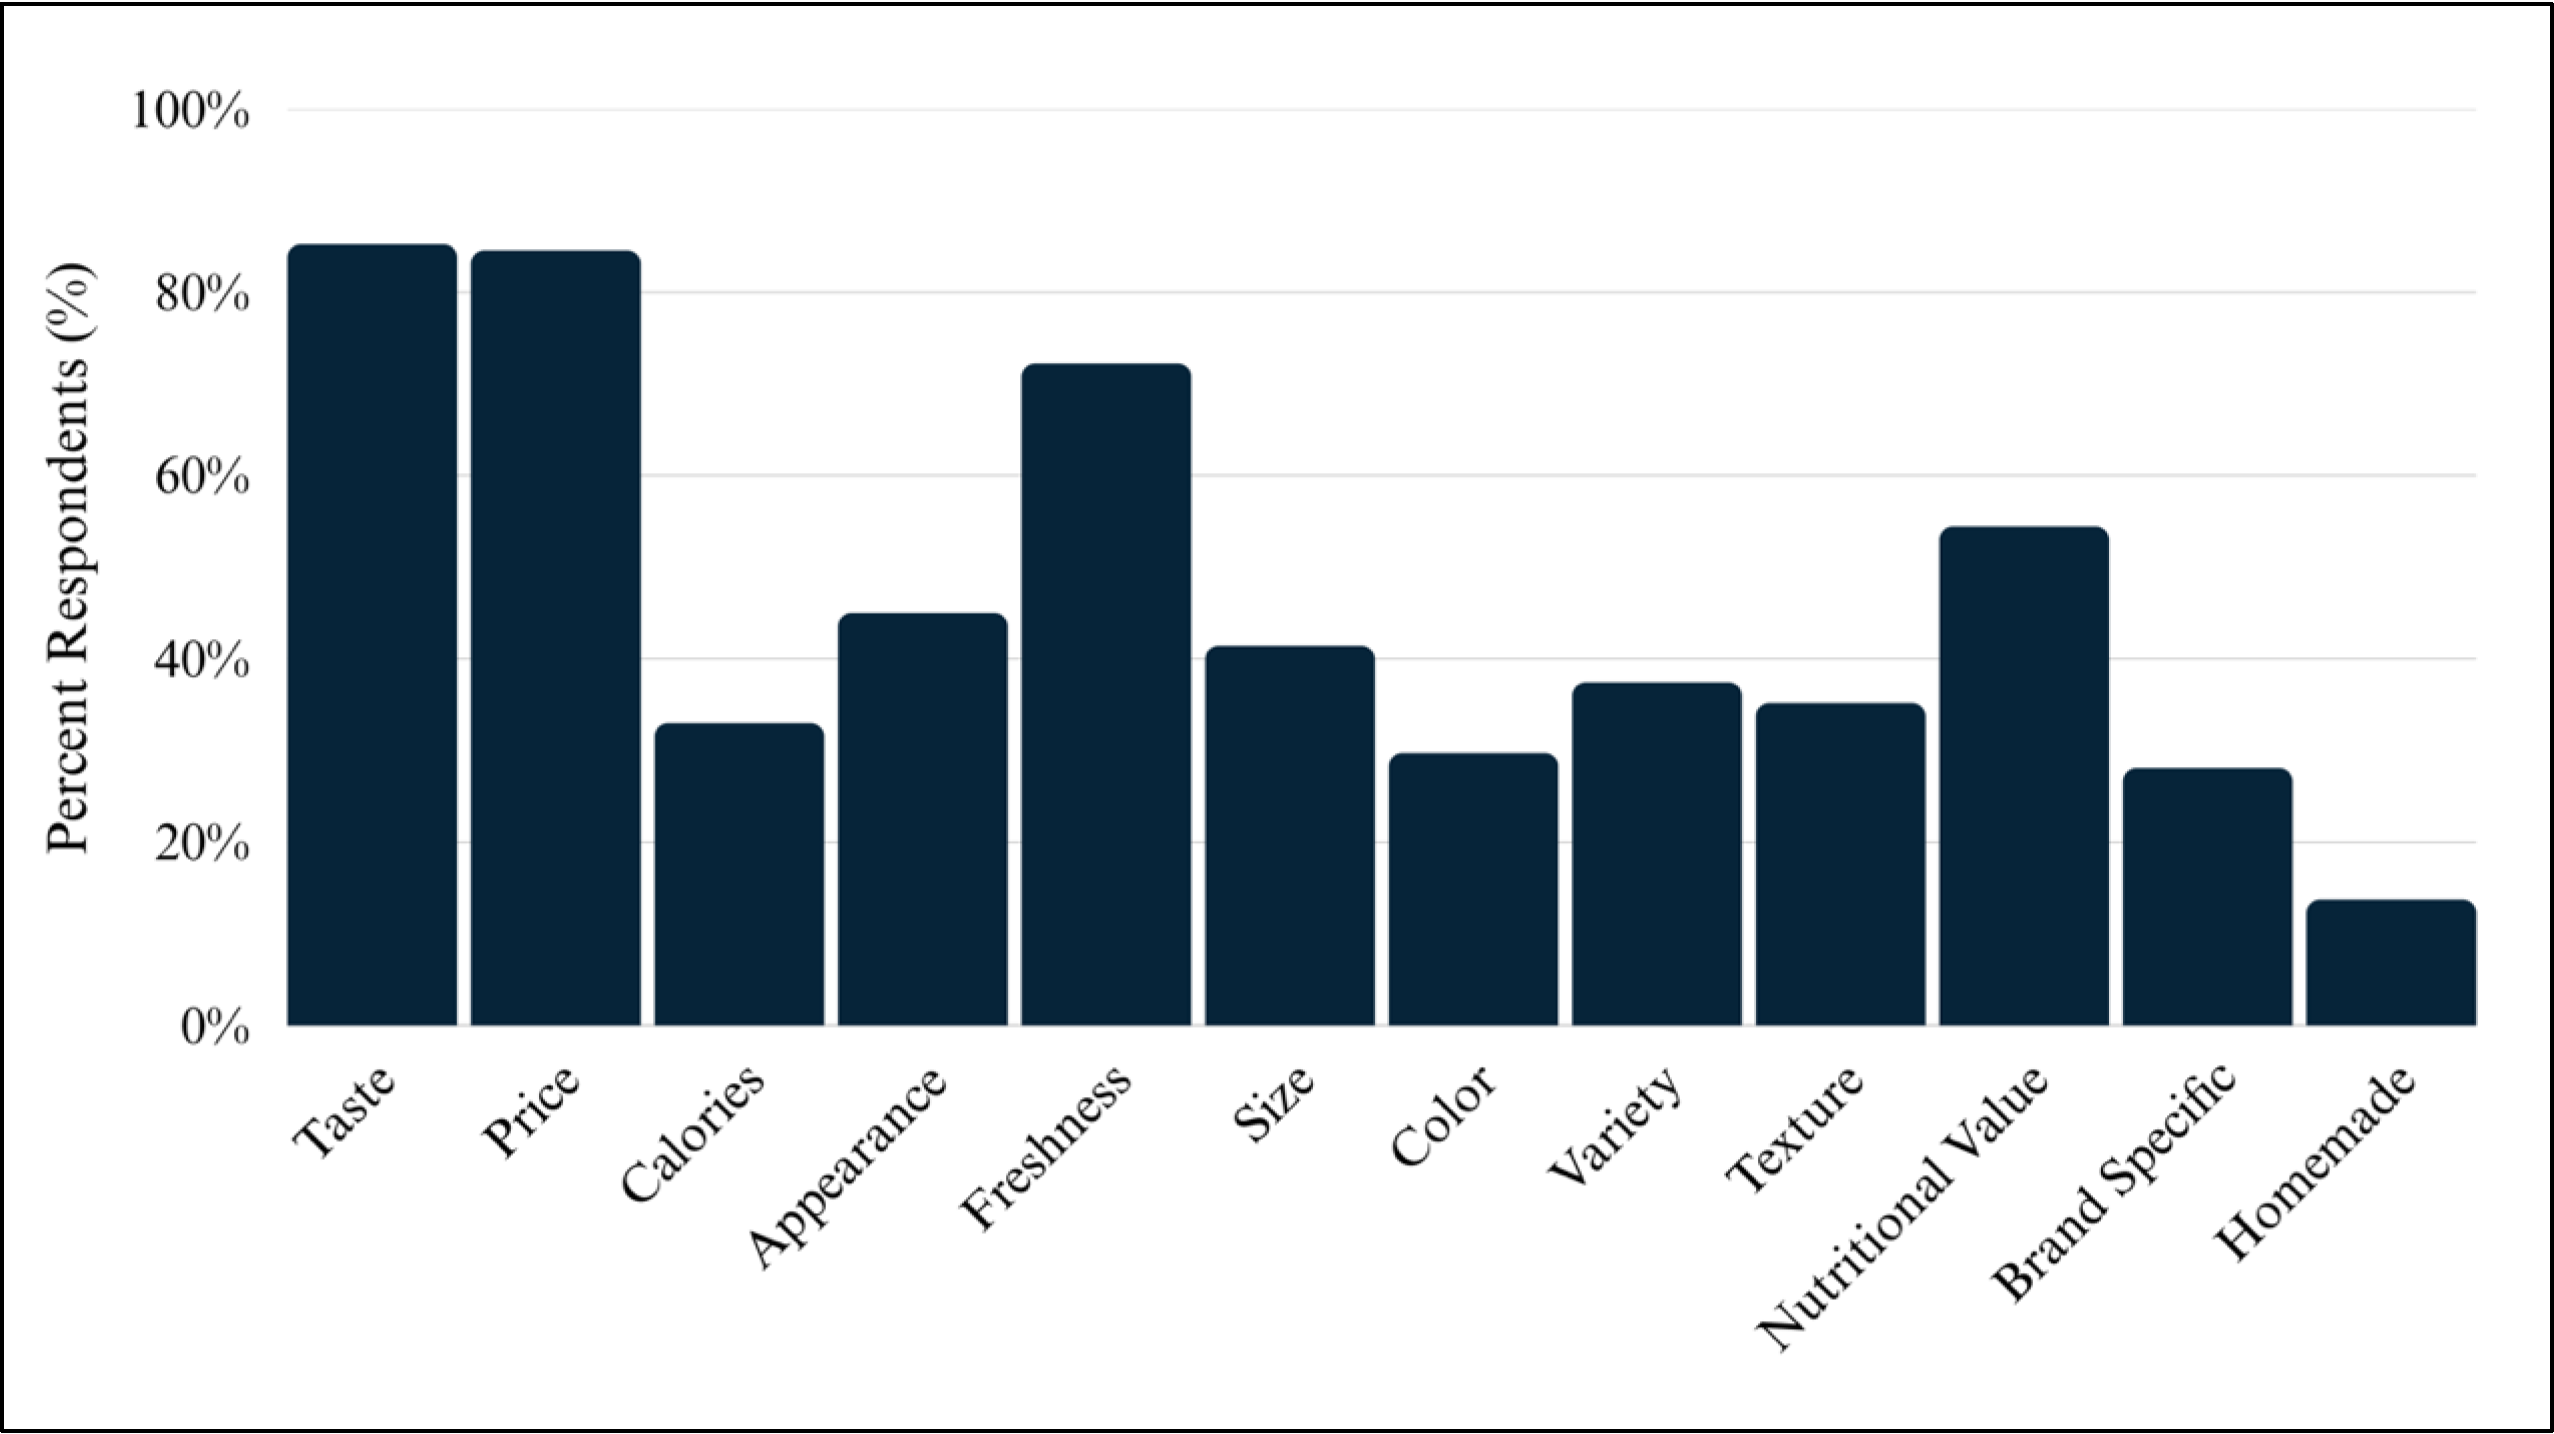

When asked about specialty labels important to them in food purchases, “natural” was the only label considered important by at least half of the respondents (see Figure 3). “Organic,” “local,” and “hearth healthy” labels were also important. Of the 15 different labels considered, 10 were considered important by at least a third (33%) of the respondents. The only labels that were not considered by at least a third (33%) of the respondents were “tree-ripened,” “sustainable,” “fair trade,” “pasture-raised,” and “eco-friendly.”
Processed Food Purchasing and Consumption Habits
Respondents were asked to discuss their consumption and purchasing habits related to three processed food products, namely bottled mild salsa, bottled tart cherry juice, and packaged beef jerky. Regarding consumption frequency, respondents reported consuming salsa most frequently, with 62% indicating that they had at least several servings of bottled salsa monthly. In comparison, only 42% of the respondents reported having at least several servings of beef jerky per month. Tart cherry juice was consumed least often, with more than half (53%) of the respondents reporting they do not consume tart cherry juice.
Figure 3. Product Specialty Labels of Importance in Purchase Decisions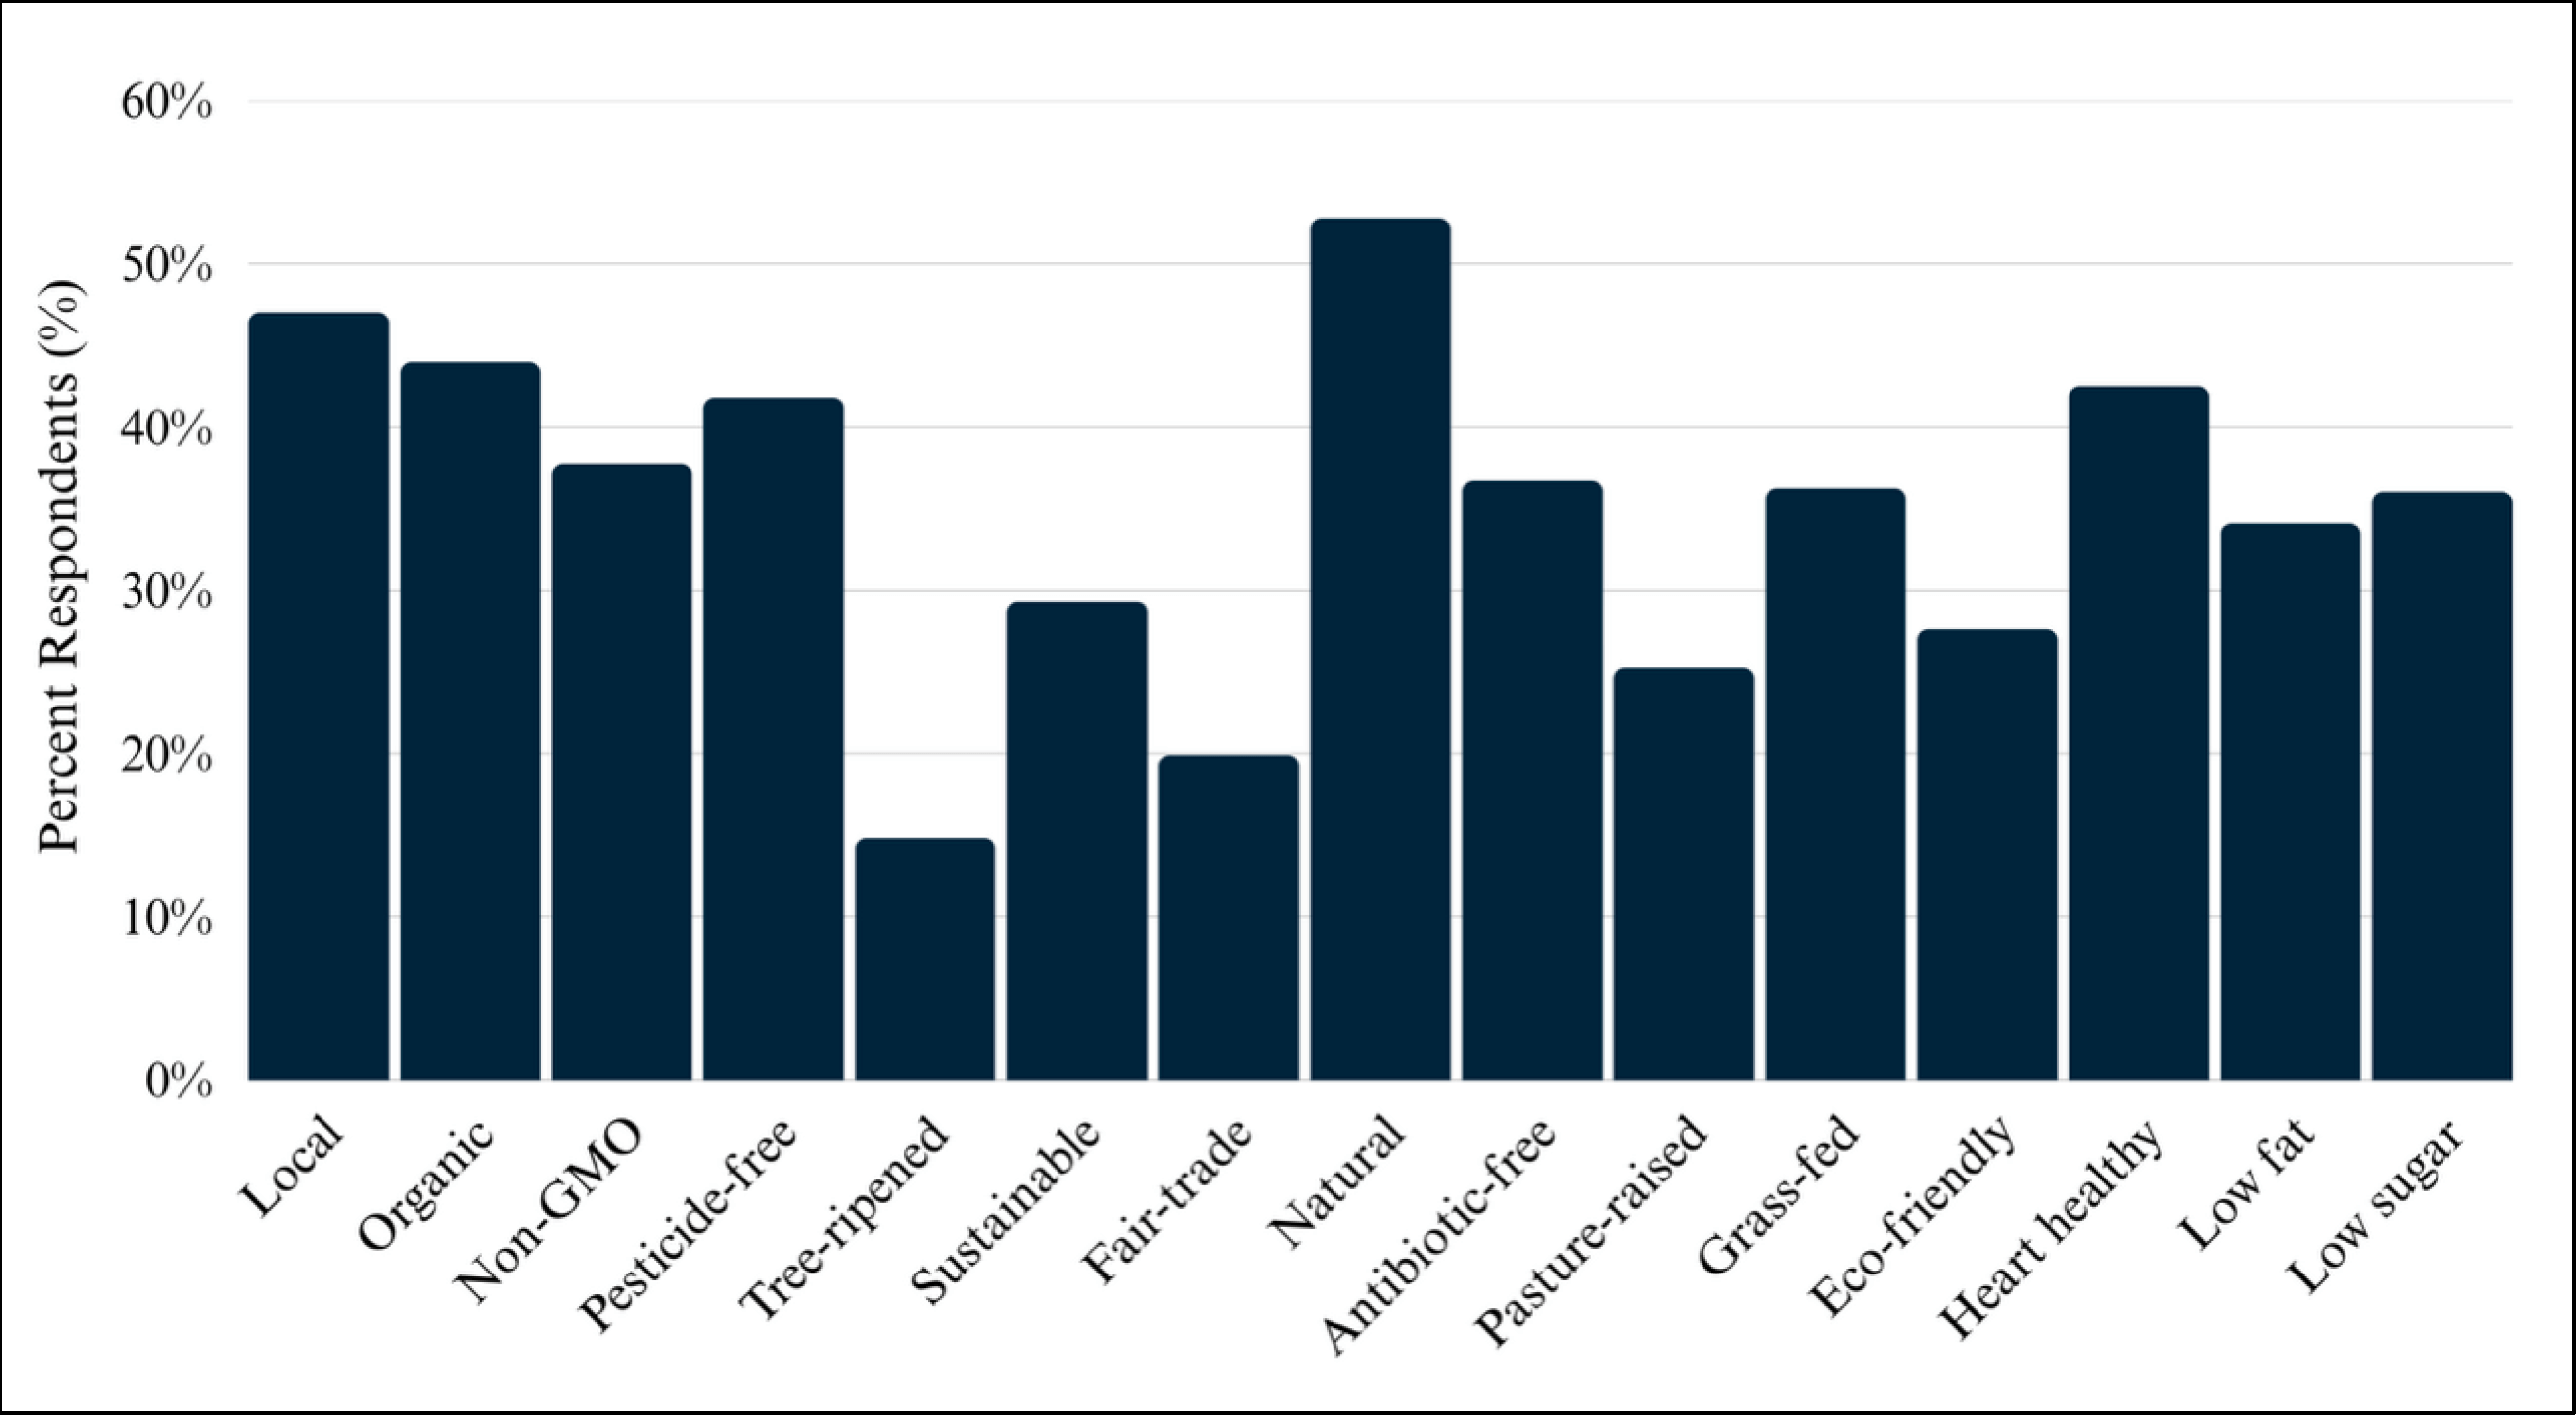
Respondents were asked to select their primary purchase location for each product (see Figure 4). Results show that for both beef jerky and salsa, grocery stores were the most common purchase location, followed by multipurpose stores, and warehouse stores. For salsa, all purchase locations were selected by at least 50% of the respondents. The most popular purchase location for tart cherry juice was local farms or orchards, including farm stores and cooperatives, followed by specialty stores and farmers markets. Thus, producers may be more successful selling tart cherry juice through direct-to-consumer or specialty markets.
In terms of expenditures, the average per purchase expenditure was the highest for beef jerky at $14.08. Respondents spent an average of $9.73 per purchase on tart cherry juice and $11.32 on salsa.
Figure 4. Common Purchase Location(s) by Product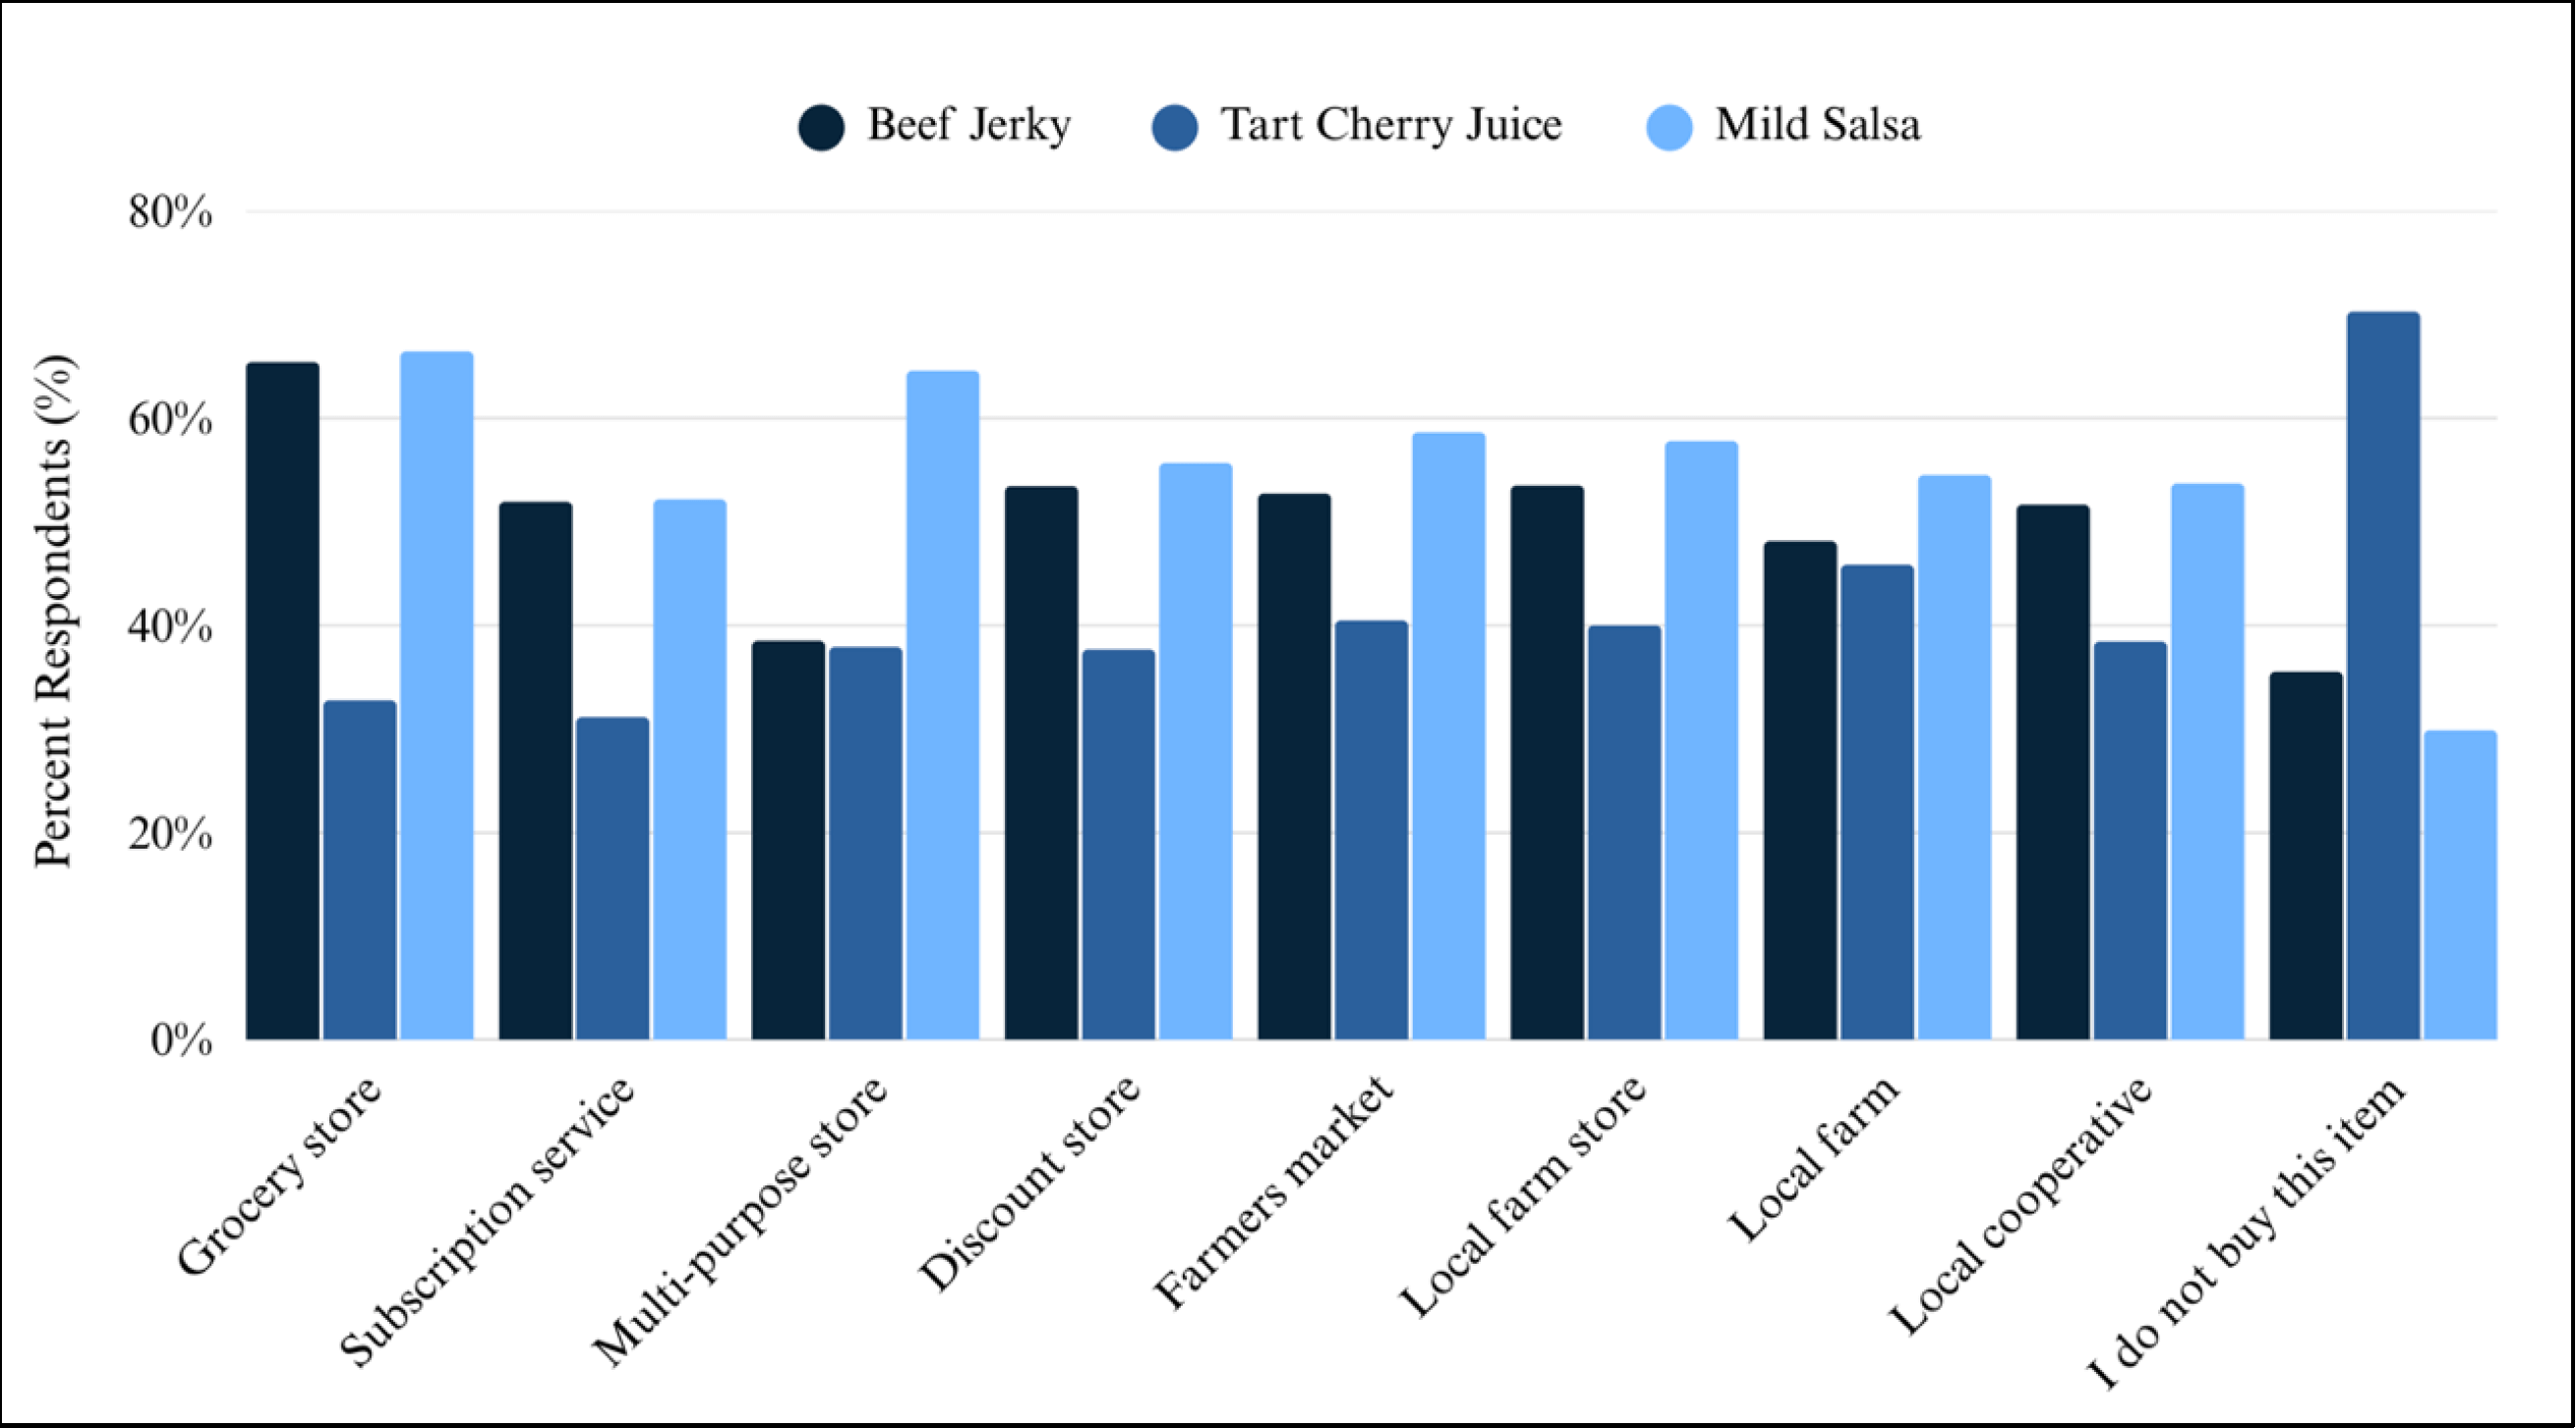
Conclusions
The results discussed here highlight that western U.S. consumers value taste, price, and product quality above all when making processed food purchases. Labels such as natural, local, and organic also resonate with many shoppers, reflecting an interest in health, nutrition, and food origin. Consumers frequently shop at grocery and multipurpose stores for common products like salsa and jerky, but they are also willing to purchase through direct-to-consumer channels, particularly for specialty items like tart cherry juice. These findings suggest that food makers can expand market opportunities by offering products that emphasize freshness, flavor, and trusted labeling, while also tailoring distribution strategies to product type.
Additionally, study results confirm that consumers are open to supporting local and regional food processors, especially when products align with their everyday lifestyles and health goals. Farmers markets, local farm stands/shops, and specialty outlets continue to be strong channels for reaching engaged buyers, while traditional retail ensures broad market access. By balancing affordability with strong product messaging and a mix of retail and local distribution, small and regional food processors can successfully meet consumer preferences and grow their market share.
Recommendations
Focus on product strengths.
- Focus on taste and quality first. Consumers rank taste and price as their top priorities. Emphasize flavor development and consistency.
- Highlight natural, local, or organic attributes. These labels resonate strongly, especially when paired with freshness and nutrition claims.
- Keep packaging simple but clear. Most shoppers read front labels, nutrition facts, and package sizing. Use these spaces to showcase key product benefits.
Use smart marketing messages.
- Tell your local story. Over half of consumers buy from farmers when possible. Share where your ingredients come from and how your product supports the local economy.
- Connect products to healthy lifestyles. Promote fresh, wholesome, and safe food practices and highlight how your product fits into healthy eating habits.
- Position products as versatile. Show how products can be used in everyday meals or snacks.
Sell at the right places.
- Sell at farmers markets and specialty stores, which are best for unique items like tart cherry juice or niche salsa recipes.
- Grocery and multipurpose stores are strong channels for salsa and jerky, where shoppers expect to find these items regularly.
- Direct-to-consumer options (farm stands, consumer-supported agriculture [CSA], and online sales) let you connect personally with your customers and reinforce your local identity.
- Engage online by sharing recipes, product origin stories, and customer spotlights on social media.
Acknowledgments
Funding for this publication was made possible by a grant/cooperative agreement from the U.S. Department of Agriculture (USDA) Agricultural Marketing Service. Its contents are solely the responsibility of the authors and do not necessarily represent the official views of the USDA.
The authors used ChatGPT to generate the “Recommendations” section from the fact sheet text, which the authors edited to ensure accuracy. Authors take full responsibility for the content.
References
- Healthcare.gov. (2025). Glossary: Federal poverty level (FPL). U.S. Centers for Medicare and Medicaid Services. https://www.healthcare.gov/glossary/federal-poverty-level-fpl/

November 2025
Utah State University Extension
Peer-reviewed fact sheet
Authors
Makaylie Langford, Research Assistant, Department of Applied Economics; Kynda Curtis, Professor and USU Extension Specialist, Department of Applied Economics; Karin Allen, Associate Professor and USU Extension Specialist, Department of Nutrition, Dietetics, and Food Sciences; Ruby Ward, Professor and USU Extension Specialist, Department of Applied Economics

Kynda Curtis
Food Systems Specialist
APEC Dept

Karin Allen
Food Quality & Entrepreneurship Specialist
NDFS Dept

Ruby Ward
Agricultural Entrepreneurship Specialist
APEC Dept
Related Research

Agricultural Producer and Food Maker Food Processing Operation Needs Assessment Overview
Utah State University’s 2024 needs assessment explores the educational, funding, and infrastructure needs of Utah farmers, ranchers, and food makers involved in value-added food production. Results highlight respondent demographics, products, markets, lab

Assessing Utah's Agricultural Producer and Small Processor Interest in Value-Added Food Production
This fact sheet presents findings from a study on value-added food production among Utah farmers, ranchers, and food processors. Highlighting operational characteristics, production timelines, markets, sales goals, and key resources needed to support loca

Target Consumers for Beef Jerky
This study identifies the target market for packaged beef jerky in the western U.S., highlighting consumer demographics, purchasing habits, and willingness to pay premiums for organic, grass-fed, and locally sourced products.

Target Consumers for Bottled Mild Salsa
This fact sheet summarizes USU research on western U.S. consumers who purchase mild salsa, highlighting their demographics, food habits, and preferences. Target consumers are middle-aged, highly educated, engaged in local food systems, and willing to pay

Target Consumers for Bottled Tart Cherry Juice
This fact sheet provides an overview of the study results conducted by Utah State University to determine western U.S. consumer preferences and willingness to pay for regionally sourced processed food products. This fact sheet addresses target consumers f
U.S. West Consumer Preferences for Specialty Labeled Processed Foods
Highlighting consumer preferences and willingness to pay for specialty-labeled processed foods, including organic, local, grass-fed, and non-GMO products. Survey results show strong consumer value for health, safety, freshness, and transparency, especiall
U.S. West Consumer Processed Food Preferences and Consumption Habits
This article summarizes a 2024 Utah State University study examining processed food preferences and purchasing behaviors among 1,282 consumers across the western United States. Findings highlight key values such as taste, price, product quality, and trust
Utah's Value-Added Food Processing Options
Explaining what value-added foods are and how producers can increase profit through processing, direct marketing, and vertical integration. Also outlining Utah’s regulatory options and programs to help small food businesses choose the right path for produ