Agricultural Producer and Food Maker Food Processing Operation Needs Assessment Overview

Introduction
Respondent Categories Defined
Farmers:
Farmers include agricultural operations involved in crop-based food and fiber production.
Ranchers:
Ranchers include agricultural operations involved in livestock production, including milk.
Food processor:
Food makers include operations involved in processing food or food products for human consumption.
To identify the educational, funding, and infrastructure needs of Utah’s farmers, ranchers, and food makers related to value-added food production and processing, Utah State University (USU) conducted a needs assessment study where data was collected through two online surveys conducted in early 2024. The first survey targeted farmers and ranchers who currently produce or are considering producing value-added products. A total of 426 farmers and ranchers completed the survey, of which 134 farmers and 69 ranchers were involved in or planning to engage in food processing activities. The second survey, distributed to food processors across Utah, received 89 responses, with 50 participants currently producing or planning to produce value-added foods.
While customized for each audience, the surveys were very similar. Questions focused on operational characteristics such as location, years in business, number of employees, and annual sales. Respondents were also asked about their current products and markets, the rationale for adding processed or value-added products, and—if applicable—processed products, sales goals, timelines, and market and specialty labeling programs used. Additional questions explored the tools and resources most useful to their operation, those that were difficult to access, and the main challenges or obstacles they face in their processing business.
This fact sheet provides an overview of the survey results related to respondents, their operations, products, and marketing outlets. It also discusses respondents’ familiarity with key regulatory and resource organizations, the types of products and business resources they find difficult to obtain or access, and the primary obstacles or hurdles to their processing operations. These results can be used by Extension faculty, policymakers, agricultural organizations, and local economic development agencies to guide targeted support for Utah’s farmers, ranchers, and food makers, including shaping new training programs, funding opportunities, and infrastructure investments. Educators and resource providers can also use study findings to design more effective outreach materials and regulatory guidance. Overall, the study offers a foundation for coordinated efforts to strengthen Utah’s value-added food sector and enhance the long-term sustainability and profitability of local agricultural operations.
Results Overview
Respondent Demographics and Operation Details
As shown in Table 1, most survey respondents were the owner/operator of the operation or at least involved in administration or management. A higher proportion of farmers had a college or graduate degree: 64% compared to 53% of ranchers and 32% of food processors. While farmers were evenly divided between those with a farming/ranching background and those without, the majority (93%) of the ranchers came from such backgrounds. In terms of the operation’s primary owner gender, farmers were evenly divided between men and women, and food processors had somewhat more women than men, but men owned the majority (93%) of the ranches.
Table 1. Respondent Demographics by Operation Type
| Characteristic | Category | Processors (n = 50) | Ranchers (n = 69) | Farmers (n = 134) |
|---|---|---|---|---|
| Gender primary owner |
Prefer not to answer Man Woman Non-binary Prefer to self-describe |
5% 39% 52% 0% 5% |
5.3% 81% 12.2% 0% 1.8% |
4.6% 46.8% 45% 0% 3.7% |
| Education level | Prefer not to answer Less than high school High school diploma/GED Associate’s degree/some college College degree (BS, BA, etc.) Graduate degree (MS, PhD, etc.) |
2.3% 6.8% 16% 43% 30% 2.3% |
3.5% 0% 15.8% 28.1% 26.3% 26.3% |
1.8% 0% 4.6% 29.4% 36.7% 27.5% |
| Owner from farming background |
Unsure No Yes |
NA | 0% 7% 93% |
2.8% 48.6% 48.6% |
| Role in operation | Owner/partner General manager/CEO Marketing manager Distribution/logistics manager Production manager Administration Other |
88% 2% 2% 0% 0% 0% 8% |
79.7% 5.8% 3% 0% 1.5% 4.4% 5.8% |
76.6% 2.9% 4.4% 0% 2.9% 4.4% 8.8% |
More ranchers than farmers ran a multigenerational operation, as more than half (54%) had been in business for four generations or more, compared to only 22% of the farmers. Unsurprisingly, on average, ranchers had been in business longer than farmers or food processors, as more than two-thirds (68%) of the ranchers had been in business for 20 years or more, compared to only 40% of the farmers and 18% of the food processors (see Table 2).
More than 3 times as many processors and farmers as ranchers were located along the Wasatch Front. This is likely related to this region’s population density and the availability of suitable farmland, while land further east is better suited to ranching. The southern half of the state was less popular among all groups, with Southeastern Utah reported least often by food processors and farmers, and Southwestern Utah reported least often by ranchers.
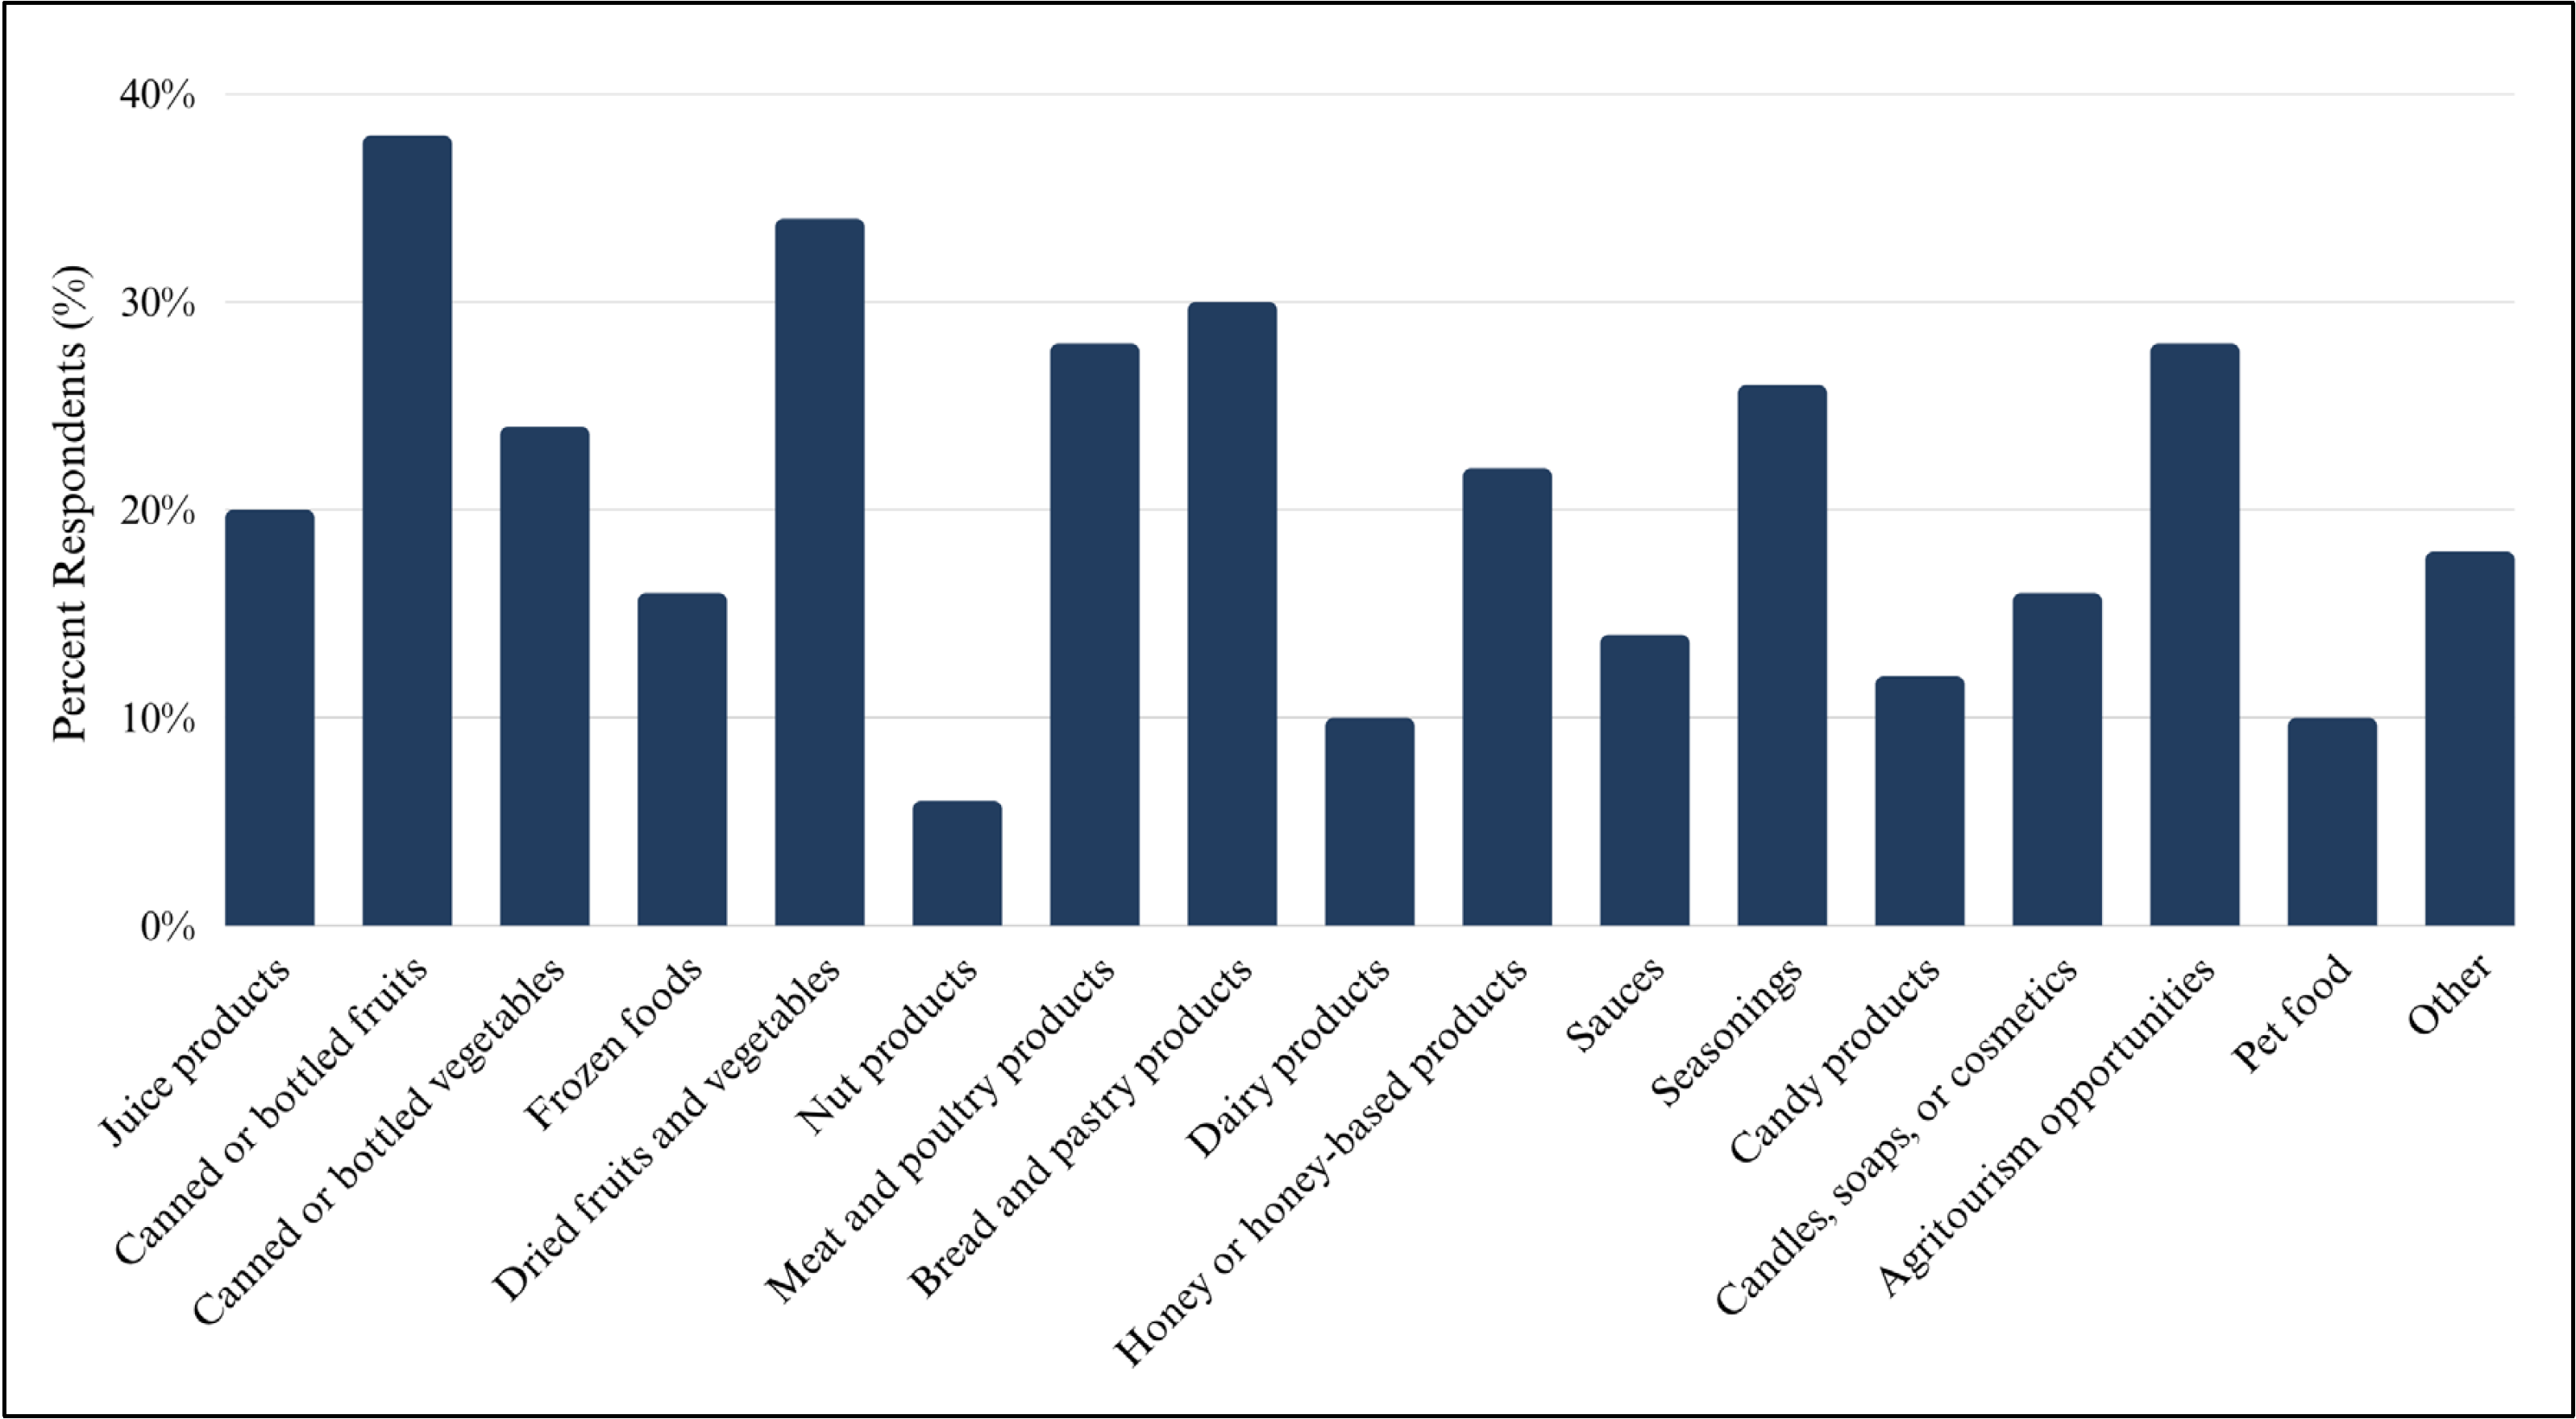
In terms of their products, nearly all (94%) of the ranchers reported producing meat and poultry products, and more than half (55%) reported producing hay or alfalfa. More than half (55%) of the farmers produced fresh produce, and more than a third (35%) produced flowers or ornamentals. Processors were more likely to produce canned or bottled fruits, dried fruits and vegetables, bread and pastry products, and meat or poultry products (see Figure 1). Seasonings, agritourism, and canned/bottled vegetables were also popular. Feed lots, auction houses, and online websites were the most popular sales outlets for ranchers. Farmers markets and CSA programs were the most popular markets for both farmers and food processors, and both groups also frequently sold products online or via wholesale brokers.
Table 2. Operation Details by Operation Type
| Characteristic | Category | Processors (n = 50) | Ranchers (n = 69) | Farmers (n = 134) |
|---|---|---|---|---|
| Years in operation | None/still planning Less than 1 year 1–5 years 6–10 years 11–20 years More than 20 years |
18% 4% 36% 10% 14% 18% |
- 1.5% 13% 7.3% 10.1% 68.1% |
- 8.2% 30.6% 9% 11.9% 40.3% |
| Operation location | Northern Utah West-Central Utah Southwestern Utah Wasatch Front Uintah Basin East-Central Utah Southeastern Utah |
18% 10% 10% 36% 10% 10% 8% |
38.2% 17.4% 1.5% 11.6% 13% 13% 4.4% |
18.6% 11.3% 10.5% 44.4% 5.7% 6.6% 3.2% |
| Primary products produced |
Fresh produce Fruits or nuts Livestock and poultry Flowers or ornamentals Dairy Bees or honey Eggs Grains Hay or alfalfa Processed foods Non ag/food product Other |
See Figure 1 | 2.9% 0% 94.2% 1.5% 4.4% 5.8% 12% 13% 55% 1.5% 0% 4.3% |
56% 30.6% 14.2% 35.1% 4.5% 10.5% 17.1% 13.4% 21.6% 11.2% 1.5% 10.5% |
| Markets/Sales outlets |
Local elevators/cooperatives Feed lots/auction houses Hay brokers/feed buyers Wholesale buyers/brokers Online (via websites) Grocery stores Restaurants/schools Farmers markets/CSAs Farm stands/shops/stores Agritourism venues Retail stores Other |
- - - 38% 60% 26% 34% 60% 34% 28% 14% 14% |
11.6% 73.9% 23.1% 15.9% 33.3% 4.4% 3% 10.1% 5.8% 5.8% 5.8% 21.7% |
10.5% 7.5% 10.4% 28.4% 28.4% 16.4% 12% 47.8% 36.8% 18% 11.2% 11.2% |
More than three-quarters (78%) of the processors and more than half (55%) of the farmers used local labeling programs, such as Utah’s Own™ (see Figure 2). The most popular labeling program among the ranchers was “natural,” which was used by a third (35%) of the respondents. The “organic” labeling program was least popular for ranchers, “allergen-free” was least popular for farmers, and “hormone-free” was least popular for food processors. Although not included in the survey of farmers and ranchers, when asked about using local ingredients in their products, half of the food processors reported using or planning to use exclusively locally grown or sourced ingredients, and none of the respondents indicated they don’t use local ingredients.
Operation Challenges and Resource Access Issues
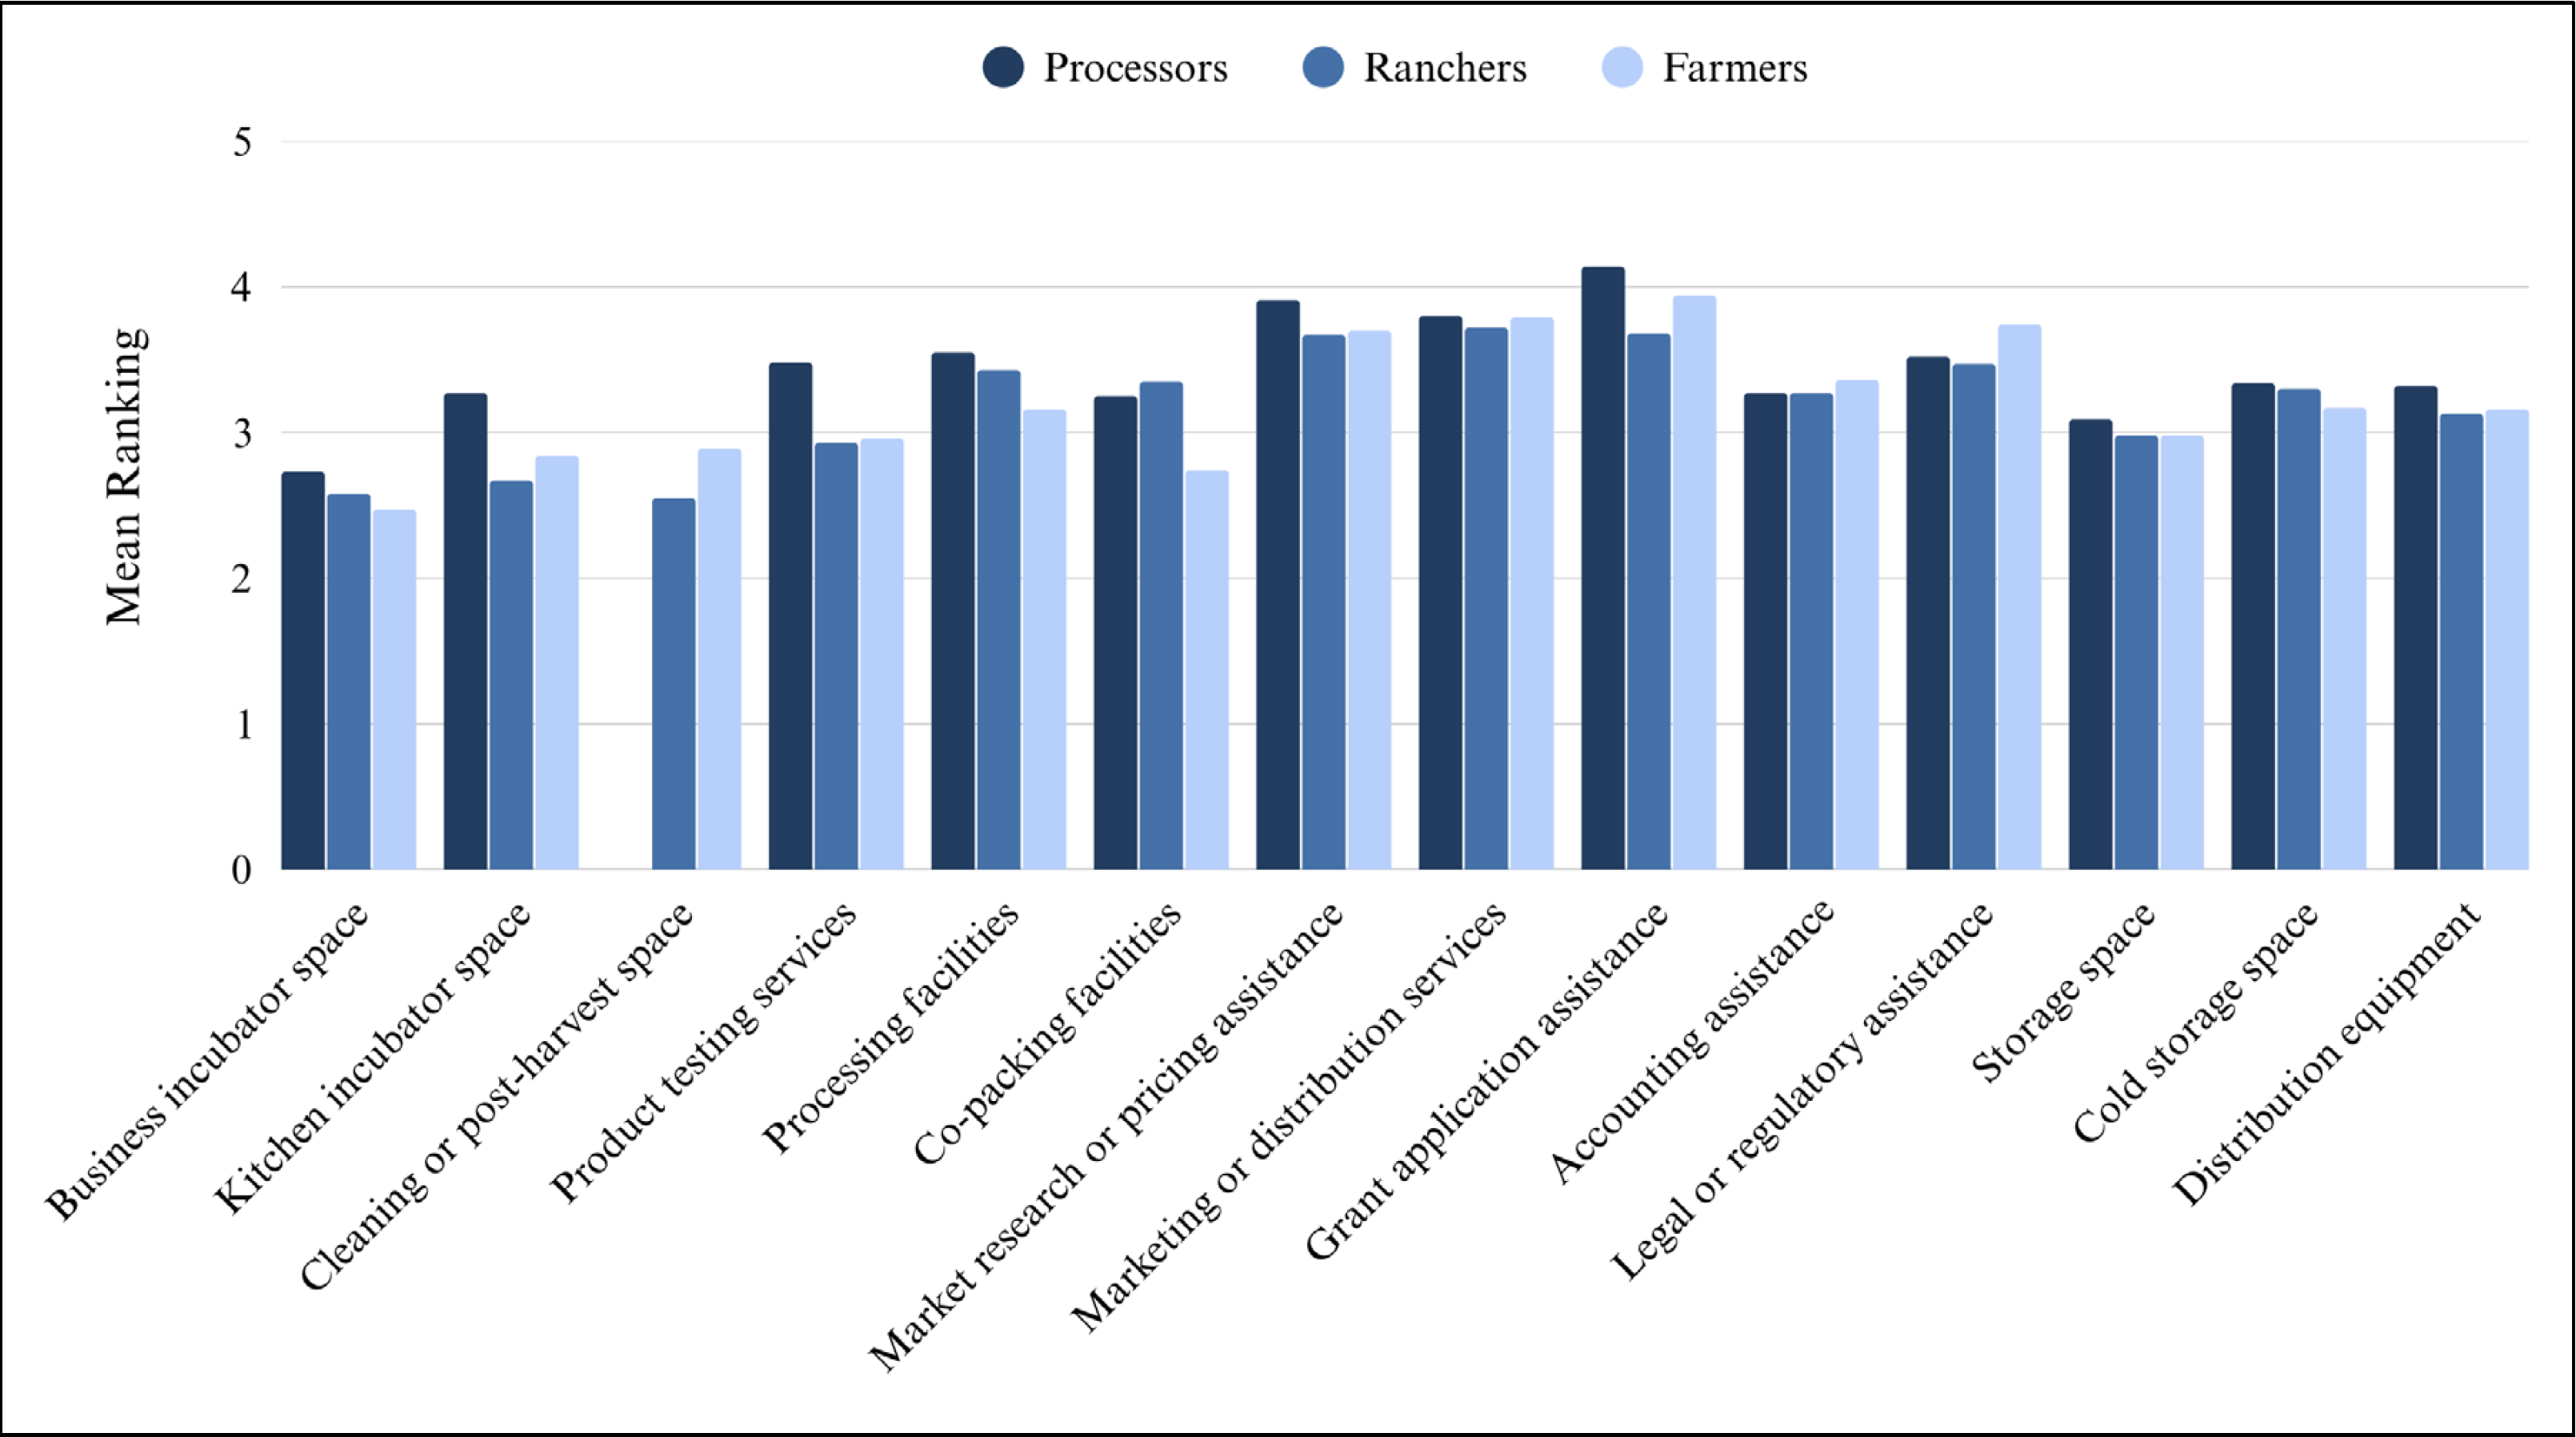
Survey respondents were asked to rate their agreement from strongly disagree to strongly agree (scale of 1 to 5) on whether the obstacles given were a significant hurdle to them in implementing a processed food operation. As shown in Figure 3, many of the available options were highly ranked (close to 4 on a 1-to-5-point scale). The highest-ranked obstacle for all three groups was transition costs and time, followed closely by processing/packaging facilities, and time/learning curve. The lowest-ranked obstacle for farmers and food processors was water availability, while the lowest-ranked obstacle among ranchers was labeling requirements.

Note. The mean ranking is on a scale of 1 to 5 (strongly disagree to strongly agree). For example, a mean ranking of 2.0 for land availability would indicate that, on average, respondents disagreed with the statement “Land availability is a significant obstacle for your current or proposed processed food operation.”
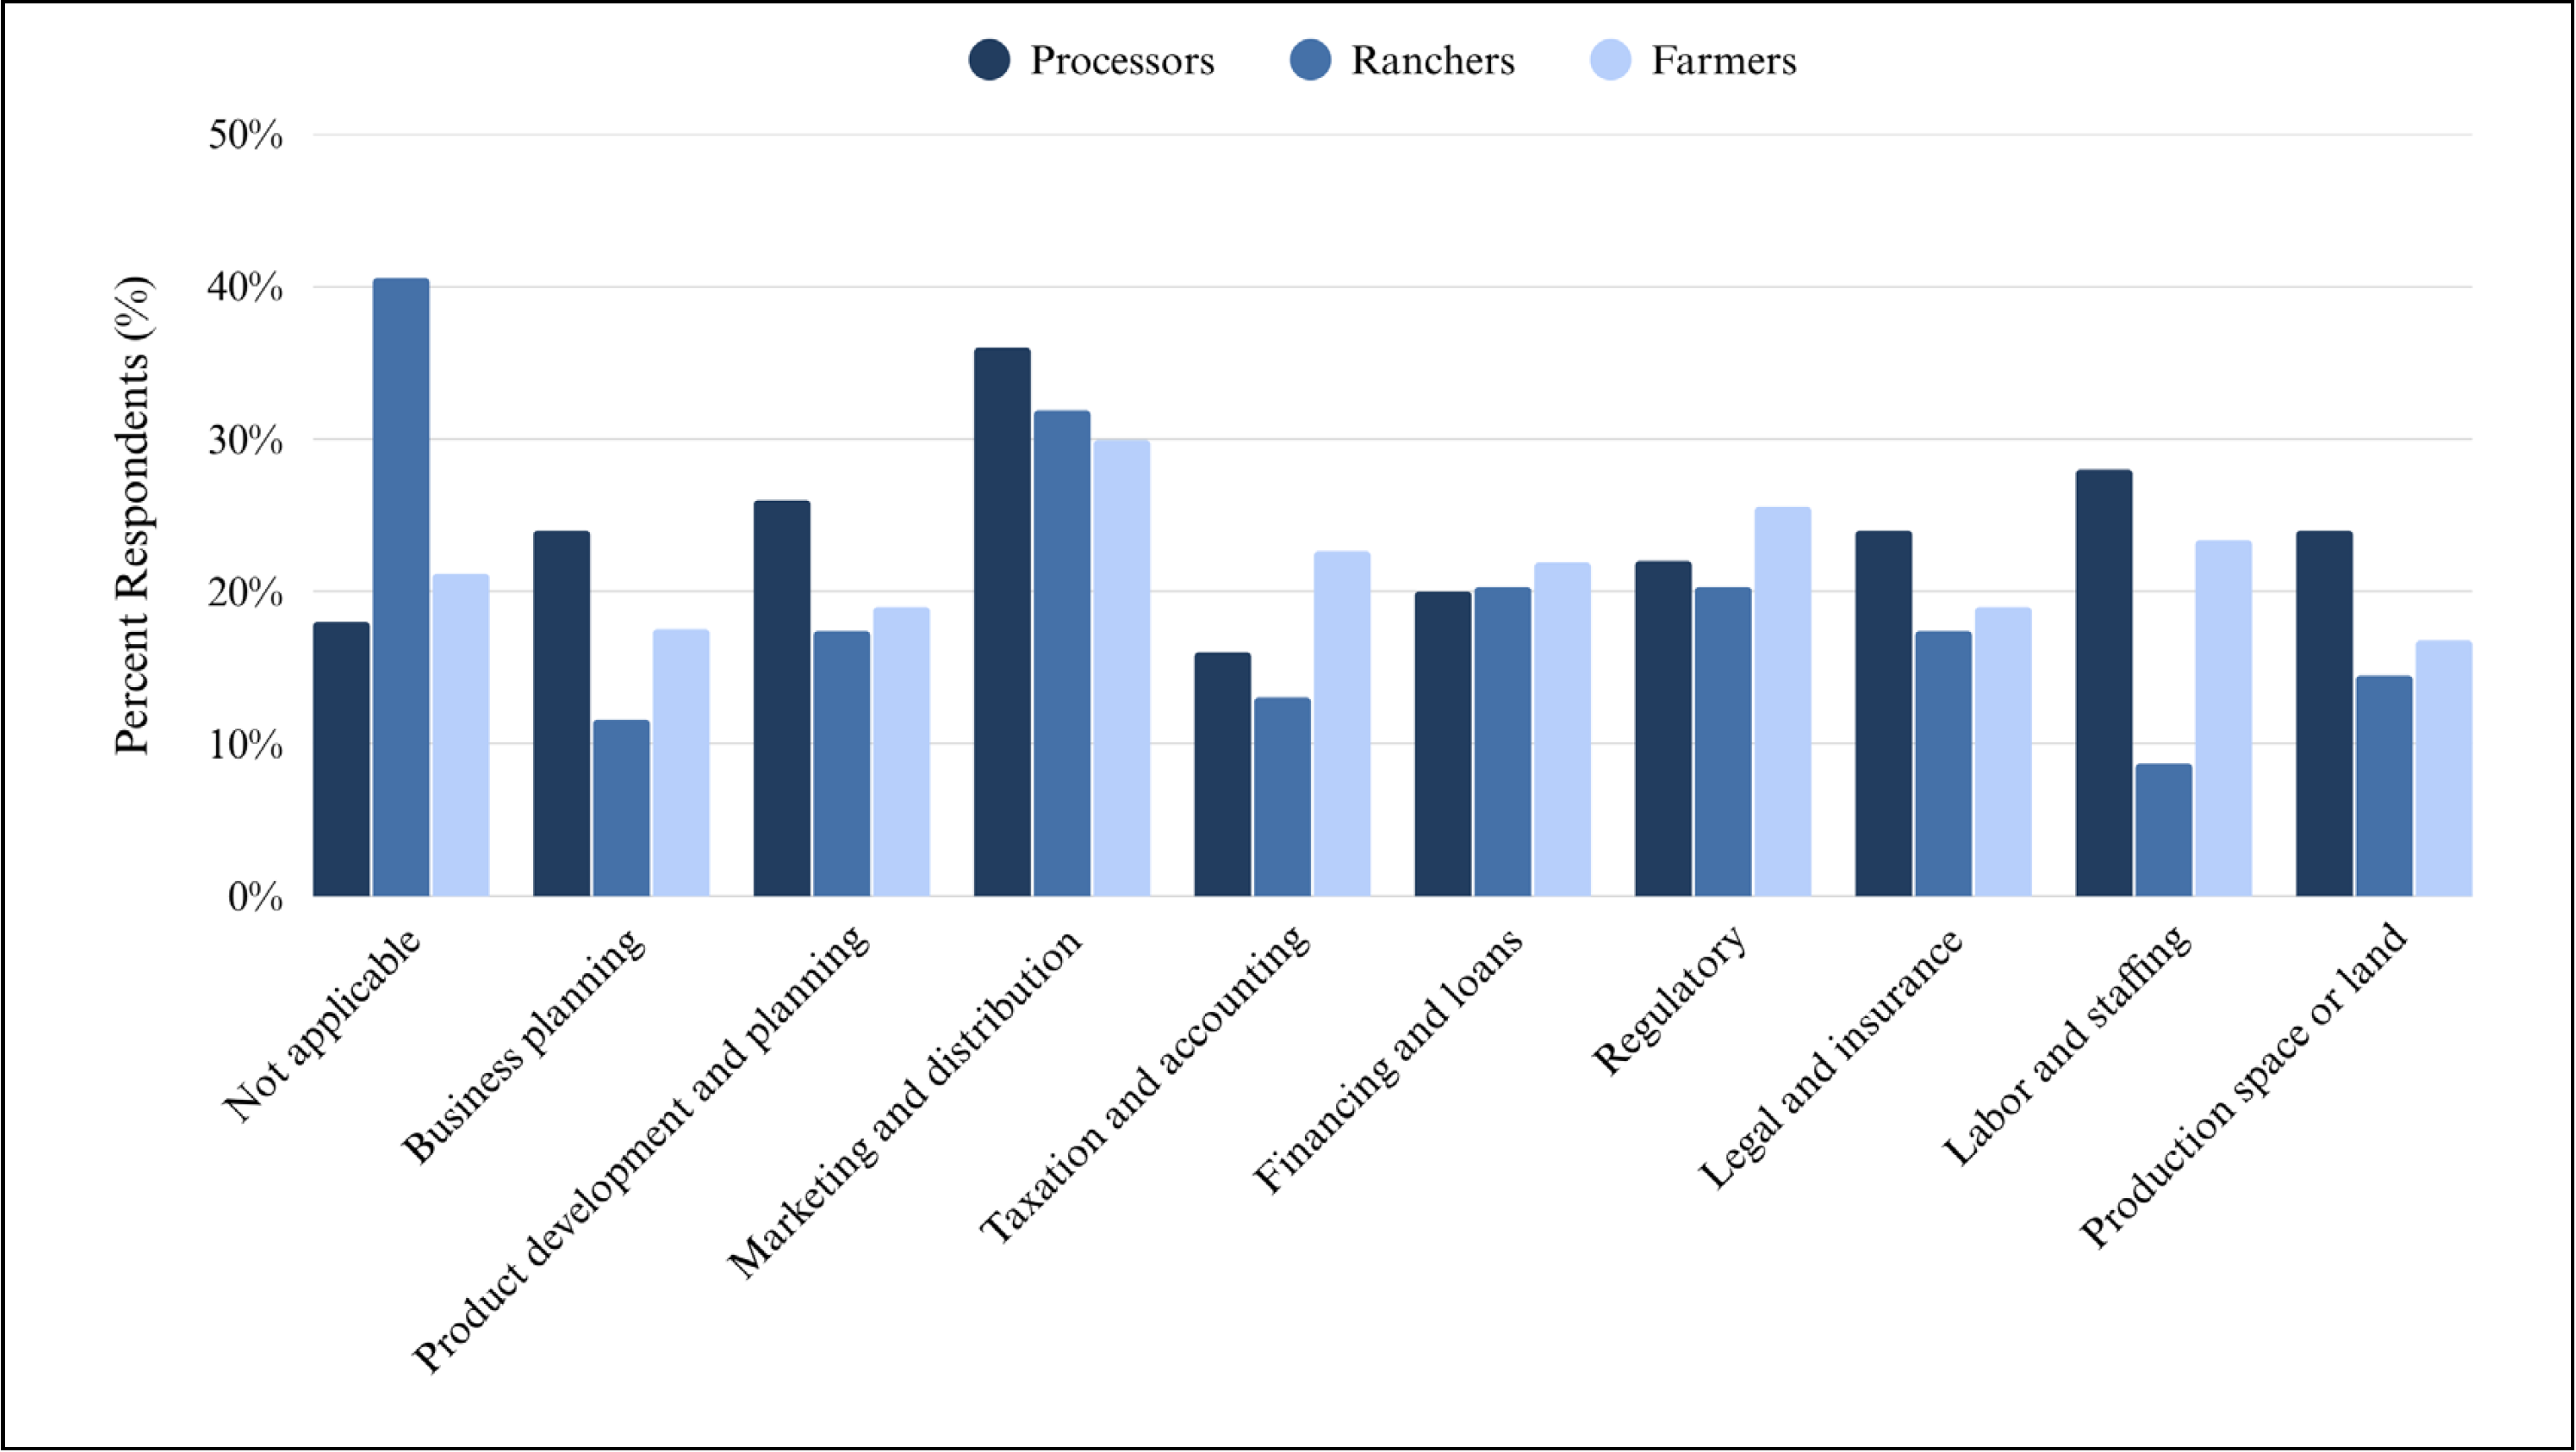
When queried about business-related resources they had difficulty accessing, ranchers reported significantly less difficulty accessing labor and staffing than food processors and farmers (see Figure 4). Processors had greater difficulty accessing business planning resources, and farmers had more difficulty accessing labor/staffing and taxation/accounting resources. Marketing and distribution resources were the most difficult to access for all groups.
For product-related resources, a significantly larger proportion of food processors had difficulty accessing product-testing resources and recipe or formulation assistance (see Figure 5). Perhaps farmers and ranchers are more likely to sell raw or minimally processed products that do not require as much testing. Fewer farmers had difficulty accessing packaging resources than ranchers or food processors, perhaps because their products do not require as much packaging or the available packaging facilities are better suited to their products. Three times as many farmers and processors had difficulty accessing preservation and storage resources.

Respondents were asked to rate their familiarity with regulatory- and resource-providing organizations on a scale of 1 to 5 (not at all familiar to very familiar). As shown in Figure 6, all three groups were very familiar with the Utah Department of Agriculture and Food (UDAF) and Utah State University (USU) Extension. Ranchers and farmers were less familiar with local/regional health departments and the Utah Small Business Development Centers (SBDC) than the processors. All three groups were least familiar with Utah Service Corps of Retired Executives (SCORE) and rarely employed private consultants.

Note. The mean ranking is on a scale of 1 to 5 (not at all familiar to very familiar). For example, a mean ranking of 3.0 for USU Extension would indicate that, on average, respondents were somewhat familiar with USU Extension services, programming, etc. Utah SCORE provides business mentoring and educational opportunities in Utah.
Conclusions
The results discussed here highlight both the diversity and the shared challenges among Utah’s farmers, ranchers, and small food processors. While these groups differ in background, scale, and product focus, they all demonstrate a strong interest in developing value-added food products. The findings reveal that many operations are smaller and family-run, with most respondents engaged in direct-to-consumer markets, such as farmers markets, CSAs, or online sales. The results also show that all groups face significant challenges in accessing processing facilities, managing transition costs, and navigating the time and learning required to expand into value-added foods production.
Overall, the study emphasizes a need for improved access to both business and product-related resources, including marketing, distribution, packaging, and processing support. Enhanced training and guidance on regulatory requirements, financing, and product development would help producers and processors overcome barriers to growth and profitability. The results point to an opportunity for Extension faculty, industry partners, and policymakers to collaborate on expanding infrastructure, technical assistance, and educational resources tailored to Utah’s agricultural and food processing sectors. Supporting these needs will enhance local food production capacity, stimulate rural economies, and promote sustainable agricultural development across the state.
Recommendations
Expand access to processing and packaging facilities.- Develop shared-use or regional processing centers to reduce start-up costs for small producers.
- Support mobile or cooperative facilities that can serve remote or rural areas.
- Offer grants, low-interest loans, or cost-sharing programs for equipment, facility upgrades, and certifications.
- Create funding opportunities specifically targeted at first-time value-added producers.
- Provide workshops and online training focused on business planning, pricing, branding, and market development.
- Support education on digital marketing and e-commerce to help producers expand online sales.
- Expand resources for recipe formulation, product testing, and food safety certification.
- Develop partnerships with universities, food labs, and incubators to assist with research and innovation.
- Create easy-to-follow guides and checklists for navigating state and federal food processing regulations.
- Offer one-on-one consultations or “regulatory navigation” assistance for new or expanding operations.
- Establish mentorship programs pairing experienced processors with emerging entrepreneurs.
- Facilitate regular producer–processor networking events and peer learning opportunities.
- Promote Utah’s Own, USU Extension, and SBDC resources through coordinated outreach.
- Provide centralized, accessible information on all available technical and financial support programs.
- Support training programs in food processing skills and workforce readiness. • Encourage partnerships between local governments, industry, and educational institutions to expand infrastructure capacity.
- Foster cooperation between agricultural producers, local food makers, and distributors to create strong value chains.
- Support local food aggregation networks to improve market access for smaller operations.
Acknowledgments
Funding for this publication was made possible by a grant/cooperative agreement from the U.S. Department of Agriculture (USDA) Agricultural Marketing Service. Its contents are solely the responsibility of the authors and do not necessarily represent the official views of the USDA.
The authors used ChatGPT to generate the “Recommendations” section from the fact sheet text, which the authors edited to ensure accuracy. Authors take full responsibility for the content.

December 2025
Utah State University Extension
Peer-reviewed fact sheet
Authors
Makaylie Langford, Research Assistant, Department of Applied Economics; Kynda Curtis, Professor and USU Extension Specialist, Department of Applied Economics; Karin Allen, Associate Professor and USU Extension Specialist, Department of Nutrition, Dietetics, and Food Sciences; Ruby Ward, Professor and USU Extension Specialist, Department of Applied Economics

Kynda Curtis
Food Systems Specialist
APEC Dept

Karin Allen
Food Quality & Entrepreneurship Specialist
NDFS Dept

Ruby Ward
Agricultural Entrepreneurship Specialist
APEC Dept
Related Research
Who Are Organic Wheat Consumers?
This fact sheet provides an overview of the socio-demographics, attitudes, and preferences of organic wheat consumers in the Western U.S. It discusses information on what food attributes these consumers value most along with their lifestyle and shopping h
Adopting Organic Wheat: Grower Motivations and Concerns
This fact sheet provides an overview of the study results by discussing grower motivations for adopting organic methods, as well as grower concerns regarding organic production.

Consumer Taste Beliefs Impact Organic Specialty Baked Good Pricing
In this fact sheet, we discuss how consumer taste beliefs related to organic specialty baked goods differ from their taste beliefs for conventional specialty baked goods, and whether this difference affects the amount consumers are willing to pay for orga
Which Factors Influence Consumer Organic Specialty Bakery Product Taste Ratings?
In this fact sheet, we compare consumer taste ratings for organic and conventional specialty bakery products and analyze what factors explain the differences.
Characteristics of Organic Wheat Growers
This fact sheet provides an overview of the study results and compares and contrasts these results with the results of other studies. It also provides suggestions for outreach to current and potential organic wheat growers.
Do Consumers Who Prefer Gluten-Free Also Prefer Organic?
In this fact sheet, we examine how consumers, who choose to avoid wheat/gluten bakery products for a variety of reasons, respond to organic wheat products relative to those who do not limit their wheat/gluten consumption, and whether organic wheat product
Labeling and Product Characteristic Preferences of Organic Food Buyers
This Extension fact sheet discusses the results of an online survey conducted in 2017 across 16 western states via Qualtrics. Just over one thousand residents responded to the survey.
Does Consumer Knowledge of Organic Production Standards Influence Demand for Organic and Non-GMO Labeled Foods?
This fact sheet summarizes a study conducted on consumer willingness to pay (WTP) for organic and non-GMO labels alone and in combination for bread and cookies, and how consumer knowledge that organic is non-GMO and overall organic knowledge of organic st

Who Values Organic Specialty Bakery Products?
In this fact sheet, we examine differences in sociodemographics and lifestyle choices between those who view organic as important when purchasing specialty bakery products and those who don’t, with the aim to identify a target market of consumers who pref
Bakery Organic Wheat Flour Quality and Quantity Requirements
This fact sheet summarizes the findings of a survey conducted with bakery owners and managers to assess their organic wheat flour quality and sourcing needs.

Premium Potential for Organic Wheat Products
This Extension fact sheet provides an overview of the premiums consumers in the Western U.S. are willing to pay for organic wheat products, as well as their knowledge of organic production methods, and opinions and attitudes toward organic food products i
Wheat Miller and Distributor Organic Wheat Quality and Quantity Requirements
This fact sheet summarizes the findings of a survey conducted with wheat buyers (millers and distributors) to assess their organic wheat quality and sourcing needs. We examine the importance of various quality measures in miller and distributor decisions