Target Consumers for Packaged Beef Jerky

Introduction
Highlights
Target beef jerky consumers are…- A market segment more often middle-aged, highly educated, higher income, married, and employed full-time.
- Highly engaged in food and agricultural activities, especially farmers markets, farm stores, CSAs, and visiting local farms.
- Very familiar with specialty labels—especially local, organic, and grass-fed—and frequently purchase foods with these attributes.
- More likely to spend more on beef jerky, averaging $23.77 per purchase versus $14.08 for the full sample.
- Willing to pay substantial premiums for beef jerky with specialty labels, especially organic and grass-fed.
To determine western U.S. consumer preferences and willingness to pay for regionally sourced processed food products, Utah State University (USU) conducted a study in the fall of 2024. Study data were collected through an online survey of consumers via the Qualtrics response system. A total of 1,282 responses were collected from all U.S. western states and territories. Respondents were recruited to ensure that sample averages for age, education level, and annual household income were representative of the region’s demographics.
The survey included questions on respondent demographics, food-related lifestyle and behaviors, consumption habits and expenditures, preferences for specialty labeled foods and food characteristics. Consumer preferences, purchasing habits, and pricing were examined for three processed food products, one of which was packaged beef jerky (8-ounce package). The following fact sheet describes the target market (consumer group) for packaged beef jerky. Target consumers were identified as those who consume beef jerky several times a week or more. A total of 225 survey respondents fell into this target consumer group.
Target Market Description
Demographics
Table 1 shows the demographic comparison between the full sample and the target sample, or those who consume more beef jerky. Beef jerky consumers are middle-aged, highly educated, and more likely to be employed full-time and married than the full sample. Target consumers are also more likely to be male, the household’s primary grocery shopper, and to have a higher annual household income. In terms of ethnicity, target consumers are more likely to be African American and Asian, and less likely to be White or of two or more races than the full sample.
Table 1. Sample Demographics
| Characteristic | Category | Target (%) | Sample (%) |
|---|---|---|---|
| Age | 18–34 years | 30.22% | 29.02% |
| 35–54 years | 58.67% | 37.60% | |
| 55–64 years | 5.78% | 14.74% | |
| 65 years and over | 5.33% | 18.64% | |
| Gender | Man | 56.44% | 34.87% |
| Women | 43.56% | 64.51% | |
| Non-binary | 0% | 0.47% | |
| Marital status | Single | 33.33% | 45.79% |
| Married | 64.89% | 44.38% | |
| Children in household | Yes | 34.22% | 37.29% |
| Education level | Less than high school | 1.78% | 3.98% |
| High school graduate/GED | 22.22% | 31.20% | |
| Associate’s degree/some college | 20.89% | 28.39% | |
| Bachelor’s degree | 18.67% | 18.33% | |
| Graduate degree or higher | 36.44% | 18.10% | |
| Annual income | Less than $20,000 | 8% | 12.25% |
| $20,000–$39,999 | 9.78% | 19.50% | |
| $40,000–$59,999 | 14.67% | 17.94% | |
| $60,000–$79,999 | 14.67% | 18.25% | |
| $80,000–$99,999 | 11.11% | 8.66% | |
| $100,000–$149,999 | 22.67% | 14.51% | |
| $150,000 and more | 19.11% | 8.89% | |
| Employment status | Full-time employed | 70.61% | 44.62% |
| Part-time employed/Homemaker | 16% | 20.83% | |
| Unemployed/Student/Retired | 12.44% | 34.56% | |
| Ethnicity | Black or African American | 10.22% | 8.27% |
| American Indian or Alaskan Native | 1.78% | 1.79% | |
| Asian | 6.67% | 5.54% | |
| Native Hawaiian and other Pacific Islander | 0.44% | 1.09% | |
| White | 64% | 67.39% | |
| Hispanic or Latino | 13.78% | 11.31% | |
| Other | 0.88% | 7.80% | |
| Two or more races | 1.78% | 3.12% | |
| Shopping responsibility | Yes, I am the primary grocery shopper. | 88.44% | 75.90% |
| Yes, but I share this responsibility with another. | 11.11% | 22.00% | |
| No, I do not purchase groceries. | 0.44% | 2.11% |
Lifestyle and Food Behaviors
Respondents were asked to rate their agreement with statements about their food behaviors and lifestyle from 1 to 5 (strongly disagree to strongly agree). As shown in Figure 1, all target consumers agreed or strongly agreed more than the full sample with all statements. They agreed the most with the statements “I eat fresh produce daily,” “I buy food from local farmers when available,” and “Physical activity is an important part of my routine.” Significantly more target consumers grow or raise their own food, follow a vegetarian or vegan diet, and eat out frequently. The greatest difference between the full sample and the target consumers was for the statement “I grow or raise my own food,” with 60% of the target consumers agreeing or strongly agreeing, compared to only 27% of the total sample.
Figure 1. Lifestyle and Food Behaviors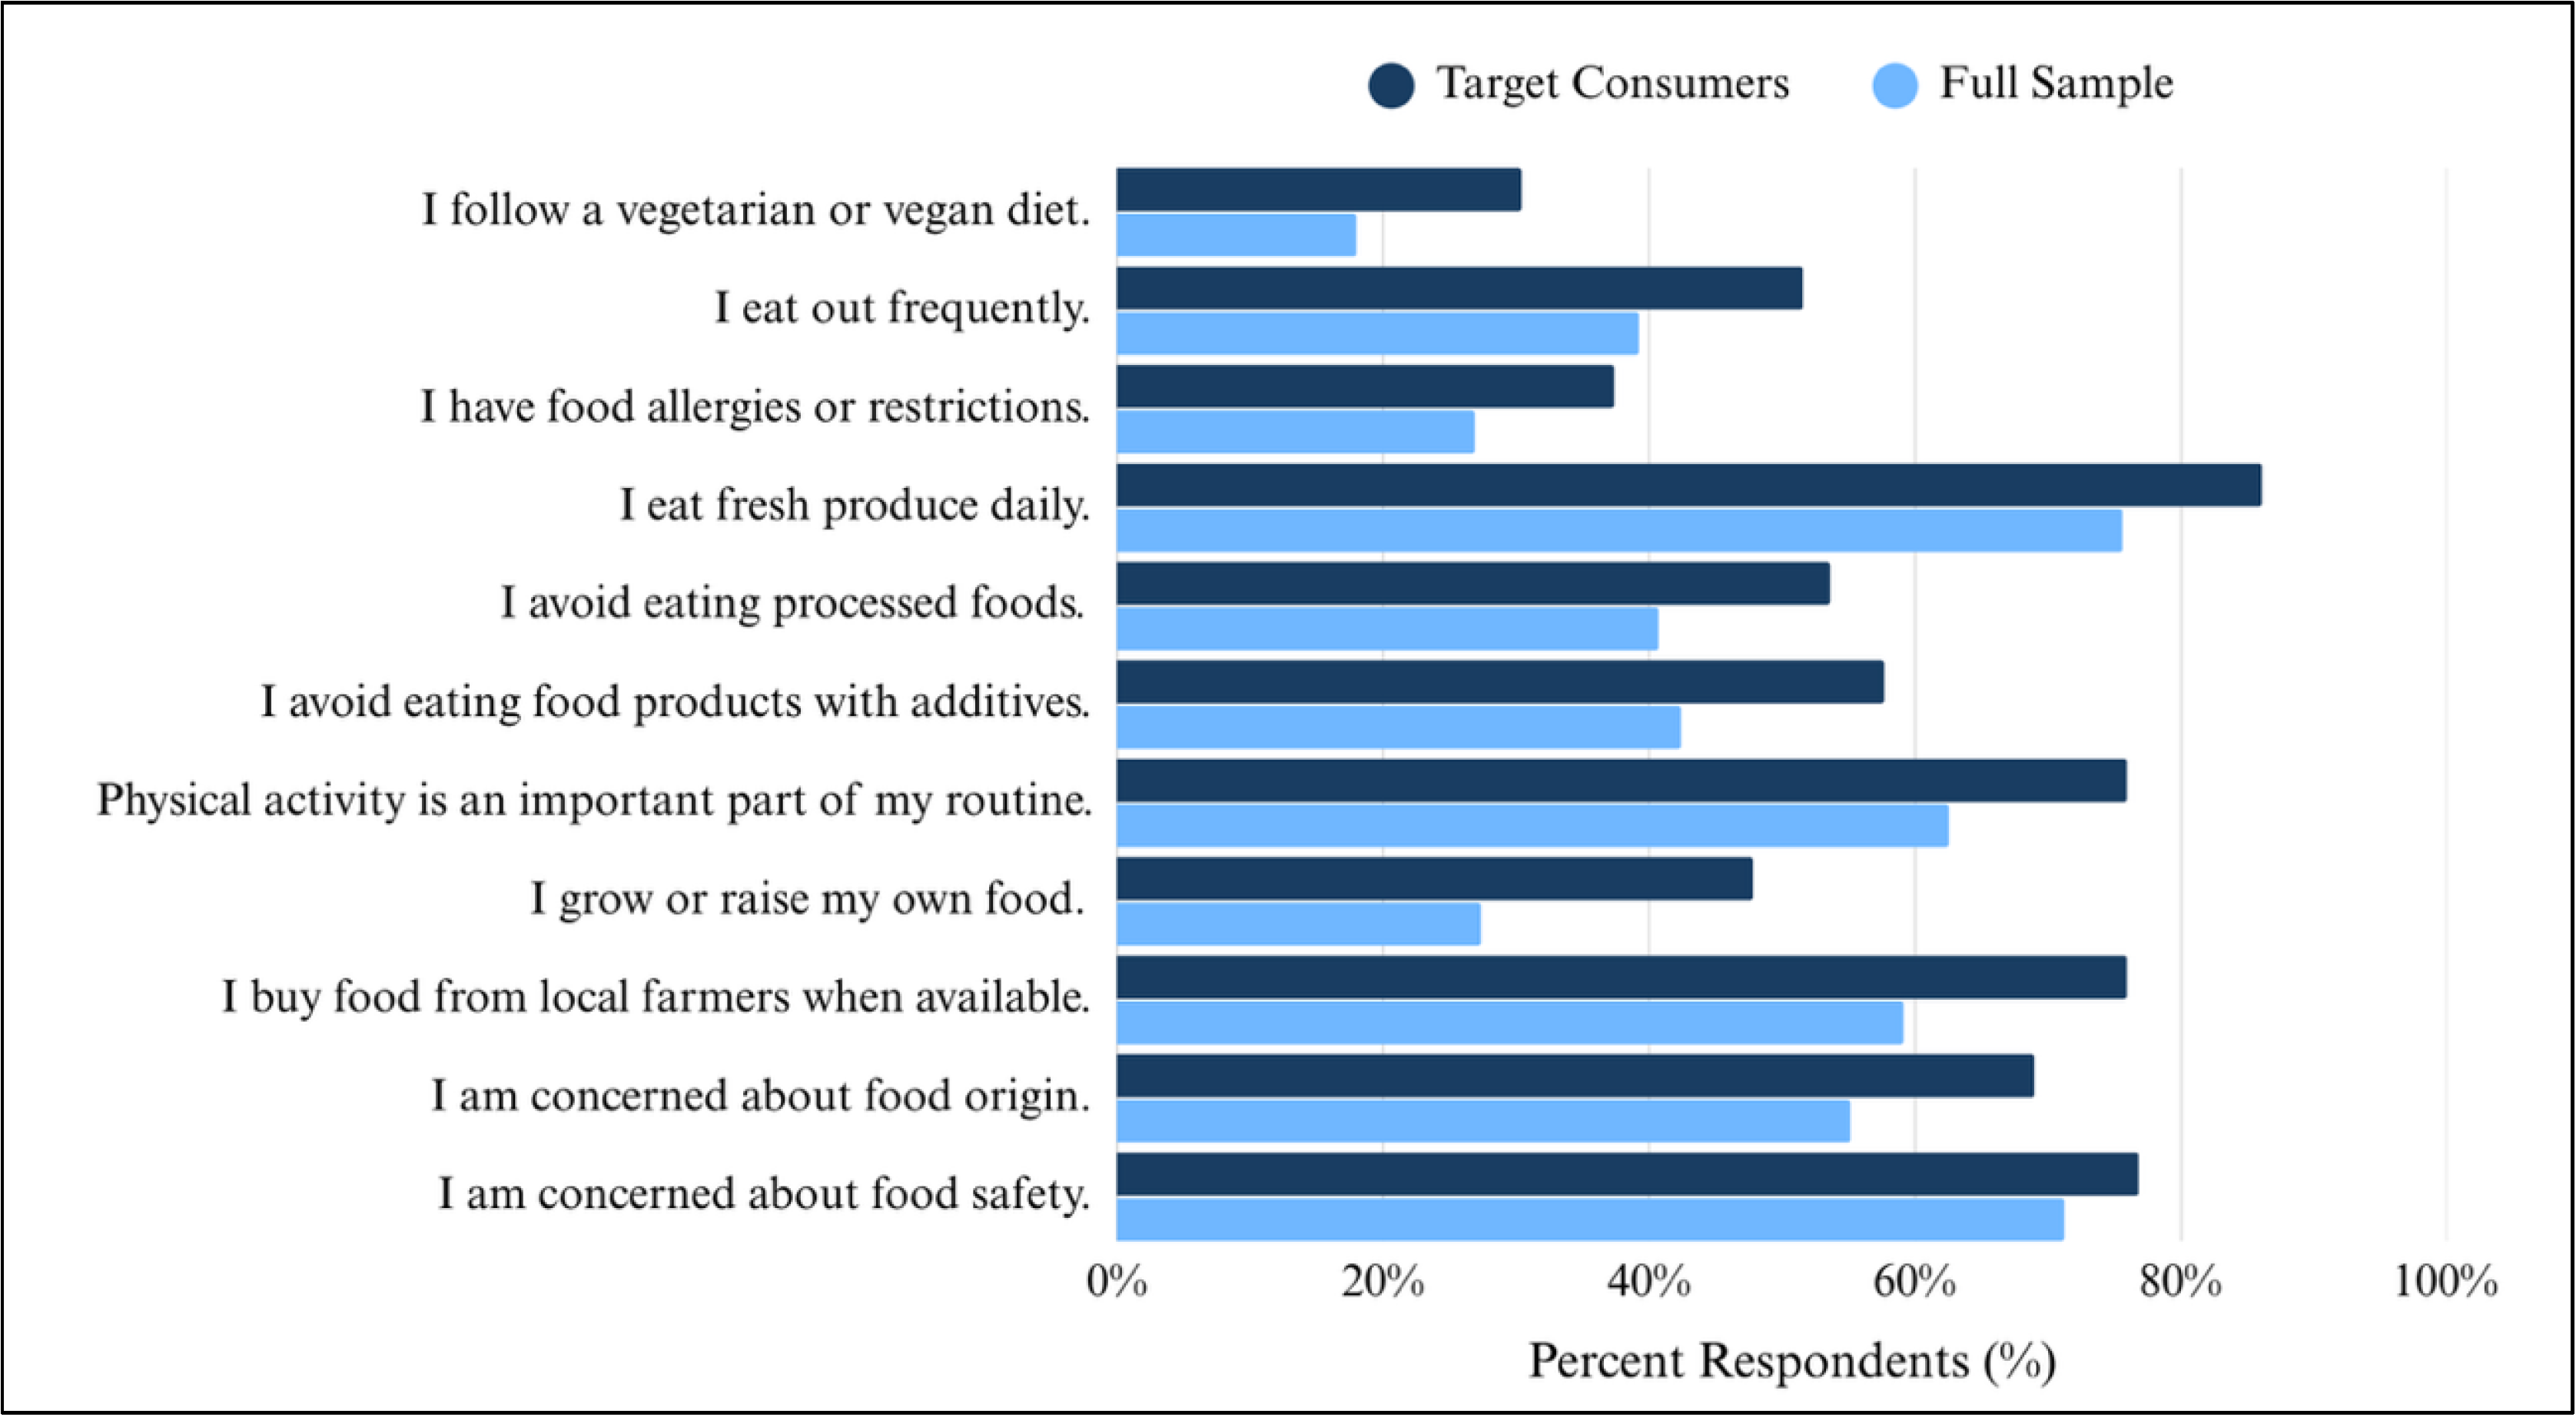
When queried about their participation in food and agricultural activities, only 10% of the target consumers didn’t participate. In contrast, nearly a quarter of the full sample hadn’t participated in any of the activities in the last year (see Table 2). While target consumers were more likely to participate in all activities, the most popular included shopping at farmers markets (63%) and farm stores or stands (46%), eating at local-sourcing restaurants (50%), and visiting local farms (42%). Target consumers were much more likely to visit a local farm and subscribe to a community-supported agriculture (CSA) program than the full sample.
Table 2. Annual Participation in Food and Agricultural Activities
| Activity | Target (%) | Full Sample (%) |
|---|---|---|
|
Shopped at a farmers market |
63.56% | 57.49% |
|
Shopped at a farm store or stand |
45.78% | 30.81% |
|
Subscribed to a local CSA or food subscription program |
29.78% | 10.37% |
|
Visited a local farm |
41.78% | 24.73% |
|
Traveled overnight to visit a farm |
20.44% | 7.41% |
|
Participated in farm-based entertainment |
24.44% | 10.53% |
|
Ate at a local-sourcing restaurant |
49.78% | 35.49% |
|
Visited a winery, brewery, or distillery |
28.44% | 25.20% |
|
None of the above |
10.22% | 23.40% |
Specialty Label Knowledge and Preferences

Survey respondents were asked to rate their familiarity (on a scale of 1 to 5, not familiar to very familiar) with various specialty labeling and production programs, including “certified organic,” “locally grown,” “grass-fed,” and “non-GMO.” Target consumers for beef jerky were more familiar than the full sample with all programs. They were most familiar with grass-fed and locally grown production and labeling standards. Both the full sample and target consumers were least familiar with non-GMO standards.
Just over 60% of the target consumers reported consuming foods with each specialty label at least weekly. Locally grown or sourced products were consumed most frequently, with 72% of the target consumers consuming them at least once a week. Target consumers also frequently consumed organic products (70% consumed at least weekly), while non-GMO-labeled products were consumed least frequently by target consumers. Just over two-thirds of target consumers consumed non-GMO-labeled products at least weekly.
While target consumers were more familiar with specialty labeling programs than the full sample, they didn’t rate all specialty labels as important when making purchasing decisions. As shown in Figure 2, target consumers considered natural, organic, local, and heart healthy important when making a purchase decision. Tree-ripened, pasture-raised, fair trade, and low sugar were not as important to target consumers. Antibiotic-free, low fat, and low sugar were rated as more important to the full sample than target consumers.
Figure 2. Specialty Labels Important in Food Purchase Decisions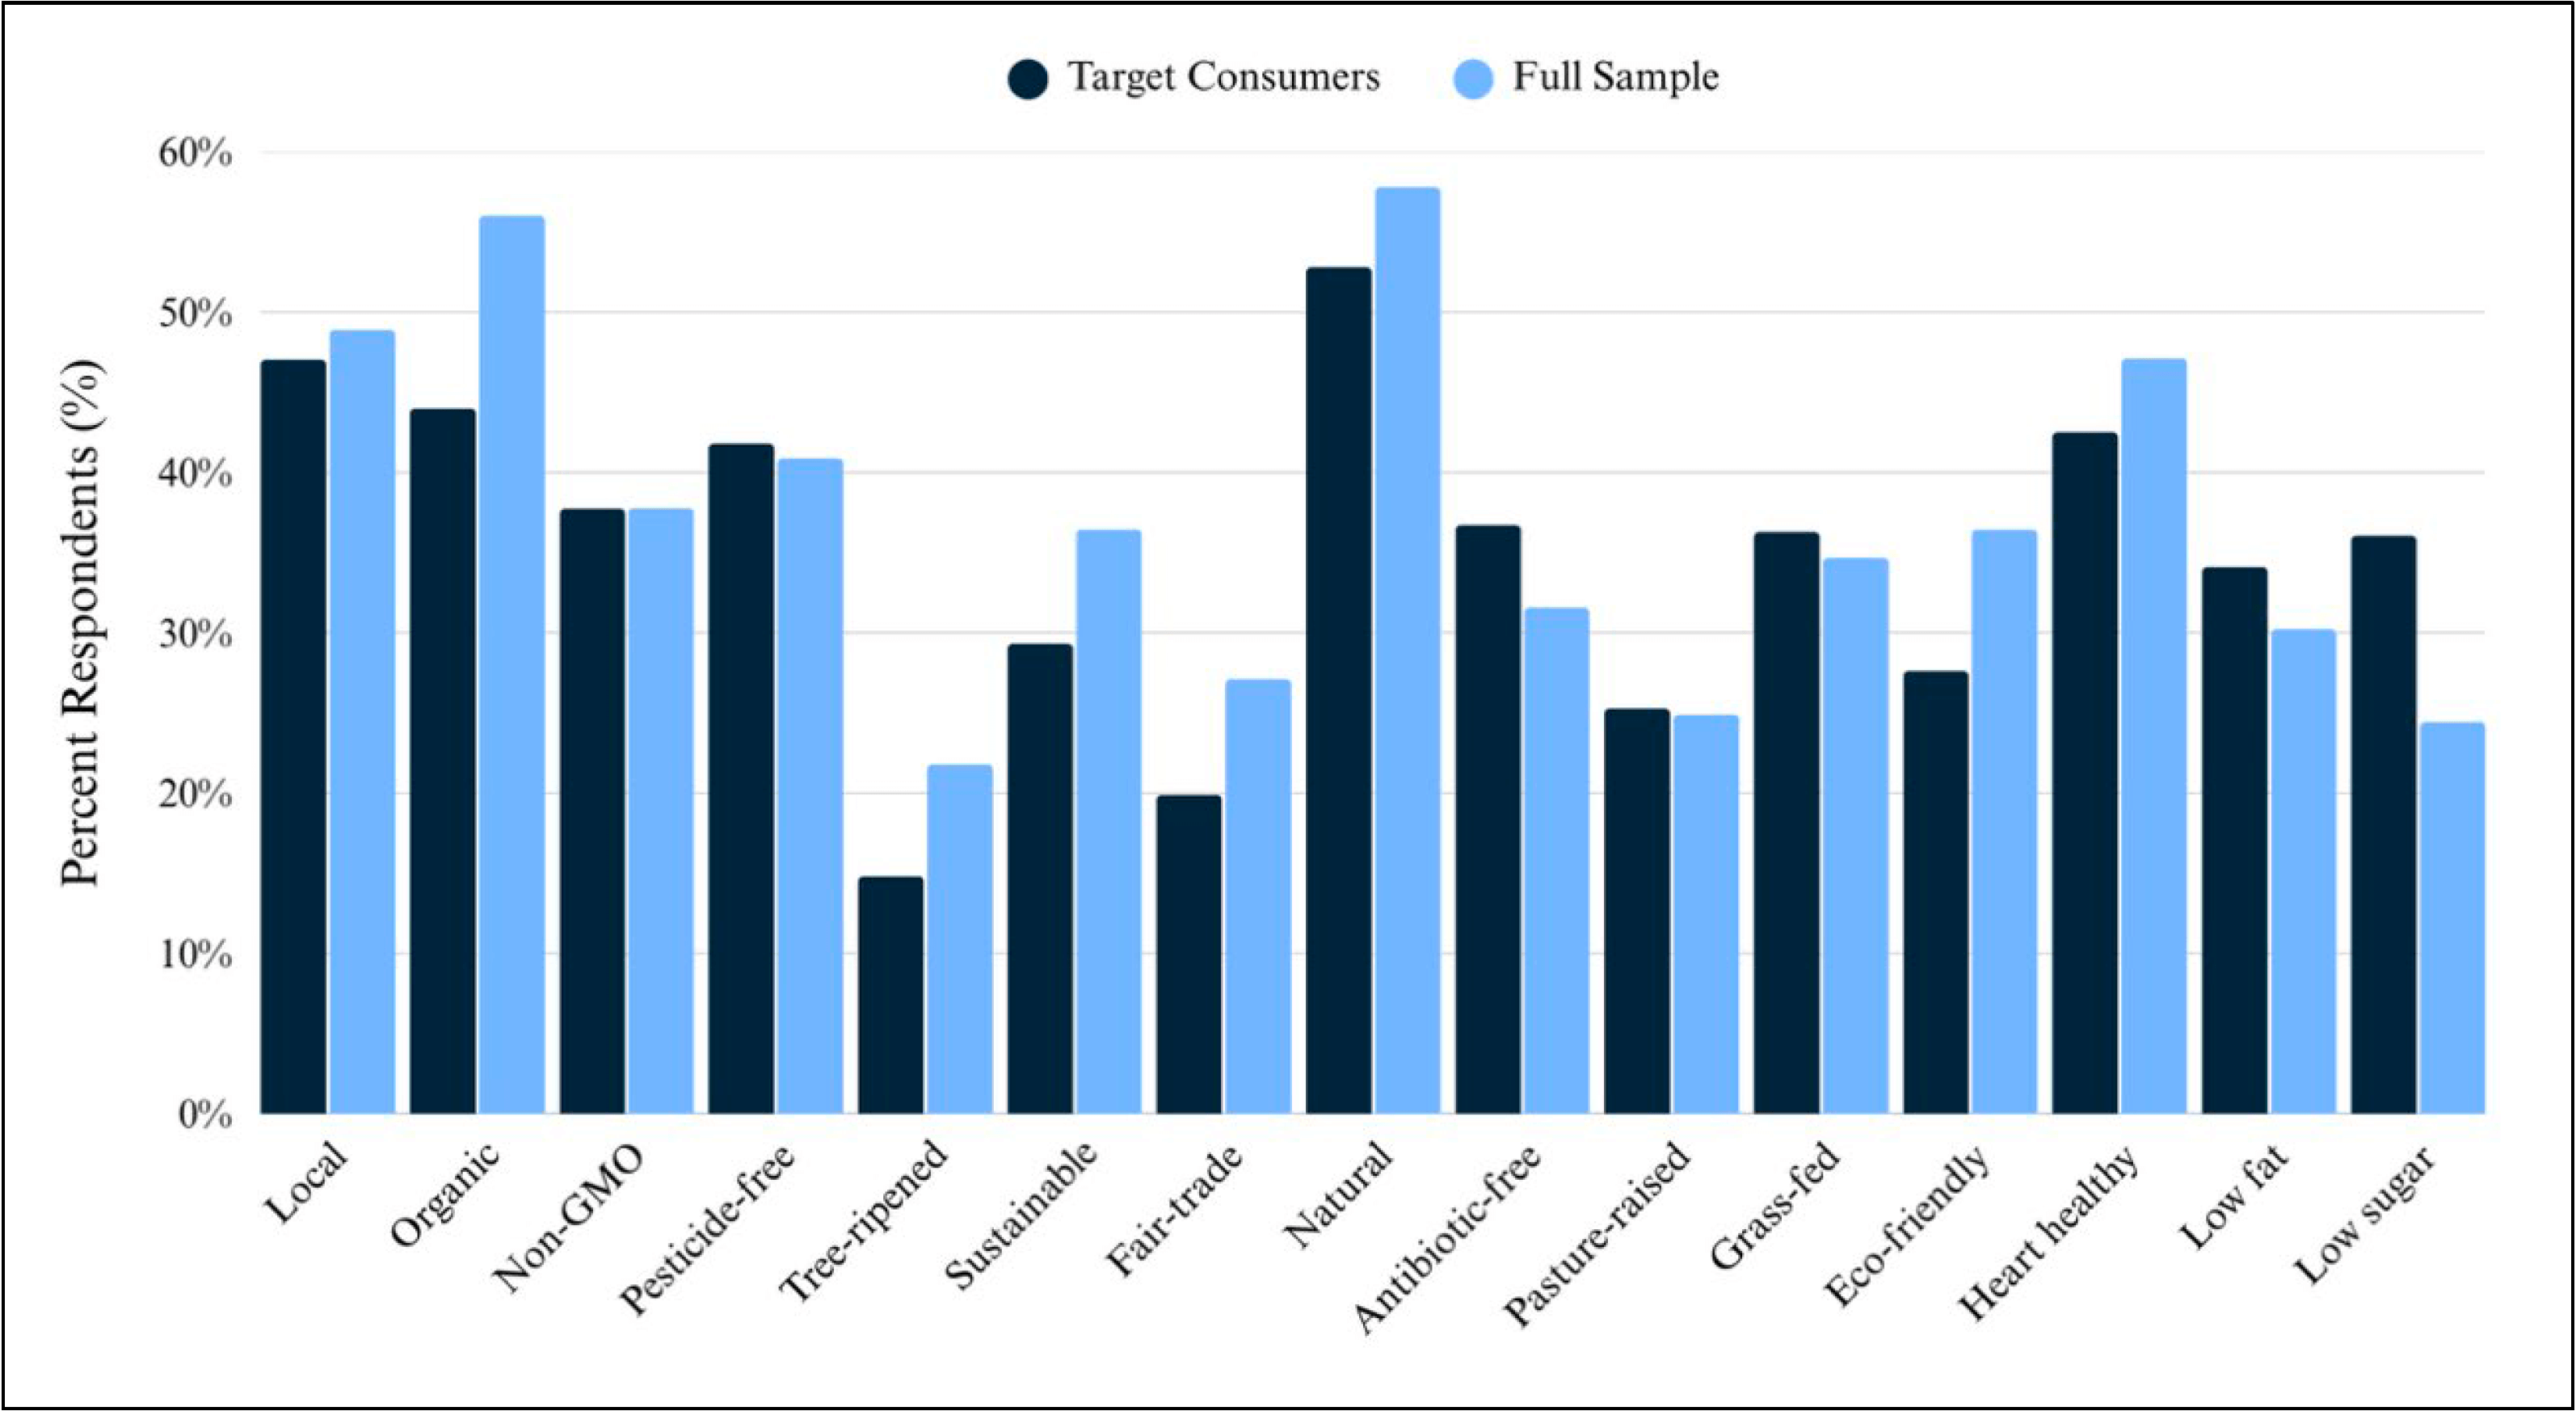
Packaged Beef Jerky Purchasing Behaviors
Survey respondents were asked where they most often purchase beef jerky. Grocery stores (77%) were the most popular purchase location for target consumers, followed by multipurpose stores, warehouse clubs, and specialty stores. Among direct-to-consumer markets, local cooperatives (57%) and farmers markets (55%) were the most popular locations. Target consumers were less likely to shop at a local farm stand or store and more likely to shop at a grocery or specialty store than the full sample. These results show that target consumers are more interested in shopping at traditional grocery outlets.
When asked how much they spend on average per purchase of beef jerky, target consumers reported spending $23.77 per purchase. In comparison, the full sample averaged only $14.08 per purchase, for a difference of $9.69. Hence, target consumers either pay more for beef jerky or buy more on each purchase occasion.
Table 3 provides an overview of the target consumer and the full sample’s willingness to pay for specialty labeled beef jerky products. Target consumers were willing to pay the most for beef jerky labeled “organic” and “grass-fed,” and the least for beef jerky without any specialty labels. Other than the organic and local-labeled product, target consumers were willing to pay more for products with two labels than for those with only a single label. The pricing difference between what target consumers and the full sample were willing to pay per package was at least $3.37 and as high as $4.31. This difference suggests that target consumers value beef jerky significantly more and are thus willing to pay price premiums.
Table 3. Willingness to Pay (WTP) for Packaged Beef Jerky Products (8-ounce package)
| Product | Target mean WTP ($) | Full sample mean WTP(%) | Mean difference ($) |
|---|---|---|---|
|
Local and organic beef jerky |
$15.99 | $12.62 | $3.37 |
|
Organic and grass-fed beef jerky |
$16.76 | $12.77 | $3.99 |
|
Local and grass-fed beef jerky |
$16.56 | $12.76 | $3.80 |
|
Organic beef jerky |
$16.26 | $11.95 | $4.31 |
|
Local beef jerky |
$15.46 | $11.76 | $3.70 |
|
Grass-fed beef jerky |
$15.90 | $12.02 | $3.88 |
|
Non-labeled beef jerky |
$13.07 | $9.23 | $3.84 |
Conclusions
The findings discussed here highlight that frequent beef jerky consumers represent a distinct market segment characterized by higher education levels and income. They are more likely to be married and employed full-time compared to the general population. They demonstrate strong engagement with food-related activities such as shopping at farmers markets and eating at local-sourcing restaurants. These consumers also show strong familiarity with specialty food labels and actively purchase products with local, organic, and grass-fed designations. Their willingness to pay a significant premium for beef jerky with these attributes underscores their value as a targeted consumer base.
Overall, study results suggest that producers and retailers should emphasize premium product qualities, such as organic and grass-fed production methods when marketing to this consumer group. The findings also indicate that traditional retail outlets, particularly grocery stores, are the most important purchasing venues. Producers who clearly communicate specialty labeling attributes and align their products with health-conscious and environmentally aware consumer values are likely to capture greater loyalty and sales from this profitable market segment.
Recommendations
- Highlight specialty labels. Clearly emphasize organic and grass-fed attributes, as these command the highest willingness to pay among target consumers.
- Leverage premium pricing opportunities. Target consumers spend nearly twice as much per purchase as the general sample, suggesting strong potential for higher margins.
- Focus on grocery and specialty retail. Since grocery stores are the most common purchasing location, prioritize placement in traditional retail outlets while maintaining visibility in specialty stores.
- Engage direct-to-consumer markets. Build presence in cooperatives and farmers’ markets, where target consumers also shop, to reinforce brand authenticity and local connections.
- Market to health- and lifestyle-conscious consumers. Emphasize freshness, natural qualities, and alignment with active lifestyles in branding and promotions.
- Use targeted messaging. Focus advertising toward middle-aged, higher-income, and educated consumers, particularly men who are primary household shoppers.
- Promote sustainability and local sourcing. Highlight commitments to local farmers and sustainable production, as target consumers are more likely to value and participate in local food systems.
- Develop loyalty through storytelling. Share origin stories, production practices, and farmer connections to appeal to consumers seeking authenticity.
- Innovate with product variety. Explore new flavor profiles or formats that align with premium quality while maintaining strong specialty label claims.
Acknowledgments
Funding for this publication was made possible by a grant/cooperative agreement from the U.S. Department of Agriculture (USDA) Agricultural Marketing Service. Its contents are solely the responsibility of the authors and do not necessarily represent the official views of the USDA.
The authors used ChatGPT to generate the “Recommendations” and “Highlights” bullet points from the fact sheet text, which the authors edited to ensure accuracy. Authors take full responsibility for the content.

December 2025
Utah State University Extension
Peer-reviewed fact sheet
Authors
Kynda Curtis, Professor and USU Extension Specialist, Department of Applied Economics; Makaylie Langford, Research Assistant, Department of Applied Economics; Karin Allen, Associate Professor and USU Extension Specialist, Department of Nutrition, Dietetics, and Food Sciences; Ruby Ward, Professor and USU Extension Specialist, Department of Applied Economics

Kynda Curtis
Food Systems Specialist
APEC Dept

Karin Allen
Food Quality & Entrepreneurship Specialist
NDFS Dept

Ruby Ward
Agricultural Entrepreneurship Specialist
APEC Dept
Related Research

Agricultural Producer and Food Maker Food Processing Operation Needs Assessment Overview
Utah State University’s 2024 needs assessment explores the educational, funding, and infrastructure needs of Utah farmers, ranchers, and food makers involved in value-added food production. Results highlight respondent demographics, products, markets, lab

Assessing Utah's Agricultural Producer and Small Processor Interest in Value-Added Food Production
This fact sheet presents findings from a study on value-added food production among Utah farmers, ranchers, and food processors. Highlighting operational characteristics, production timelines, markets, sales goals, and key resources needed to support loca
Target Consumers for Beef Jerky
This study identifies the target market for packaged beef jerky in the western U.S., highlighting consumer demographics, purchasing habits, and willingness to pay premiums for organic, grass-fed, and locally sourced products.

Target Consumers for Bottled Mild Salsa
This fact sheet summarizes USU research on western U.S. consumers who purchase mild salsa, highlighting their demographics, food habits, and preferences. Target consumers are middle-aged, highly educated, engaged in local food systems, and willing to pay

Target Consumers for Bottled Tart Cherry Juice
This fact sheet provides an overview of the study results conducted by Utah State University to determine western U.S. consumer preferences and willingness to pay for regionally sourced processed food products. This fact sheet addresses target consumers f
U.S. West Consumer Preferences for Specialty Labeled Processed Foods
Highlighting consumer preferences and willingness to pay for specialty-labeled processed foods, including organic, local, grass-fed, and non-GMO products. Survey results show strong consumer value for health, safety, freshness, and transparency, especiall

U.S. West Consumer Processed Food Preferences and Consumption Habits
This article summarizes a 2024 Utah State University study examining processed food preferences and purchasing behaviors among 1,282 consumers across the western United States. Findings highlight key values such as taste, price, product quality, and trust

Utah's Value-Added Food Processing Options
Explaining what value-added foods are and how producers can increase profit through processing, direct marketing, and vertical integration. Also outlining Utah’s regulatory options and programs to help small food businesses choose the right path for produ