
The Organic Production Interests of Utah's Agricultural Producers
Introduction
Highlights
- USU researchers conducted a study to understand organic production-related educational and resource needs in Utah.
- Nearly half of the operations produce specialty crops such as fresh produce and flowers.
- Direct-to-consumer markets are the primary sales outlets, particularly farmers markets, CSAs, and farm stands, shops, or stores. Online sales are also an important channel, suggesting that many operations rely on relatively short and direct marketing channels to reach customers.
- Survey results suggest substantial current and potential interest in organic production among respondents.
- Educational programs should emphasize practical production strategies, enterprise profitability, and market opportunities while also addressing producers' environmental and personal stewardship goals.
According to the 2022 U.S. Department of Agriculture (USDA) Census of Agriculture (2024), Utah had approximately 41,000 acres of certified organic farmland, representing about 0.5% of the state’s 10.5 million acres of agricultural land. Certified and exempt organic farms reported nearly $28.9 million in sales, accounting for approximately 1.3% of Utah’s total agricultural cash receipts. Although certified organic forage and grain crops account for most of Utah’s organic acreage, fresh produce contributes a disproportionately large share of organic farm revenue (approximately 60.0%) because it has a much higher value per acre.
To better understand Utah agricultural producers’ organic production interests, Utah State University (USU) conducted a statewide study of producers in 2024. Researchers collected data through an online Qualtrics survey, with 220 producers responding. Survey questions addressed respondent demographics, characteristics of their farming or ranching operations, and their current or previous use of organic production methods. Additional questions explored respondents’ motivations for adopting or not adopting organic practices, their perceptions and attitudes toward organic agriculture, and their concerns related to organic production, markets, certification, and regulations. Respondents were also asked to evaluate the importance and usefulness of various types of information, tools, services, and educational programs that may support organic production decisions.
The following fact sheet provides an overview of survey respondents’ demographic characteristics and farming operation details, including acreage under production, annual gross sales, primary agricultural products, and marketing channels used. It also describes respondents’ organic production experiences, including years certified, certified acreage, and the primary motivations behind adopting organic production methods. The findings presented in this fact sheet provide valuable insights into the characteristics, experiences, and needs of Utah producers related to organic agriculture. Extension educators, agricultural service providers, policymakers, and industry organizations can use this information to develop targeted educational programs, technical resources, and support services that address producer challenges, strengthen organic production capacity, and encourage informed decision-making related to organic opportunities in Utah.
Respondent Demographics and Operation Details
Table 1 shows respondent demographics. Most of the respondents (81.7%) identified themselves as owners in terms of their role in the operation, while only about 3.0% served as CEOs, administrators, or marketing managers. Less than 5.0% of respondents were between the ages of 25 and 34, while about one-quarter were between 35 and 44 years old. Nearly half were aged 55 and above, indicating an older respondent demographic. In terms of education, 12.0% had a high school diploma or GED, whereas nearly half (44.9%) reported having a college degree, and about one-quarter held advanced degrees. Most respondents were male (66.7%). More than half came from a farming or ranching background. Additionally, 65.4% of respondents’ operations were supported by outside jobs or other income sources.
Table 1. Respondent Demographics
| Characteristic | Category | Sample (%) |
|---|---|---|
| Age | 25 to 34 | 4.8% |
| 35 to 44 | 25.6% | |
| 45 to 54 | 16.8% | |
| 55 to 64 | 25.6% | |
| 65 and over | 27.2% | |
| Gender | Man | 66.7% |
| Woman | 30.1% | |
| Prefer to self-describe | 3.3% | |
| Education level | High school diploma/GED | 11.8% |
| Associates degree/some college | 17.3% | |
| College degree (BS, BA, etc.) | 44.9% | |
| Graduate degree (MS, PhD, etc.) | 26.0% | |
| Farming/ranching background | Yes | 58.0% |
| No | 39.7% | |
| Unsure | 2.3% | |
| Outside income | Yes | 65.4% |
| No | 34.6% | |
| Role in operation | Owner/partner | 81.7% |
| General manager/CEO | 2.0% | |
| Marketing manager | 1.5% | |
| Distribution/production manager | 4.0% | |
| Administration | 2.5% | |
| Other | 8.3% |
Table 2 provides respondent operation details. In terms of the operation’s business duration, just over half had been in business for more than 20 years, while 25.5% had been in operation for less than 6 years. When asked whether the operation was multigenerational and family-owned, nearly half indicated it was not. However, 25.4% of respondents had two generations engaged in the operation, and nearly 13.0% reported that their operation had been running for four or more generations, suggesting strong multigenerational continuity. The number of employees varied substantially. Just over one-third (36.4%) had one or fewer employees, and another 39.9% employed between two and five people. Only 7.5% reported having more than 20 employees. In terms of acreage under production, 41.3% operated on 5 acres or less, while nearly one-third managed more than 150 acres. Fewer than 20.0% operated on 6 to 100 acres.
Leasing land was not common, as 56.0% of respondents didn’t lease any land. Only 8.3% relied heavily on leased land, with more than 80.0% of their acres being leased. In terms of annual gross sales, 25.9% reported sales of less than $10,000. The ranges of $50,001–$100,000, $100,001–$200,000, and $200,001–$500,000 each accounted for approximately 10.0%–12.0% of respondents.
Table 2. Respondent Operation Details
| Characteristic | Category | Sample (%) |
|---|---|---|
| Business duration (years) | Less than 1 year | 4.8% |
| 1 to 5 years | 20.7% | |
| 6 to 10 years | 12.8% | |
| 11 to 20 years | 9.6% | |
| More than 20 years | 52.1% | |
| Generations involved | Not applicable | 48.6% |
| Two generations | 25.4% | |
| Three generations | 13.0% | |
| Four generations | 5.9% | |
| More than four generations | 7.0% | |
| Number of employees | 1 or less | 36.4% |
| 2 to 5 | 39.9% | |
| 6 to 10 | 9.8% | |
| 11 to 20 | 6.4% | |
| More than 20 | 7.5% | |
| Total acreage under production | None or not applicable | 4.1% |
| 5 acres or less | 41.3% | |
| 6 to 10 acres | 4.1% | |
| 11 to 25 acres | 1.7% | |
| 26 to 50 acres | 9.3% | |
| 51 to 100 acres | 2.3% | |
| 101 to 150 acres | 4.7% | |
| More than 150 acres | 32.6% | |
| Average annual gross sales | $10,000 or less | 25.9% |
| $10,001–$50,000 | 17.9% | |
| $50,001–$100,000 | 10.0% | |
| $100,001–$200,000 | 10.0% | |
| $200,001–$500,000 | 11.8% | |
| More than $500,000 | 13.5% | |
| Prefer not to answer | 12.9% |
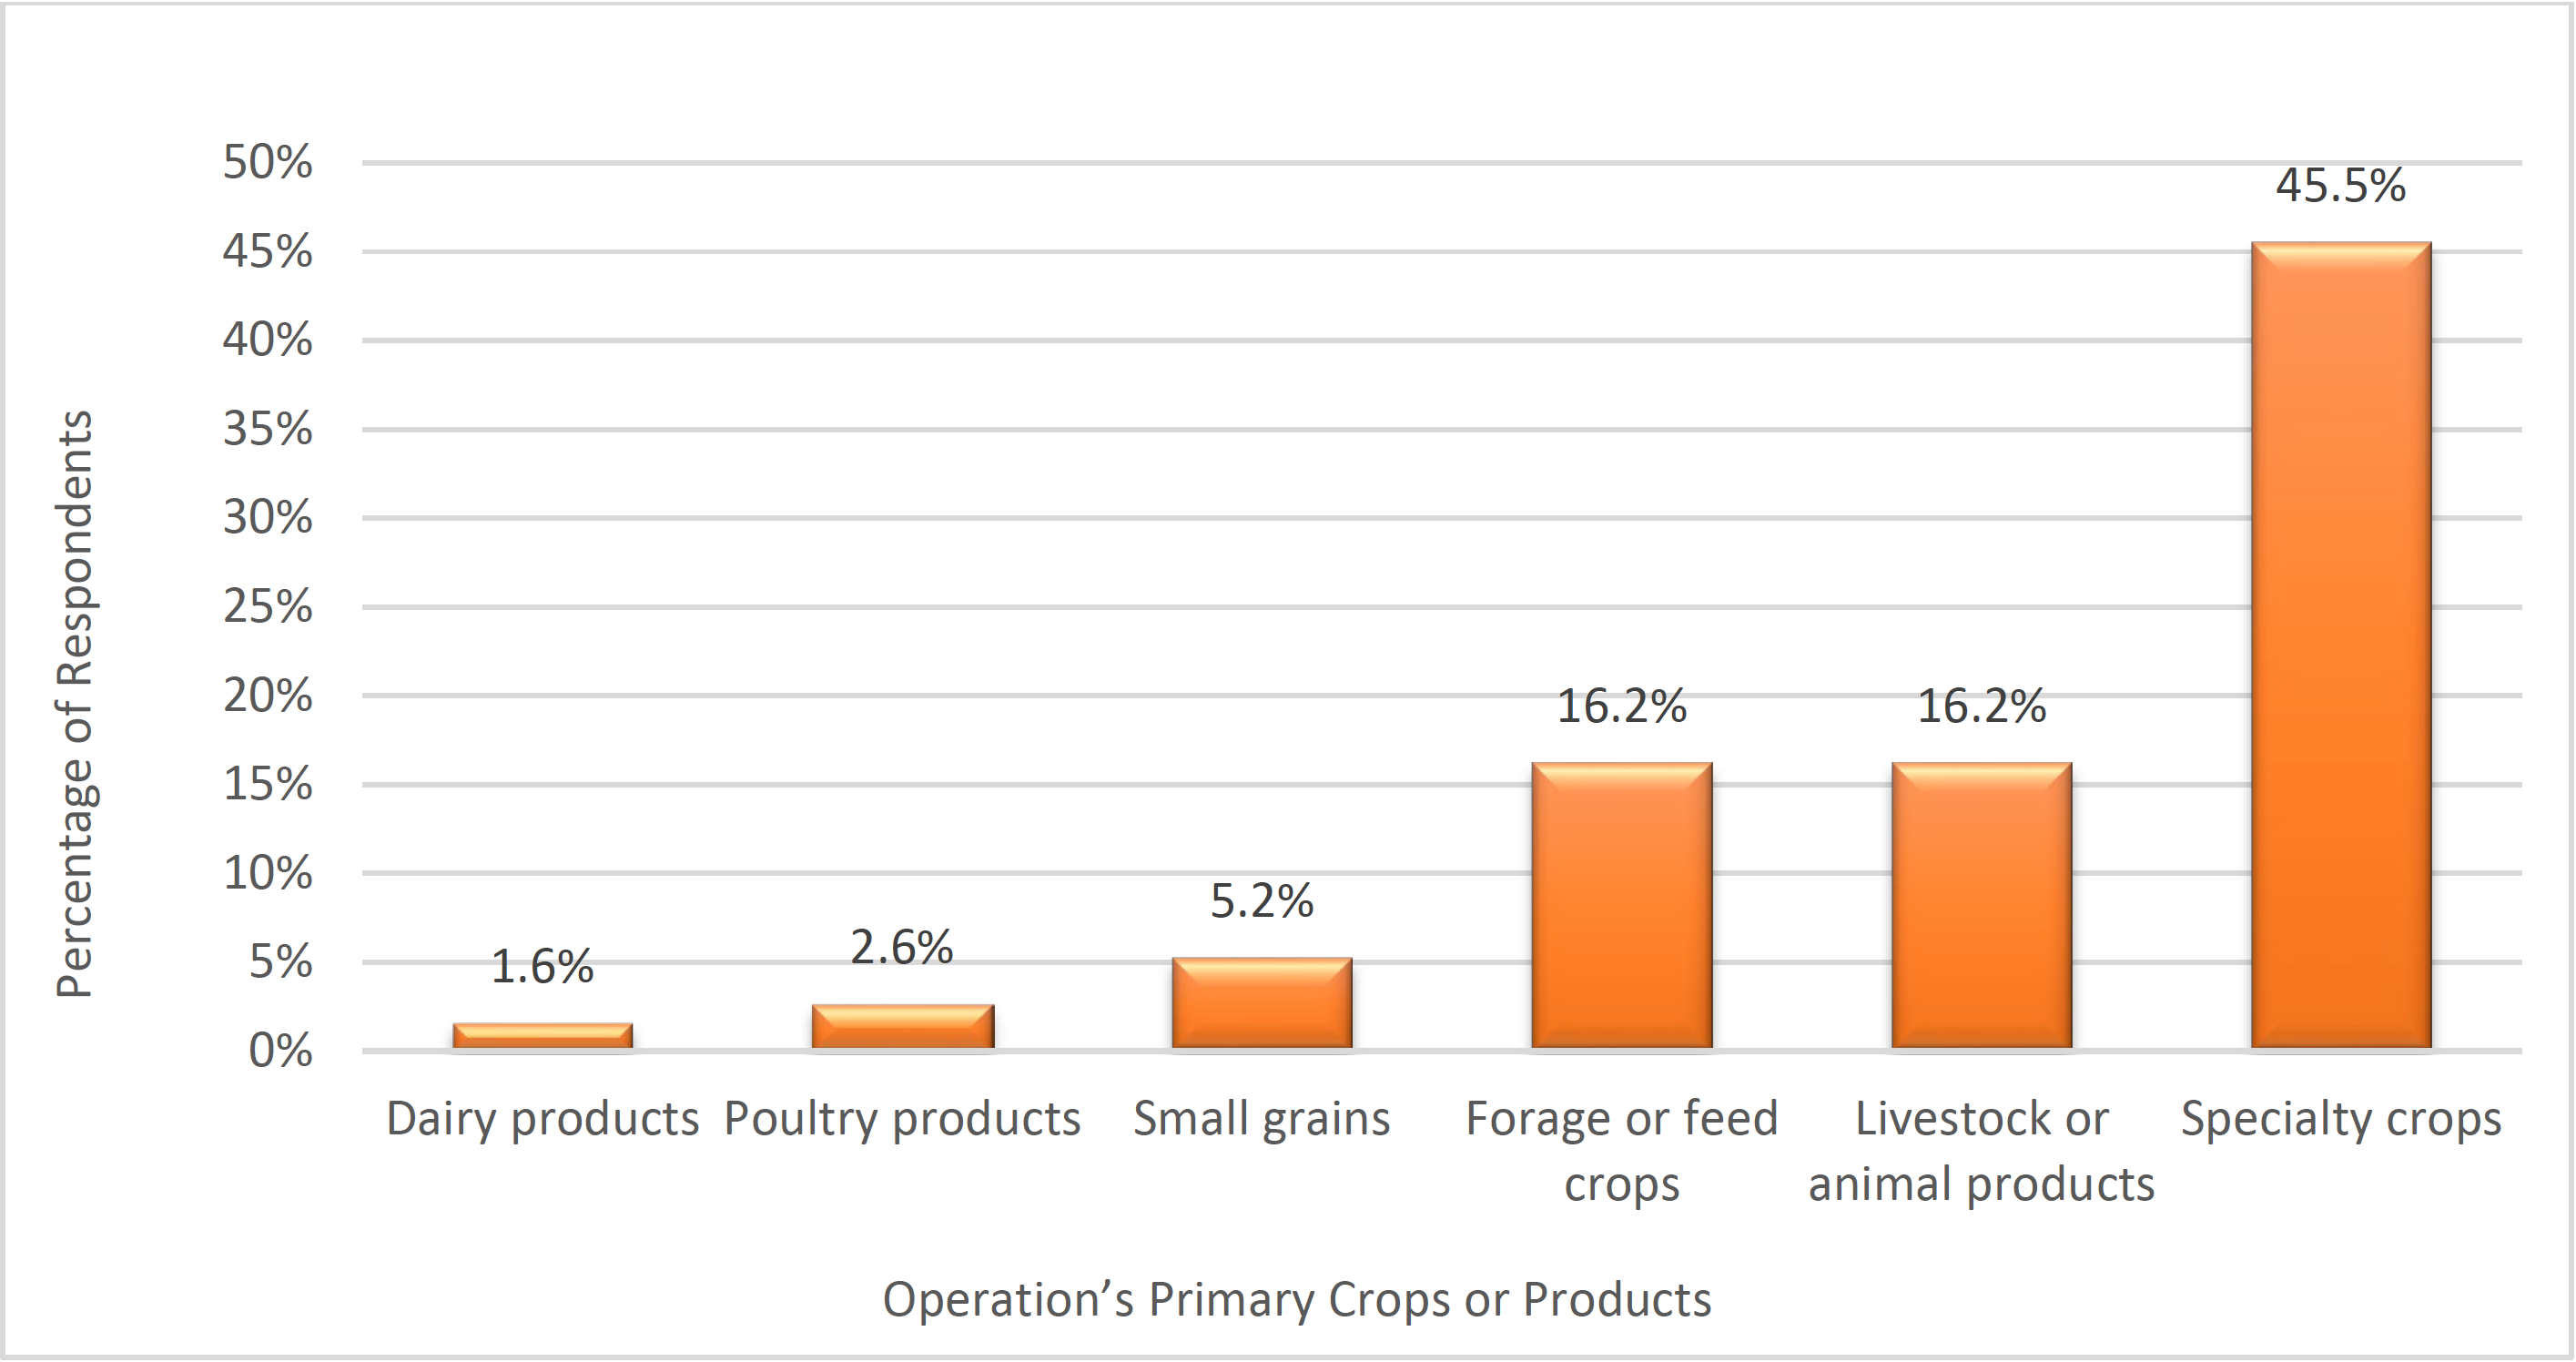
As shown in Figure 1, nearly half of the operations produce specialty crops such as fresh produce and flowers, while both forage or feed crops (alfalfa, grass, pasture, etc.) and livestock or animal products (cattle, sheep, pigs, etc.) each accounted for around 16.0%. Respondents appeared less involved in producing dairy products such as milk or cheese. About half of the respondents indicated that they are not involved in animal production, while about 25.0% reported producing 1 to 100 head, and another 20.0% managed more than 100 head.
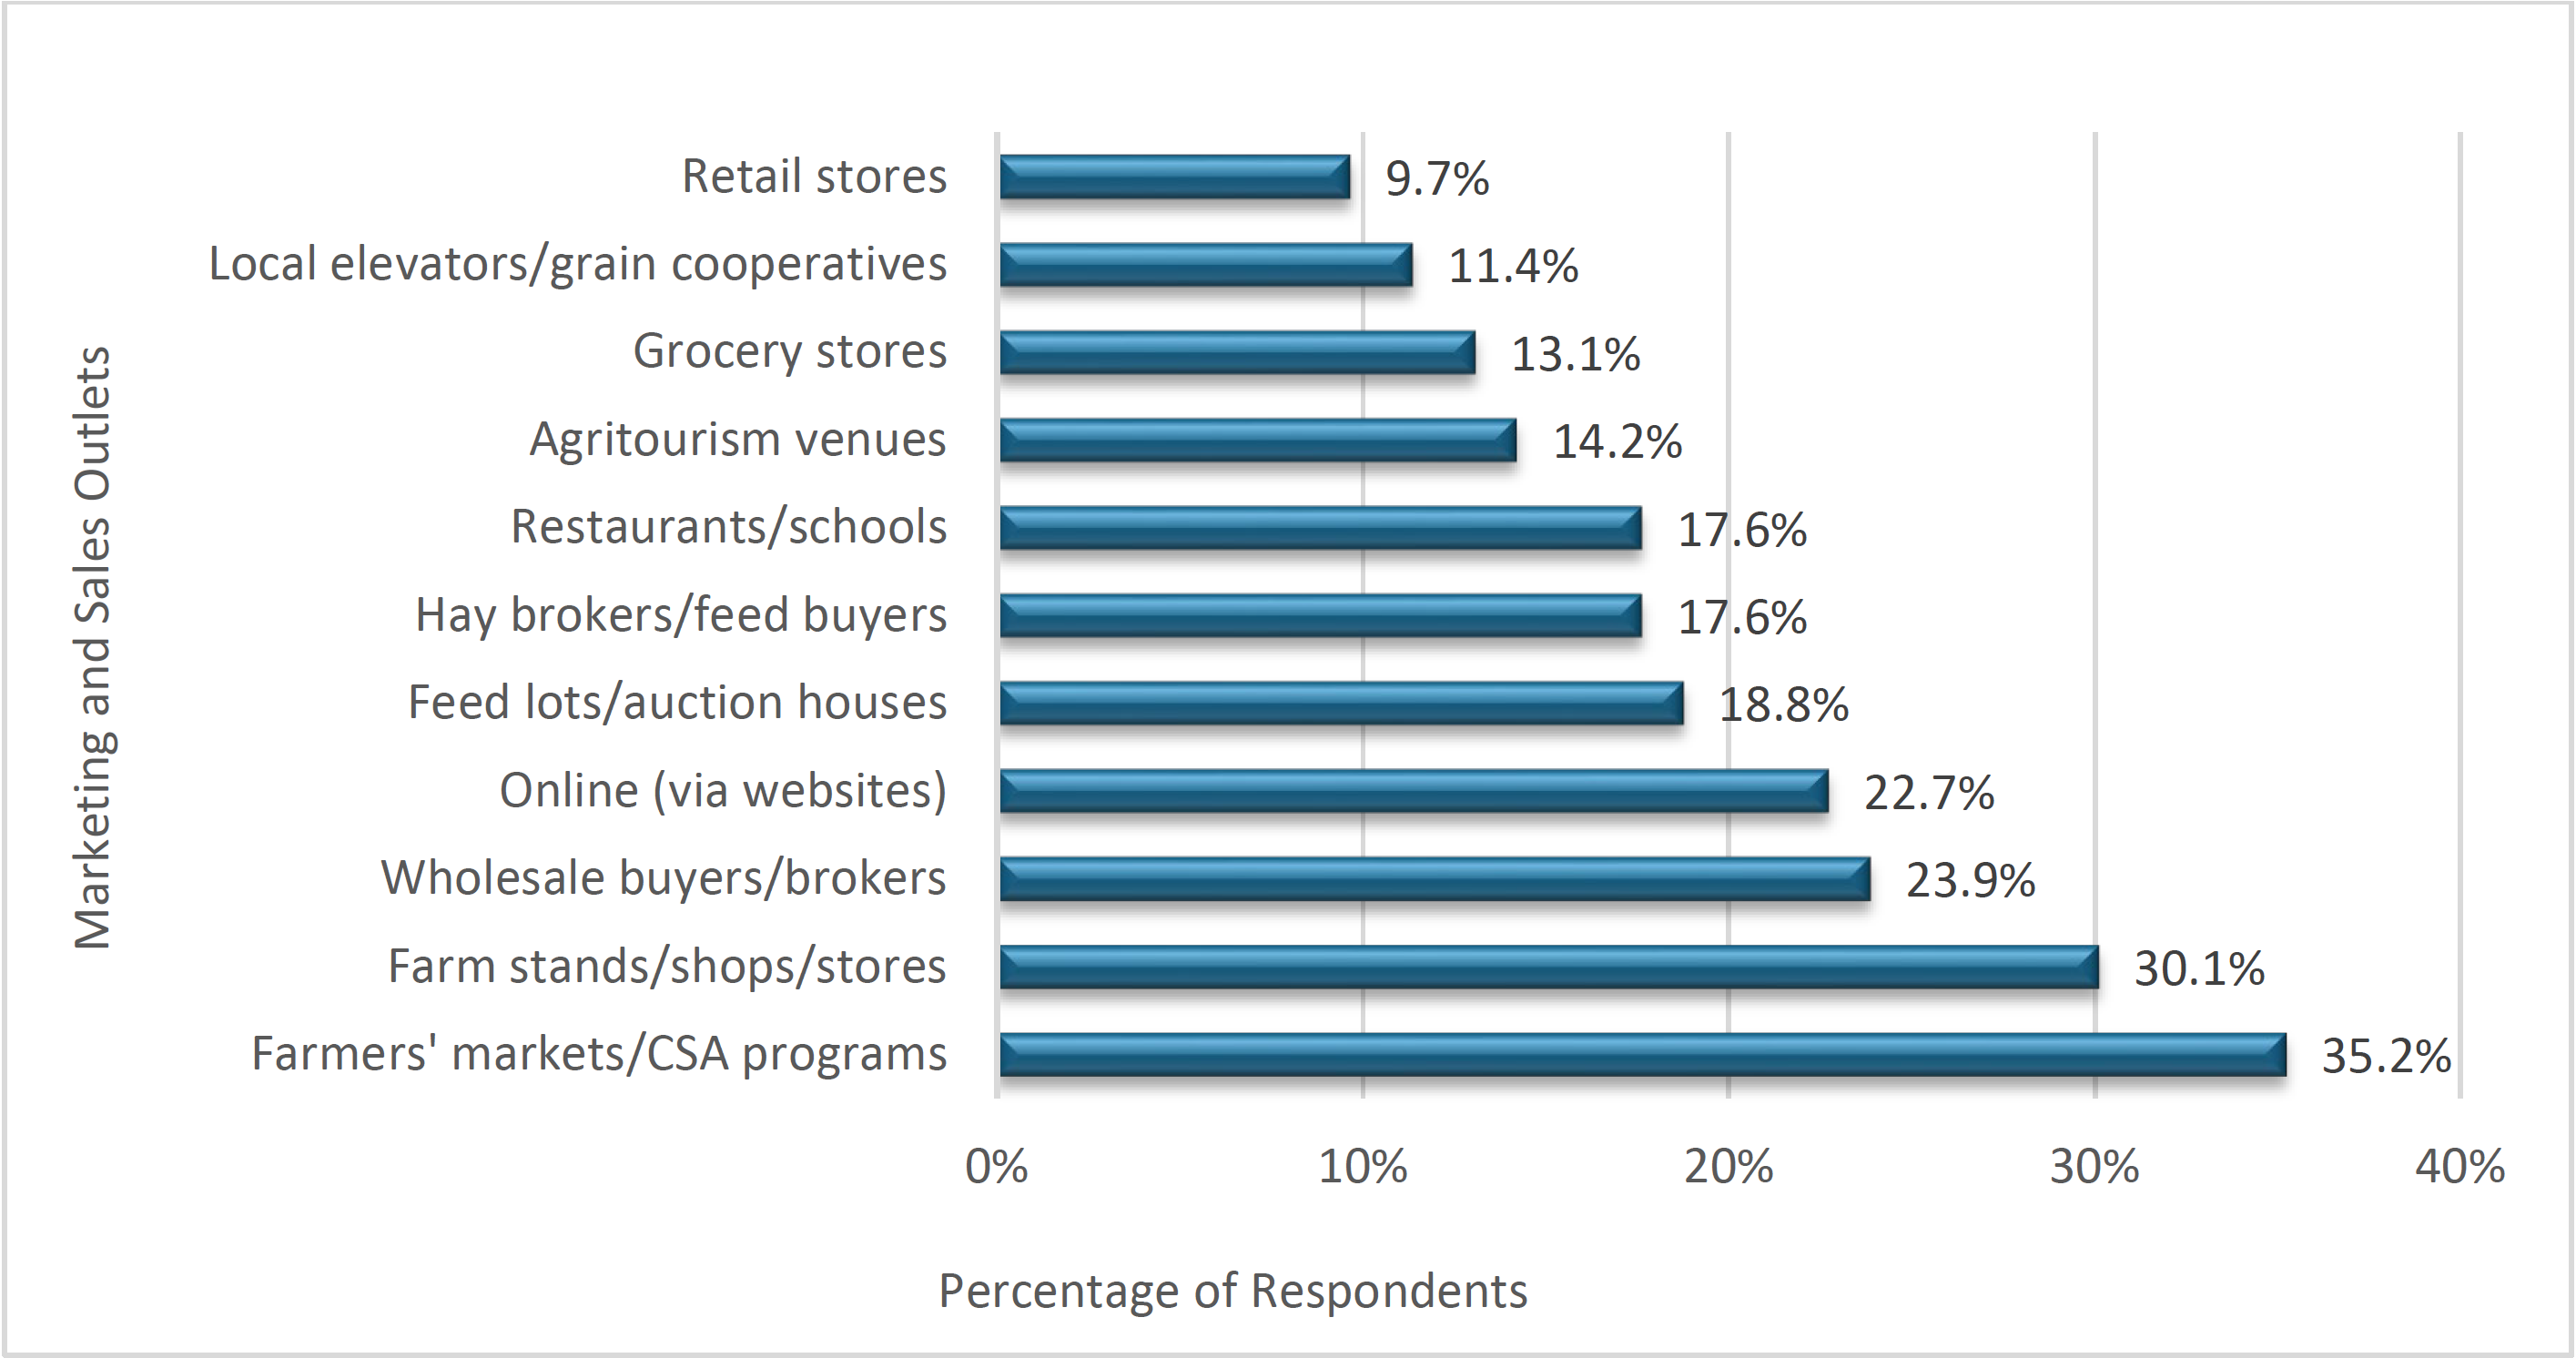
In terms of the operation’s primary markets or sales outlets (see Figure 2), they rely heavily on direct-to-consumer outlets such as farmers markets and community-supported agriculture (CSA) programs (35.2%) and farm stands, shops, or stores (30.1%). Online sales were also notable, used by 22.7% of respondents. Wholesale buyers and brokers and feed lots or auction houses were also important channels. Meanwhile, sales through restaurants or schools and agritourism venues were somewhat common, while retail stores and local elevators or grain cooperatives were the least used outlets.
The results indicate that direct-to-consumer markets are the primary sales outlets, particularly farmers markets, CSAs, and farm stands, shops, or stores. Online sales are also an important channel, suggesting many operations rely on relatively short, direct marketing channels to reach customers.
Organic Production and Interest Overview
When asked whether their operation uses organic production methods, 40.7% of respondents said yes, while less than 1.0% reported having done so in the past (see Table 3). Another 26.9% said they didn’t but had considered it or were interested, and a similar share, 26.3%, said they had no interest in organic production. Certified acres varied among respondents, as 17.9% were fully or almost fully certified organic, and 12.0% had less than 50.0% of their acres certified.
Of the certified organic operations, 22.2% had been certified for less than a year, 33.3% for 6 to 10 years, 27.8% for 11 to 20 years, and 16.7% for more than 20 years. Notably, no respondents reported being certified for 1 to 5 years. Regarding their interest in obtaining a certificate in organic farming at USU, 46.9% of respondents expressed interest, 14.1% were not interested, and 39.1% were unsure.
Overall, these results suggest substantial current and potential interest in organic production among respondents. While close to half already use organic methods, another quarter are interested in or have considered organic production, indicating a sizable group that could potentially transition.
Table 3. Organic Production Details
| Characteristic | Category | Sample (%) |
|---|---|---|
| Organic production methods employed | Yes | 40.7% |
| No, but have done so previously | 0.6% | |
| No, but have considered | 26.9% | |
| No, and have no interest | 26.3% | |
| Unsure | 5.4% | |
| Acres certified organic | None | 48.6% |
| 1% to 25% | 25.4% | |
| 26% to 50% | 13.0% | |
| 51% to 75% | 5.9% | |
| 75% to 100% | 7.0% | |
| Years certified organic | Less than a year | 22.2% |
| 1 to 5 years | 00.0% | |
| 6 to 10 years | 33.3% | |
| 11 to 20 years | 27.8% | |
| More than 20 years | 16.7% | |
| Interest in organic farming certificate | Yes | 4.6.9% |
| No | 14.1% | |
| Unsure | 39.1% |
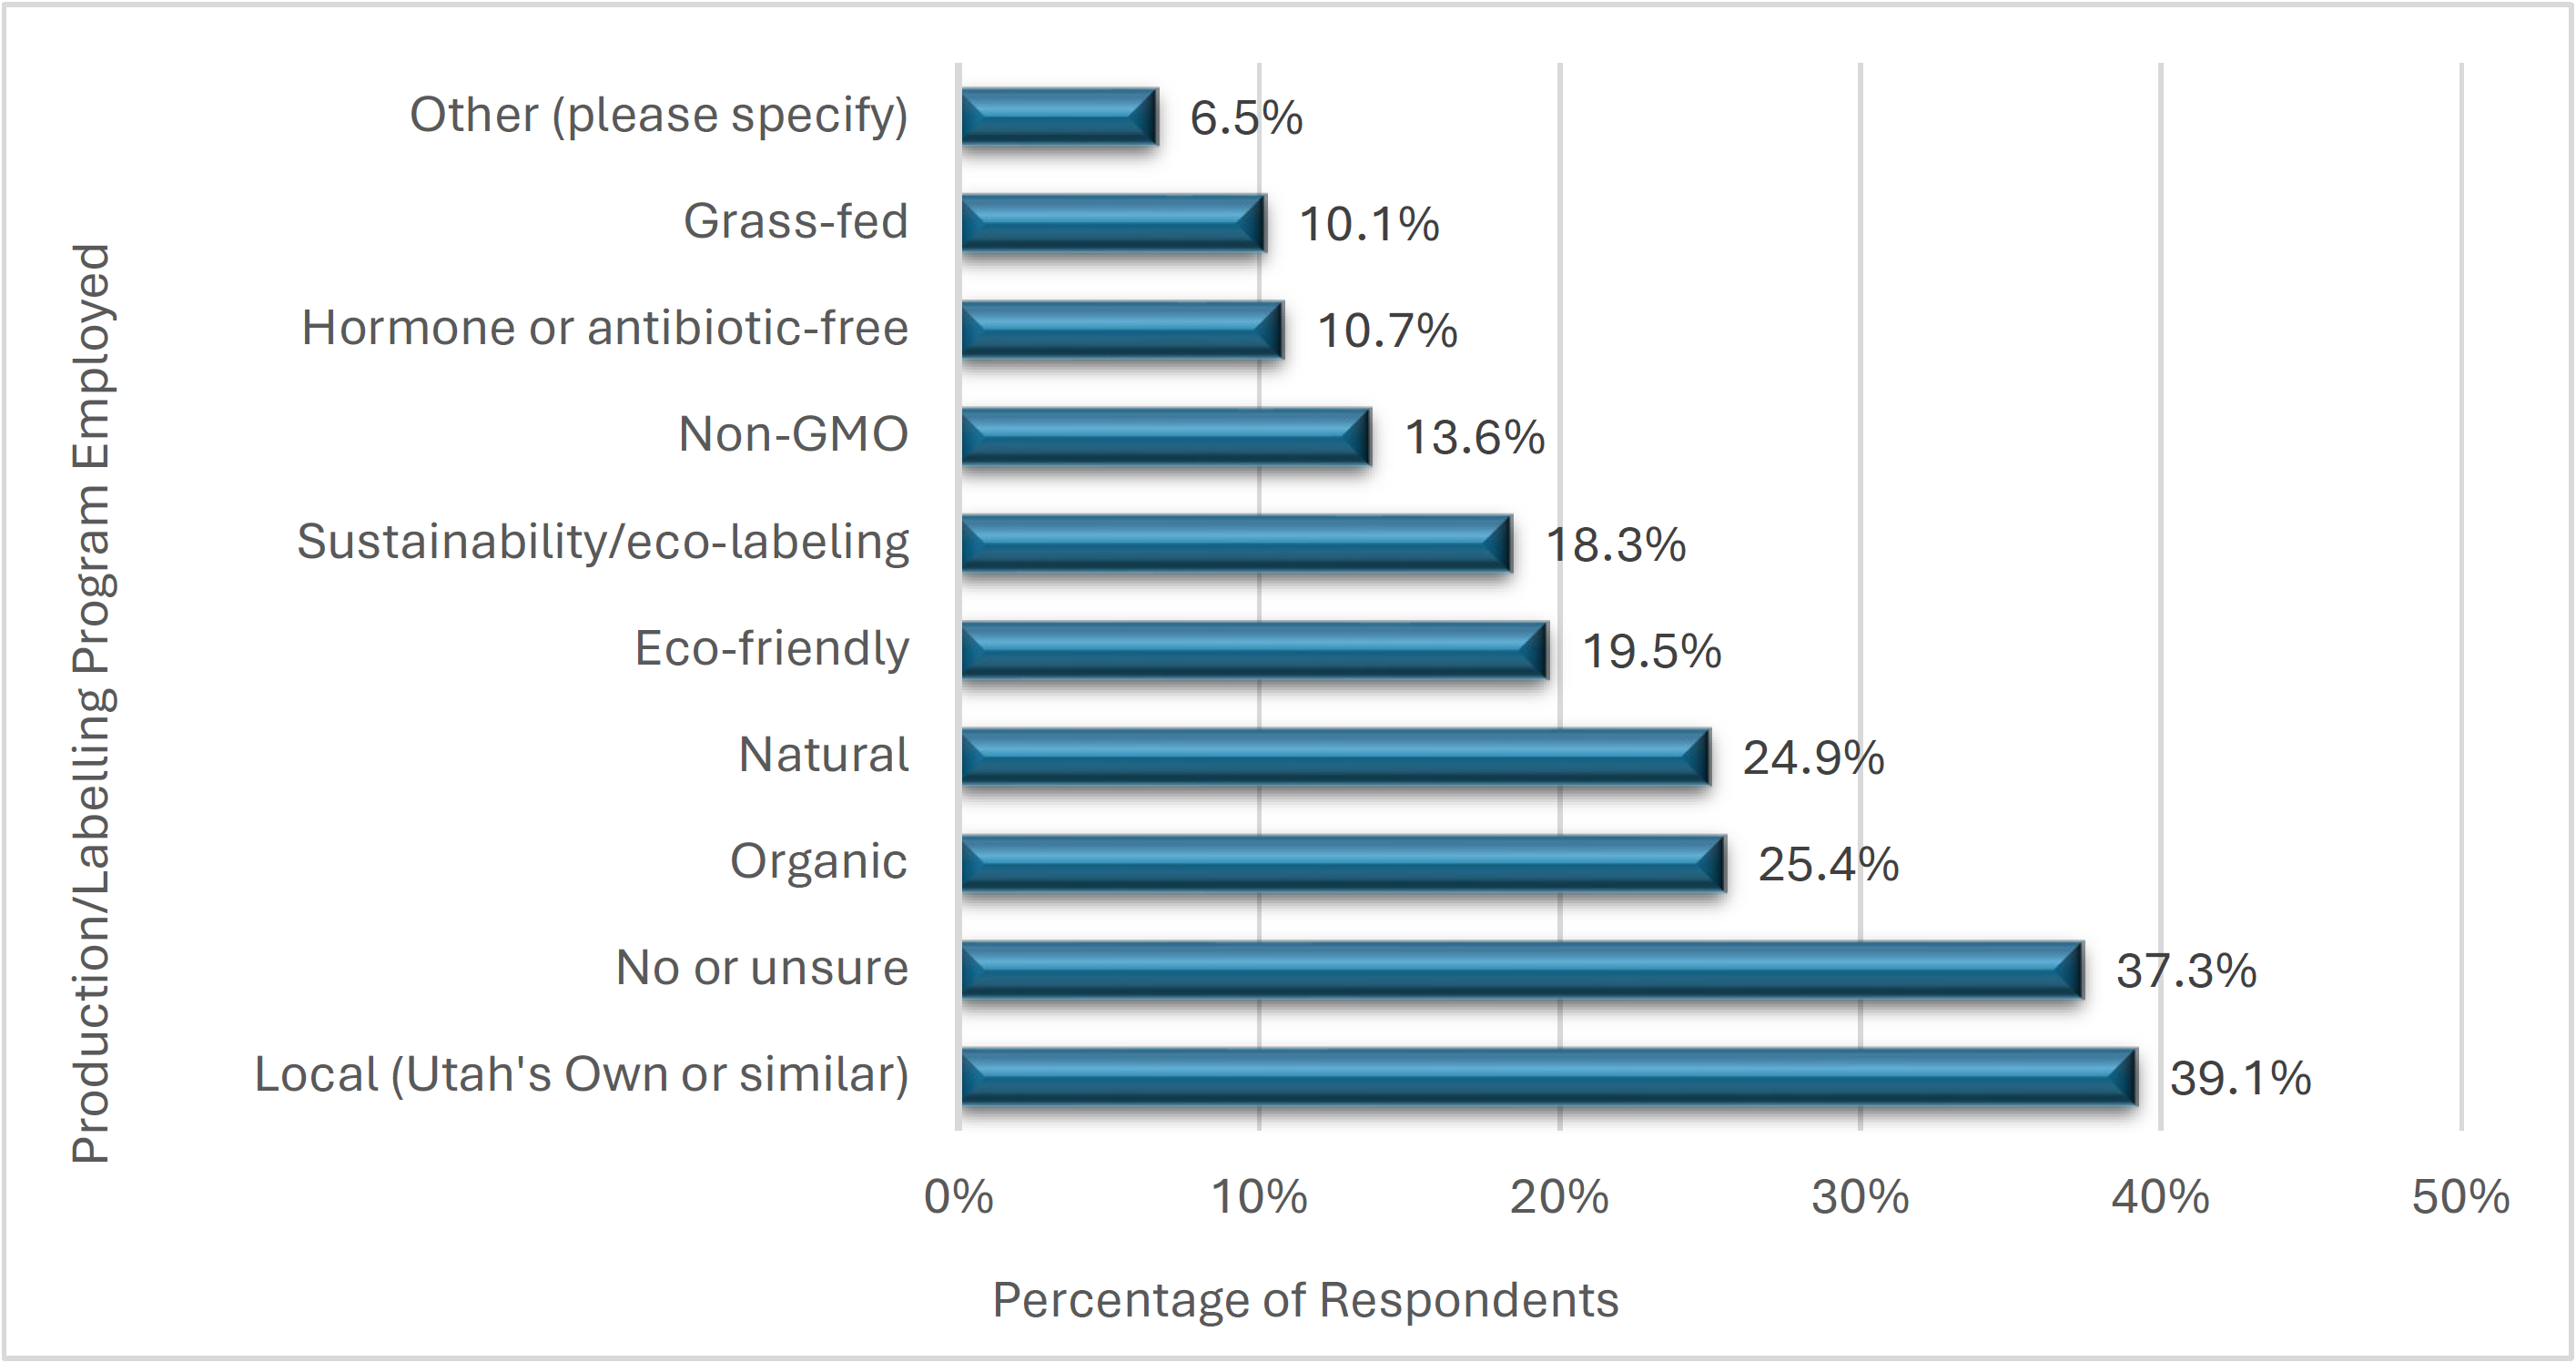
When asked about specific production processes or labelling programs the operation employs or plans to employ, 39.1% of respondents reported participation in local labelling programs such as Utah’s Own (see Figure 3). Another 37.3% indicated they do not use or are unsure about using any labelling program. Around one-fourth reported using organic or natural labels, while fewer (19.0%) adopted eco-friendly or sustainability labels. Non-GMO, hormone- or antibiotic-free, and grass-fed programs were the least common, each reported by fewer than 15.0% of respondents.
The results indicate that local labelling programs are the most widely used, with nearly 40.0% of respondents participating in programs such as Utah’s Own. Organic and natural labels are also relatively common, while environmental and production-specific labels are less frequently used. The sizable share of producers who do not use or are unsure about labelling programs suggests an opportunity for greater education about the potential marketing benefits of certification and labelling.
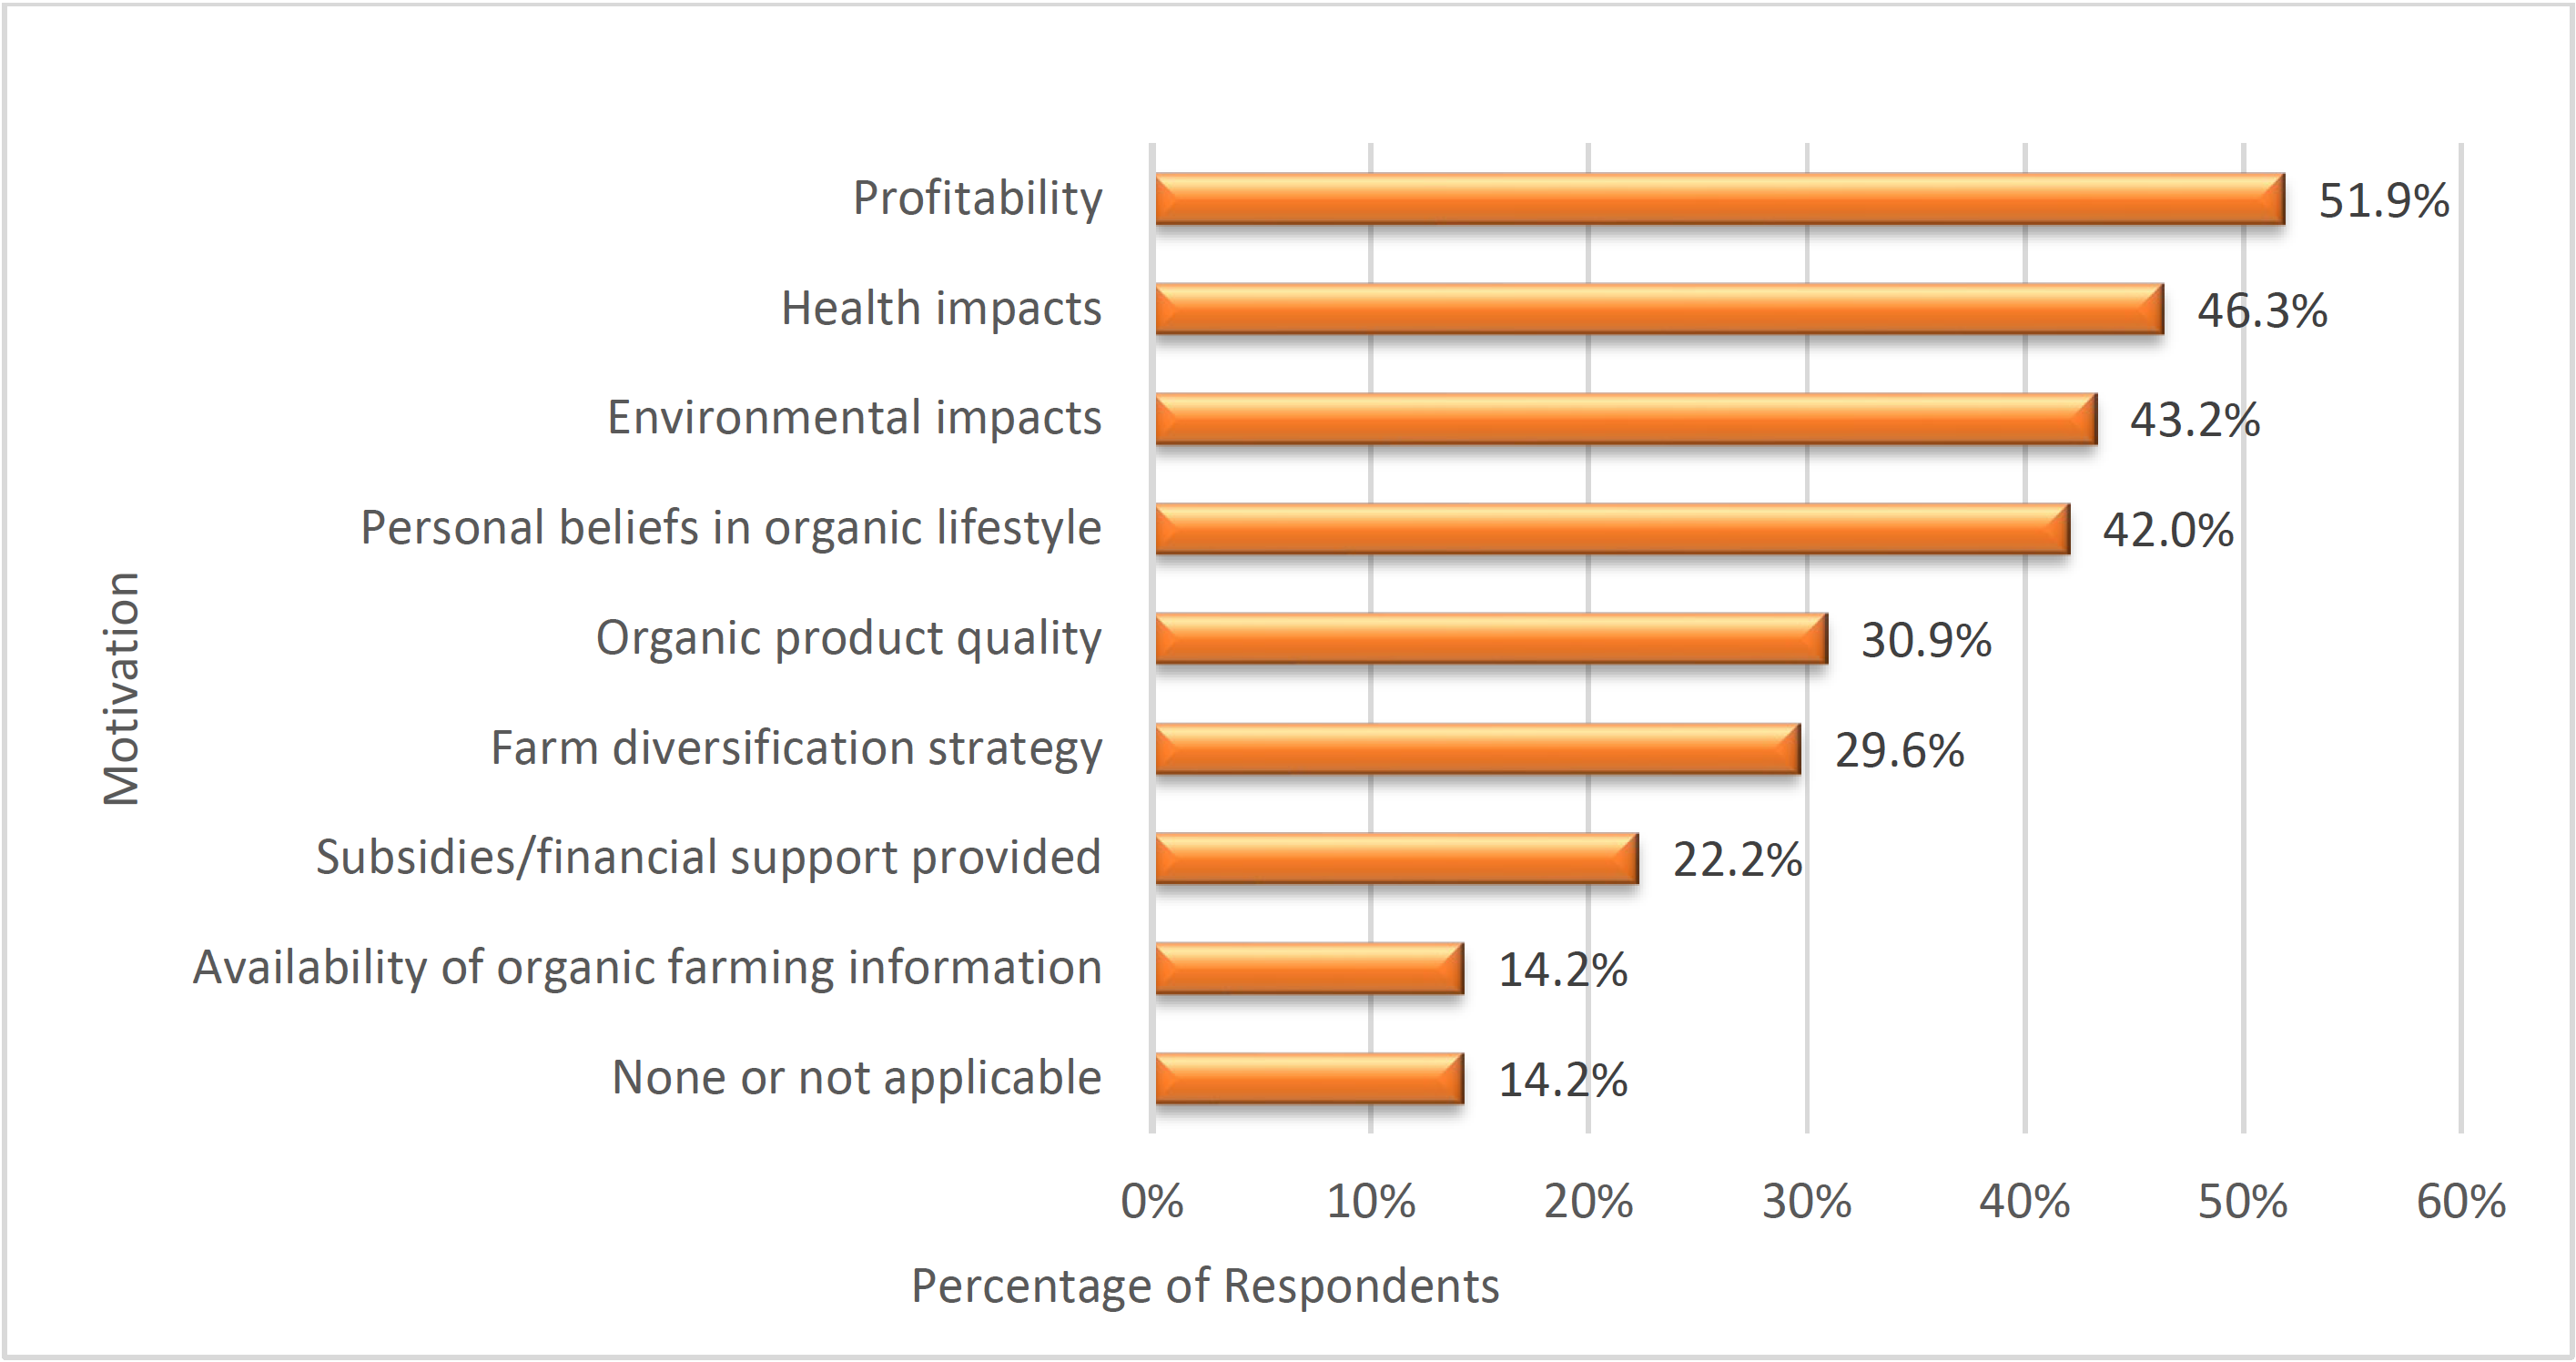
When respondents were asked what motivated them, or what might motivate them, to adopt organic production methods, profitability was the primary factor (51.9%) (see Figure 4). Other significant factors included health impacts (46.3%), environmental impacts (43.2%), and personal beliefs in the organic lifestyle (42.0%). In contrast, the availability of organic farming information was less motivating, with only 14.2% of respondents choosing it. These results show that respondents are more motivated by profitability and the environmental and health impacts of organic production over subsidies and financial support.
Conclusions
Utah's organic agricultural sector remains relatively small in terms of acreage and total agricultural sales, yet it represents an important and growing opportunity for many producers. Study results indicate that respondents represent a diverse range of farming operations, with many operating small farms, marketing directly to consumers through farmers markets, farm stands, and online sales, and producing specialty crops. Although only about 41.0% of respondents currently employ organic production methods, an additional 27.0% have considered adopting organic practices, suggesting substantial interest in organic production among Utah producers. Nearly half of respondents also expressed interest in an educational certificate in organic farming, highlighting continued demand for research-based education and technical assistance.
The study findings also demonstrate that economic considerations remain the primary driver of interest in organic production. Profitability, followed by health and environmental impacts and personal values, were the strongest motivations for adopting organic practices, whereas government subsidies and the availability of production information were less influential. These results suggest that educational programs should emphasize practical production strategies, enterprise profitability, and market opportunities while also addressing producers' environmental and personal stewardship goals. Continued investment in Extension education, technical support, and market development will help producers evaluate whether organic production aligns with their business objectives and provide the resources needed to support successful transitions and long-term viability within Utah's organic agricultural sector.
Acknowledgments
This study was partially funded by the USDA Transition to Organic Partnership Program (TOPP). The authors of this fact sheet used ChatGPT for editing purposes only. Authors reviewed and edited the content provided and take full responsibility for the content.
Reference

September 2026
Utah State University Extension
Peer-reviewed fact sheet
Authors
Kynda Curtis, Professor and USU Extension Specialist, Department of Agricultural and Resource Economics; Salma Shrity, Graduate Research Assistant, Department of Agricultural and Resource Economics; Michele Schahczenski, Organic Outreach Coordinator, Transition to Organic Partnership Program

Kynda Curtis
Food Systems Specialist
APEC Dept

Michele Schahczenski
Organic Outreach Coordinator | Certified Organic & TOPP
Agriculture and Natural Resources
Related Research

Agricultural Producer and Food Maker Food Processing Operation Needs Assessment Overview
Utah State University’s 2024 needs assessment explores the educational, funding, and infrastructure needs of Utah farmers, ranchers, and food makers involved in value-added food production. Results highlight respondent demographics, products, markets, lab

Assessing Utah's Agricultural Producer and Small Processor Interest in Value-Added Food Production
This fact sheet presents findings from a study on value-added food production among Utah farmers, ranchers, and food processors. Highlighting operational characteristics, production timelines, markets, sales goals, and key resources needed to support loca

Target Consumers for Beef Jerky
This study identifies the target market for packaged beef jerky in the western U.S., highlighting consumer demographics, purchasing habits, and willingness to pay premiums for organic, grass-fed, and locally sourced products.

Target Consumers for Bottled Mild Salsa
This fact sheet summarizes USU research on western U.S. consumers who purchase mild salsa, highlighting their demographics, food habits, and preferences. Target consumers are middle-aged, highly educated, engaged in local food systems, and willing to pay

Target Consumers for Bottled Tart Cherry Juice
This fact sheet provides an overview of the study results conducted by Utah State University to determine western U.S. consumer preferences and willingness to pay for regionally sourced processed food products. This fact sheet addresses target consumers f
The Organic Educational and Resource Needs of Utah's Agricultural Producers
USU researchers identify Utah producers’ top organic education and resource needs. Findings highlight certification, support programs, marketing, and hands-on learning.
The Organic Production Interests of Utah's Agricultural Producers
USU researchers surveyed Utah agricultural producers to understand their interest in organic production and the factors influencing their decisions. The findings highlight educational and resource needs for organic agriculture.
U.S. West Consumer Preferences for Specialty Labeled Processed Foods
Highlighting consumer preferences and willingness to pay for specialty-labeled processed foods, including organic, local, grass-fed, and non-GMO products. Survey results show strong consumer value for health, safety, freshness, and transparency, especiall

U.S. West Consumer Processed Food Preferences and Consumption Habits
This article summarizes a 2024 Utah State University study examining processed food preferences and purchasing behaviors among 1,282 consumers across the western United States. Findings highlight key values such as taste, price, product quality, and trust
Utah's Value-Added Food Processing Options
Explaining what value-added foods are and how producers can increase profit through processing, direct marketing, and vertical integration. Also outlining Utah’s regulatory options and programs to help small food businesses choose the right path for produ