Assessing Utah’s Agricultural Producer and Small Processor Interest in Value-Added Food Production

Introduction
Respondent Categories Defined
Farmers:
Farmers include agricultural operations involved in crop-based food and fiber production.
Ranchers:
Ranchers include agricultural operations involved in livestock production, including milk.
Food processor:
Food makers include operations involved in processing food or food products for human consumption.
To identify the educational, funding, and resource needs of Utah’s agricultural producers and food processors related to value-added food production, Utah State University (USU) conducted a study using data collected via two online surveys in early 2024. The first survey targeted Utah farmers and ranchers who currently produce or are considering producing value-added foods. A total of 426 farmers and ranchers completed the survey, of which 134 farmers and 69 ranchers were involved in or planning to engage in food processing activities. The second survey, distributed to small food processors across Utah, received 89 responses, with 50 participants currently producing or planning to produce value-added foods.
While the two surveys were customized for each audience, they were largely the same. Questions focused on operational characteristics such as location, years in business, number of employees, and annual sales. Respondents were also asked about their operation’s current products and markets, reasons for adding processed or value-added products, and—if applicable—their processed products, sales goals, timelines, and use of market or specialty labeling programs. Additional questions explored which tools and resources were most useful to their operations, which were difficult to access, and the main challenges or obstacles they faced in their food processing operation.
This fact sheet provides an overview of the study’s results on respondents’ operational details, including years in business, number of employees, and annual sales, as well as their interest in and rationale for expanding into value-added food production. It also discusses their current or planned timeframe for processing operation implementation, the types of products and markets involved, processing locations, and sales projections. Finally, it highlights the resources, tools, information, and services respondents identified as most useful for their processing operations. These results will assist Extension faculty, policymakers, agricultural organizations, and local economic development agencies to more effectively target programs and resources that support value-added food production across Utah. By understanding producers’ needs, challenges, and resource gaps, these groups can develop tailored training, funding opportunities, and infrastructure investments that strengthen local food systems, enhance farm profitability, and promote rural economic growth.
Results Overview
Operation Details
As shown in Table 1, most of the survey respondents were the owner/operator of the operation or involved in administration or management at a minimum. The average number of employees across all respondent groups was two to five, but processors were more likely to have more than 20 employees, while farmers were more likely to have one or fewer employees.
Although at least half of all three groups reported their operation was supported by off-farm income, ranchers had the highest annual gross sales across the three groups, with over half (52%) of the ranchers reporting sales of $100,000 or more, compared to 34% of the processors and 26% of the farmers. Processors had a greater proportion with annual sales under $10,000. Additional survey respondent demographics and operation details can be found in the fact sheet titled “Agricultural Producer and Food Maker Food Processing Operation Needs Assessment Overview.”
Table 1. Operation Details by Operation Type
| Characteristic | Category | Processors (n = 50) | Ranchers (n = 69) | Farmers (n = 134) |
|---|---|---|---|---|
| Years in operation | None/still planning Less than 1 year 1–5 years 6–10 years 11–20 years More than 20 years |
18% 4% 36% 10% 14% 18% |
- 1.5% 13% 7.3% 10.1% 68.1% |
- 8.2% 30.6% 9% 11.9% 40.3% |
| Number of employees | Not applicable/still planning 1 or less 2–5 6–10 11–20 More than 20 |
20% 26% 34% 2% 8% 10% |
- 29.4% 55.9% 13.2% 0% 1.5% |
- 33.6% 41% 13.9% 4.1% 7.4% |
| Annual gross sales | Not applicable $10,000 or less $10,001–$25,000 $25,001–$50,000 $50,001–$100,000 $100,001–$200,000 $200,001–$500,000 More than $500,000 |
18% 28% 8% 2% 10% 12% 8% 14% |
8.9% 10.5% 10.5% 6% 11.9% 13.4% 17.9% 20.9% |
7.5% 24.2% 18.3% 7.5% 16.7% 8.3% 6.7% 10.8% |
| Role in operation | Owner/partner General manager/CEO Marketing manager Distribution/logistics manager Production manager Administration Other |
88% 2% 2% 0% 0% 0% 8% |
79.7% 5.8% 3% 0% 1.5% 4.4% 5.8% |
76.6% 2.9% 4.4% 0% 2.9% 4.4% 8.8% |
Value-Added Food Production Interest
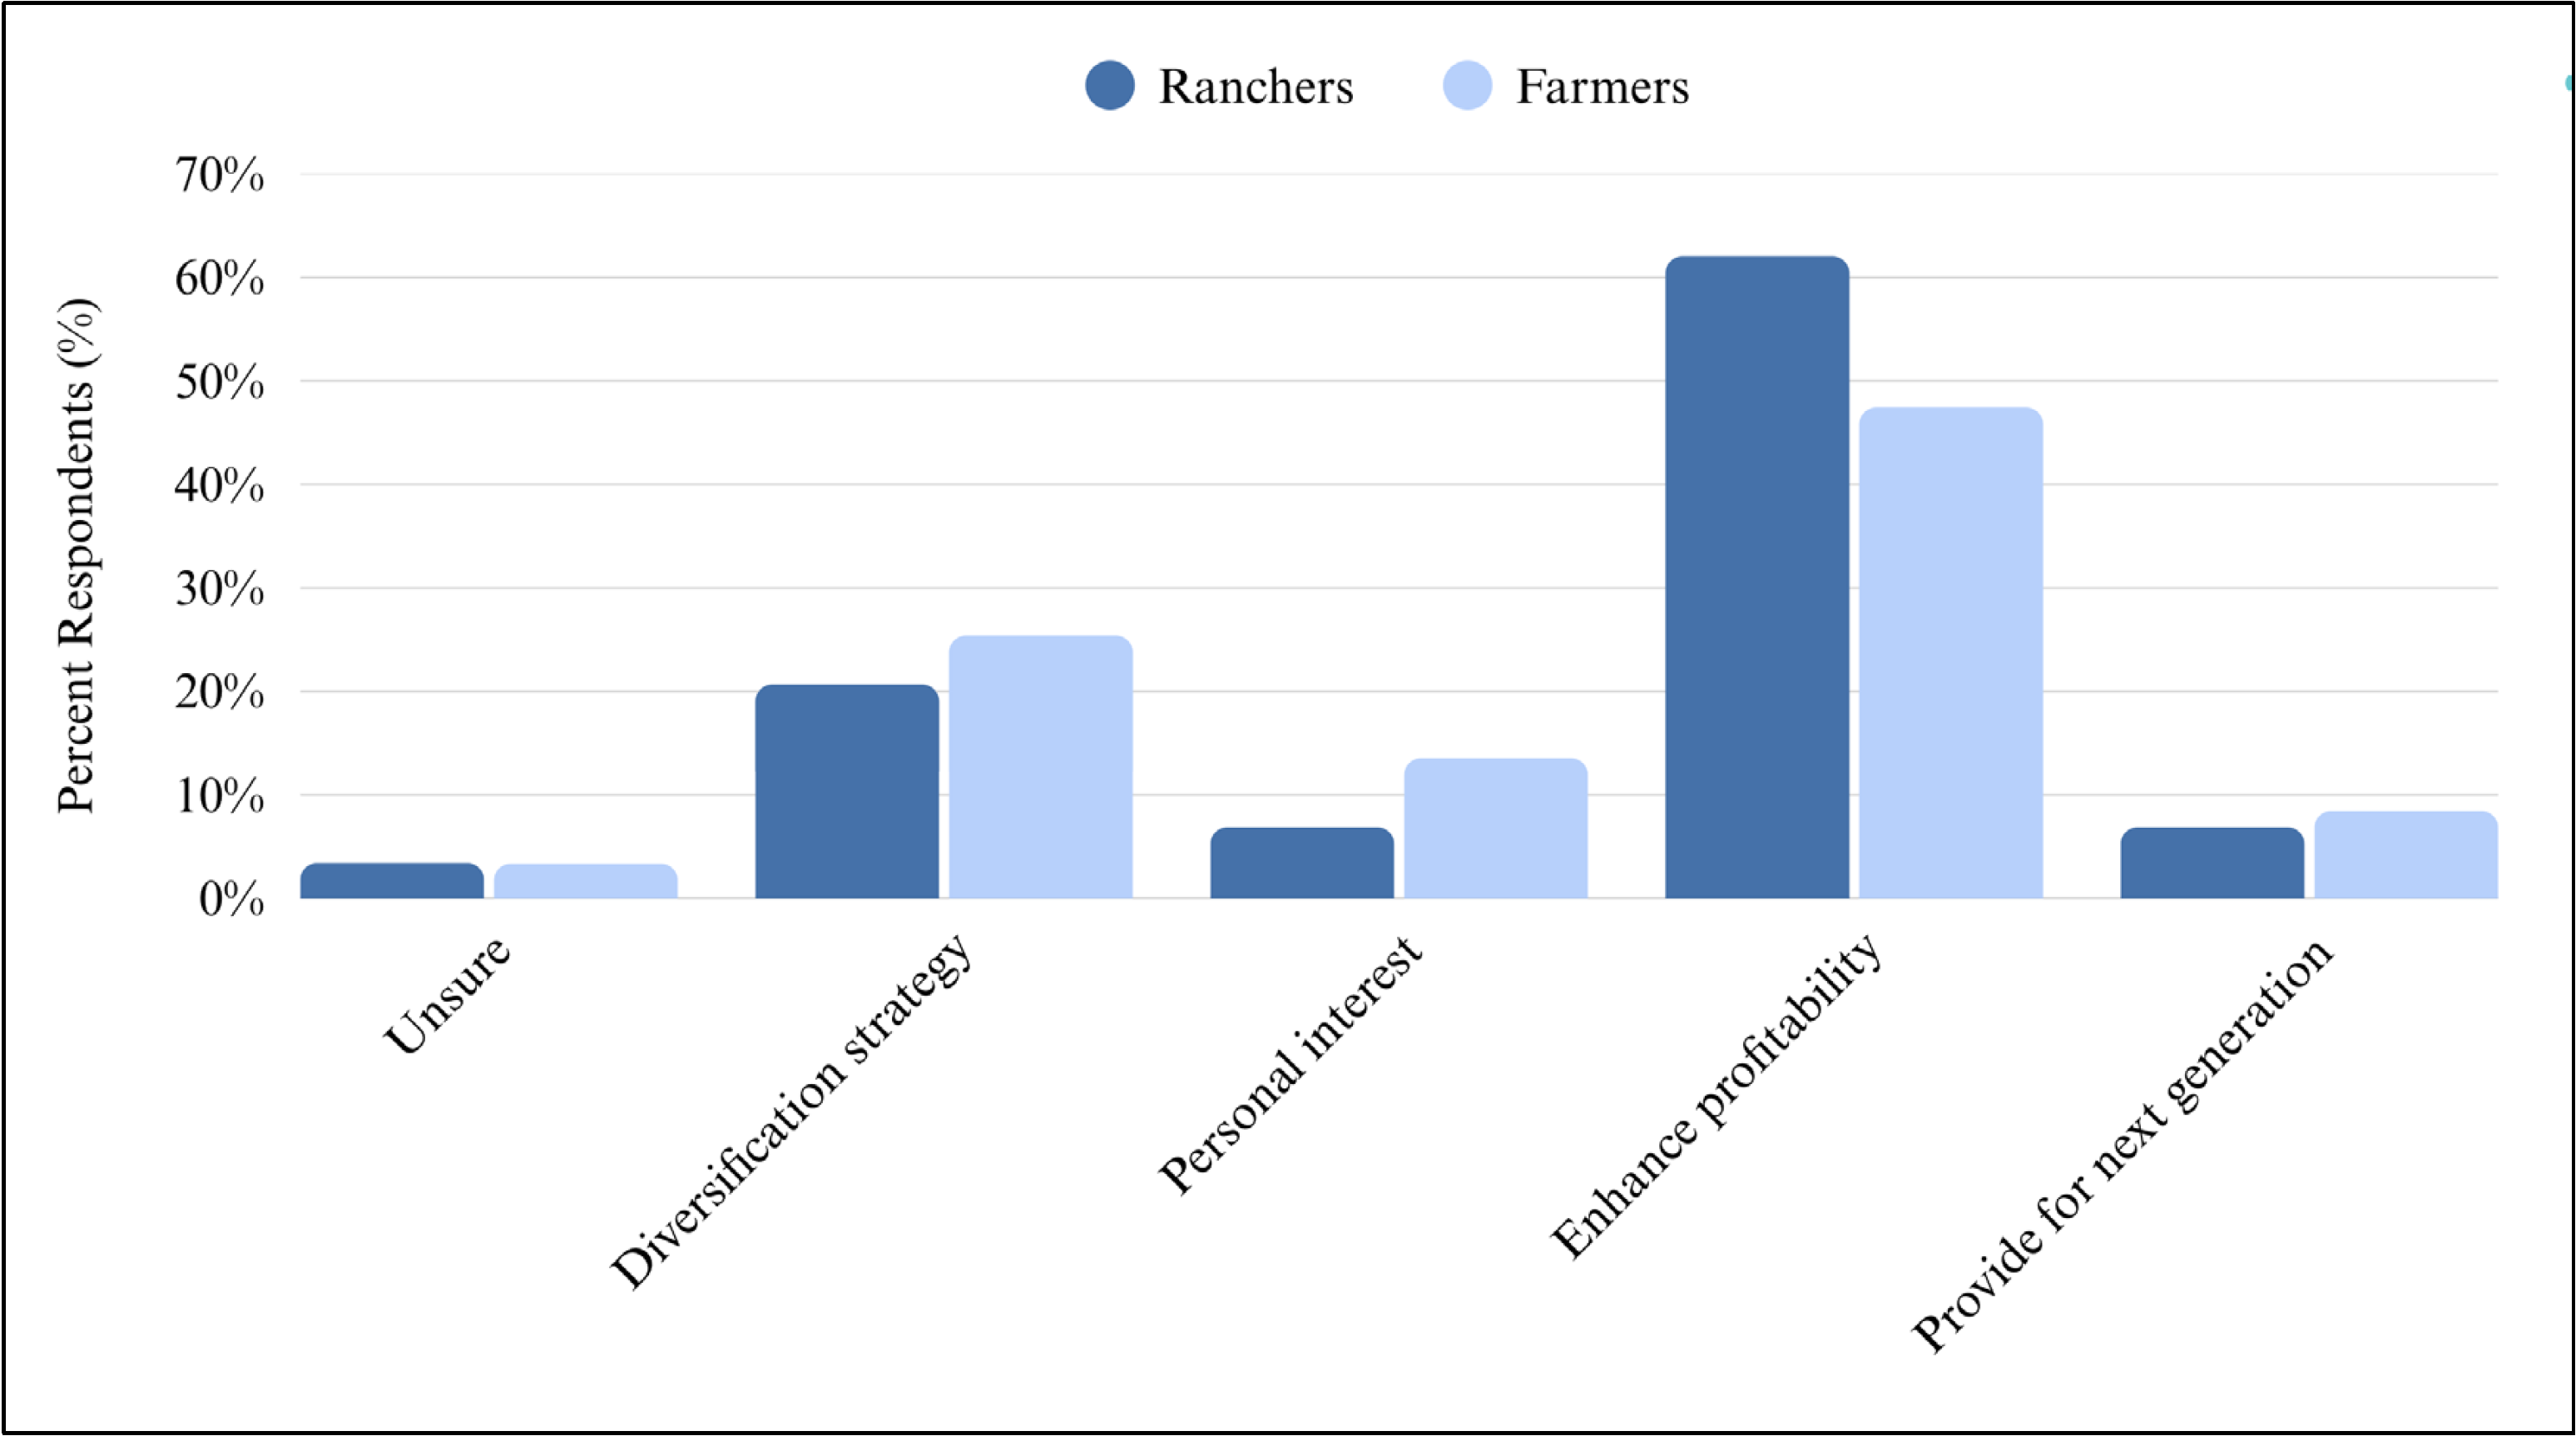
To understand why the operation had chosen or planned to produce processed/value-added foods, the survey asked that they describe their reasoning (see Figure 1). For both farmers and ranchers, the most common reason for expanding into value-added products was to enhance profitability, followed by a diversification strategy. For both food processors and ranchers, the most common timeframe for expansion was within the next year. None of the farmers indicated that expansion into processed foods had begun, but significantly more farmers than food processors or ranchers reported that expansion would begin within the next six months.
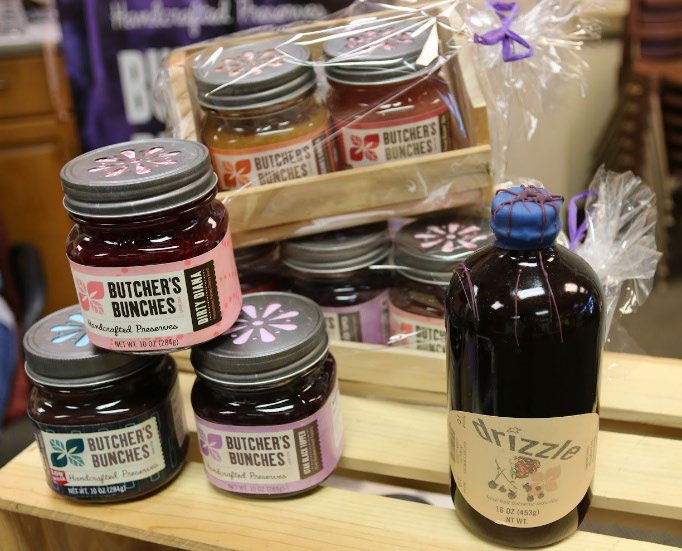
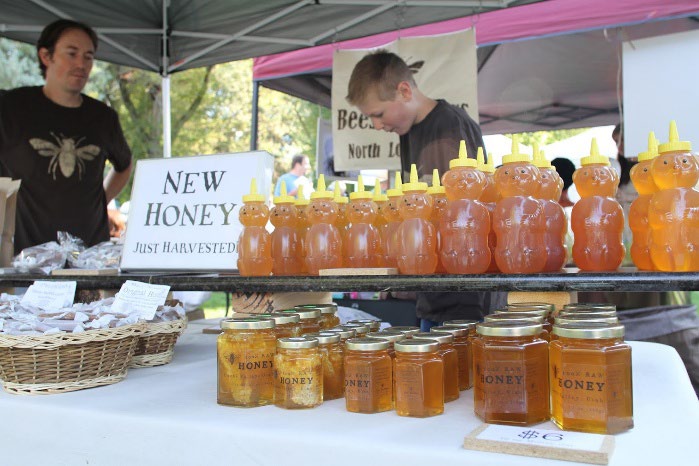
As shown in Table 2, the most common value-added operations farmers planned to introduce were agritourism activities (28%), such as farm tours, classes, corn mazes, etc., followed by dried fruits and vegetables and canned or bottled fruits. Food processors commonly produced canned or bottled fruits such as jams and jellies, which were selected by 38% of the food processors, followed by bread, pastry, and nut products. The majority (80%) of the ranchers produced or planned to produce meat and poultry products, including fresh or frozen meat cuts and jerky products, followed by agritourism activities.
For all groups, at least half (50%) of the respondents reported that the value-added products were or would be produced at their current business location. A significant proportion of ranchers also indicated that their products were processed at a contractor location, likely due to the equipment and tools required as well as the safety inspections needed for processing meat and poultry products.
Across all three groups, a large proportion of respondents were unsure of the annual sales target for the new value-added products. Because so many respondents were unsure of their sales goals, operations may benefit from training related to market and sales planning.
Table 2. Value-Added Food Production Details by Operation Type
| Characteristic | Category | Processors (n = 50) | Ranchers (n = 69) | Farmers (n = 134) |
|---|---|---|---|---|
| Value-added production timeline |
Unsure Expansion already begun Begin within the next 6 months Begin within the next year Begin within 2–3 years Still more than 3 years out |
27% 23% 10% 30% 10% 0% |
20.7% 3.5% 27.6% 41.4% 6.9% 0% |
23.7% 0% 33.9% 27.1% 3.4% 11.9% |
| Value-added products produced/ planned |
Unsure Juice products Canned or bottled fruits Canned or bottled vegetables Frozen foods Dried fruits and vegetables Nut products Meat and poultry products Bread and pastry products Dairy products Honey or honey-based products Sauces Seasonings Candy products Candles, soaps, or cosmetics Agritourism opportunities Pet food Other |
8% 20% 38% - 24% 16% 34% 6% 30% 10% 22% 14% 26% 12% 16% 28% 10% 18% |
7.3% 0% 4.4% 1.5% 0% 1.5% 0% 79.7% 3% 6% 7.3% 1.5% 1.5% 0% 4.4% 10.1% 3% 7.3% |
8.2% 17.9% 23.1% 18.7% 10.5% 27.6% 7.5% 16.4% 11.2% 5.2% 13.4% 7.5% 18.7% 5.2% 12.7% 34.3% 3% 20.2% |
| Processing location |
Unsure Current business location Rented or leased location Contractor location Other |
14% 74% 8% 2% 2% |
18.2% 57.6% 0% 22.7% 1.5% |
11% 76.3% 5.9% 5.9% 0.9% |
| Annual sales targets |
Unsure $10,000 or less $10,001–$25,000 $25,001–$50,000 $50,001–$75,000 $75,001–$100,000 More than $100,000 |
43% 17% 10% 3% 3% 7% 17% |
41.4% 3.5% 13.8% 10.3% 10.3% 3.5% 17.2% |
20.7% 20.7% 29.3% 10.3% 3.5% 7% 8.6% |
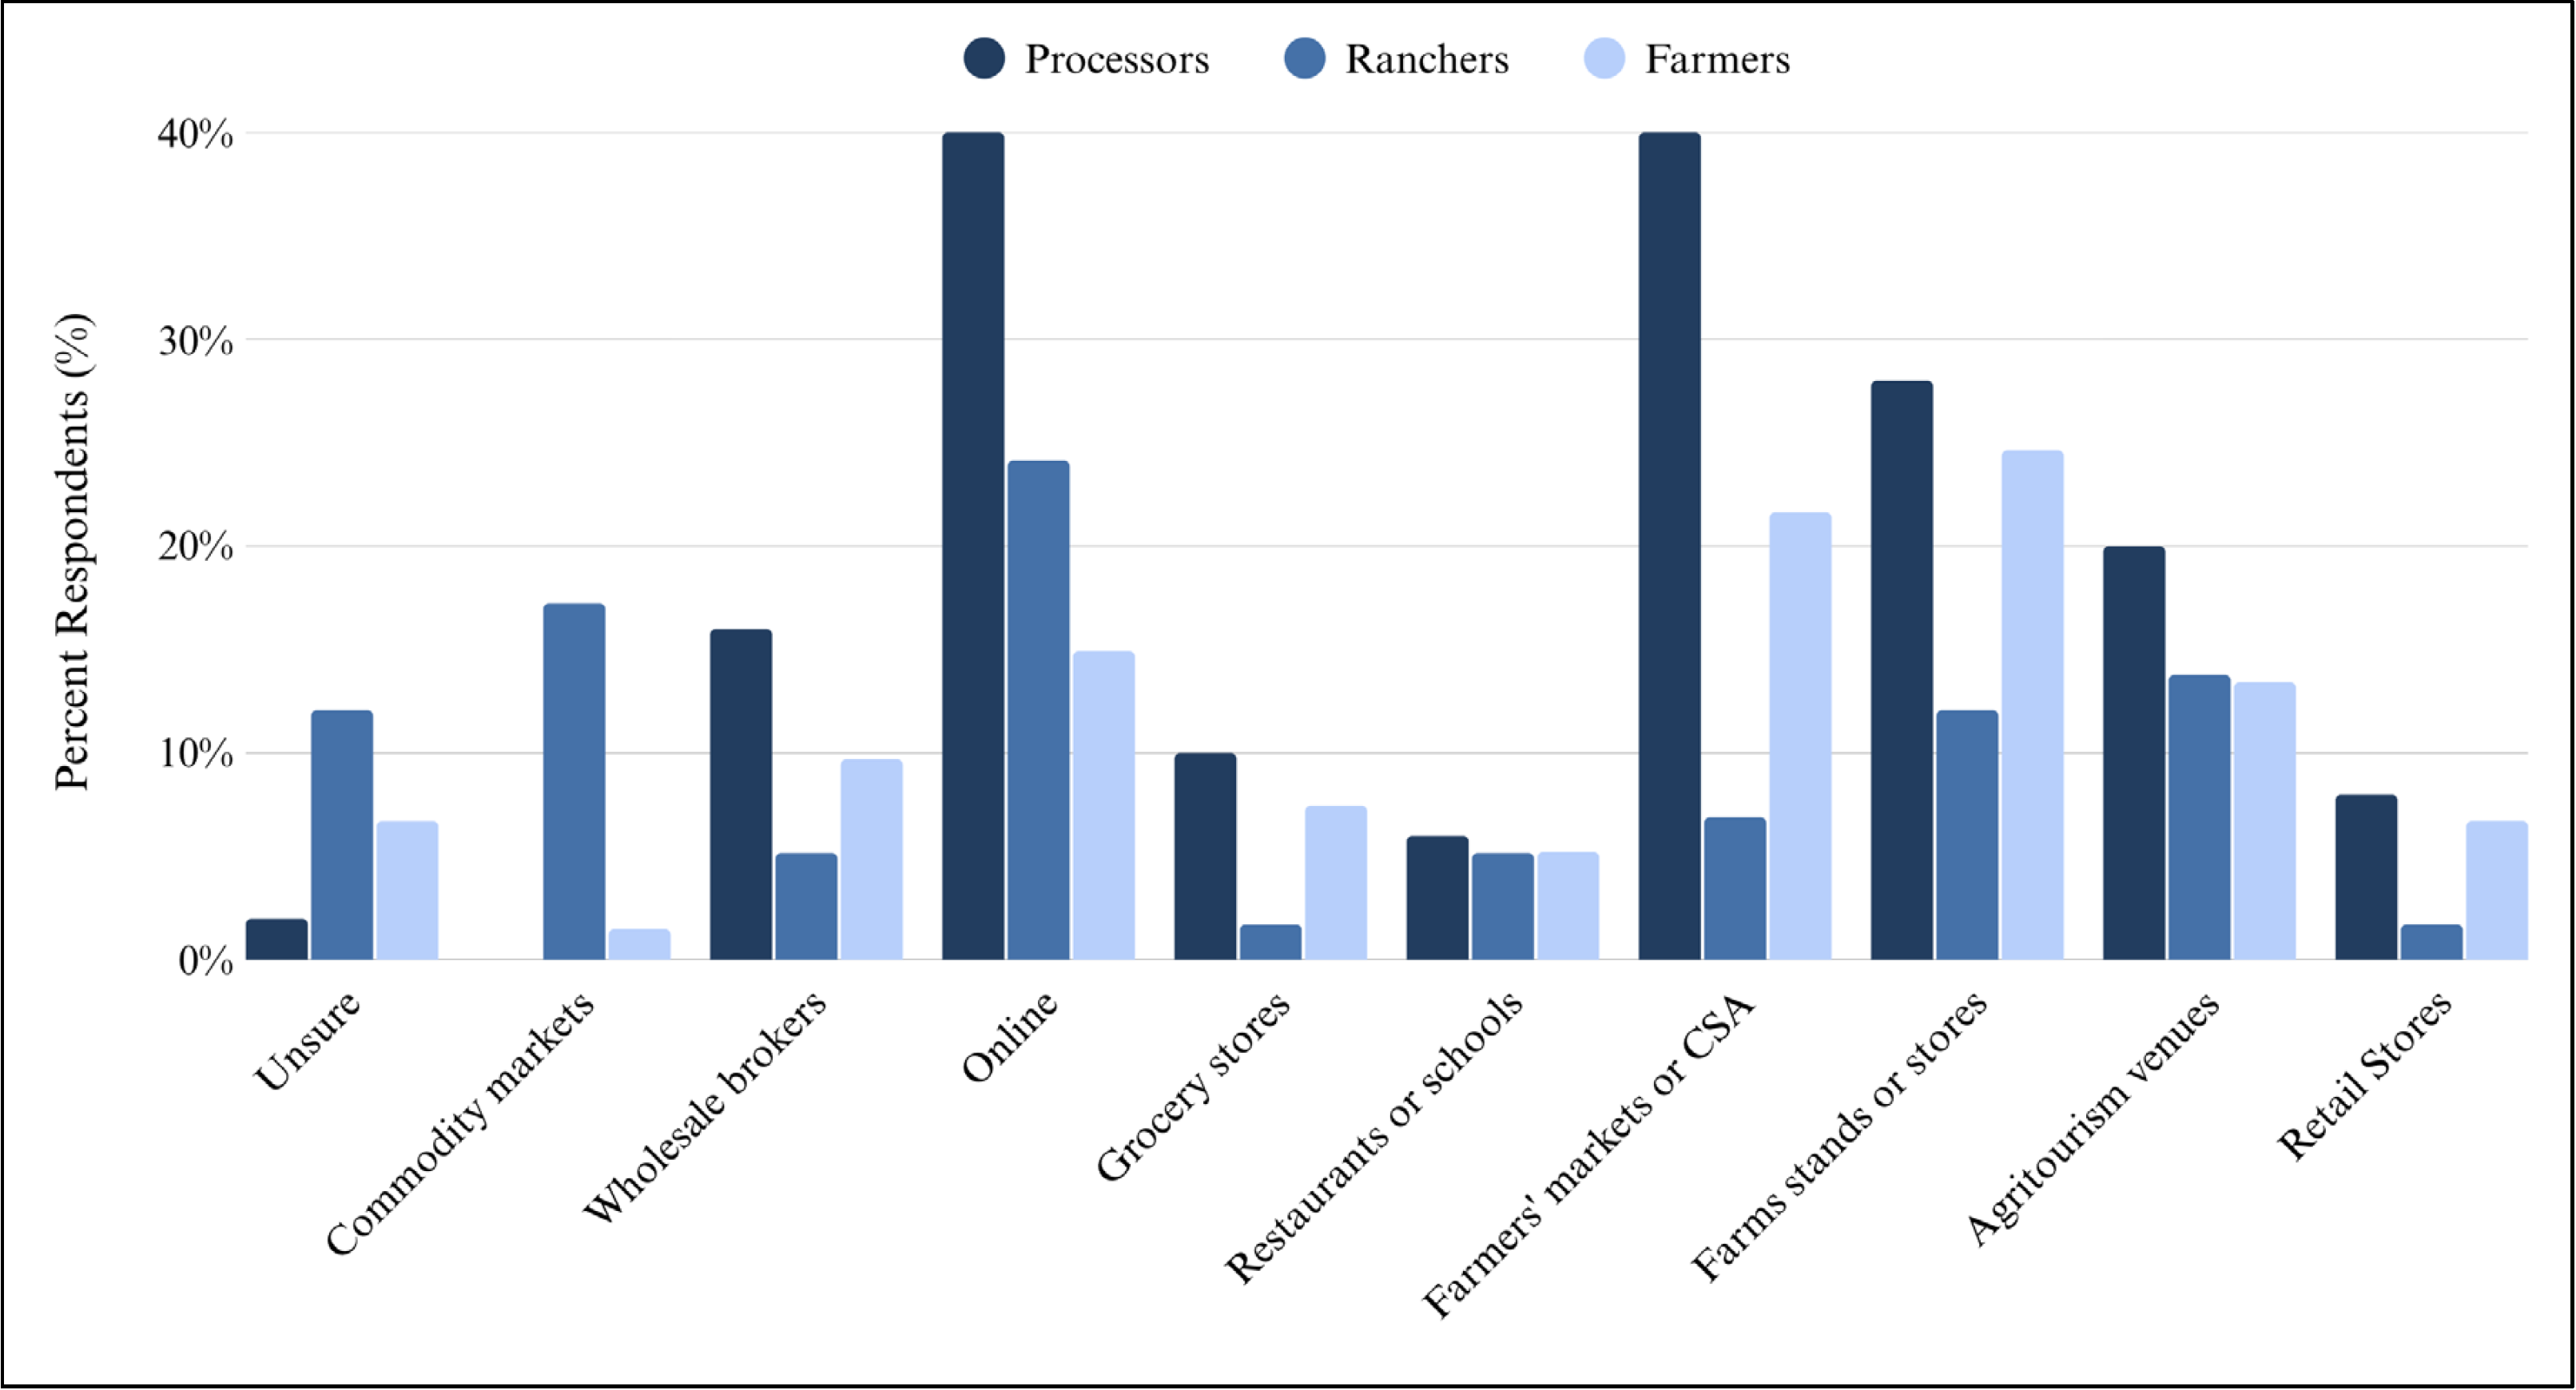
When queried about the current or planned markets for their processing operation, the two most common markets for food processors were online sales and farmers markets or consumer-supported agriculture (CSA) programs, followed by farm stands or stores (see Figure 2). Ranchers indicated they would likely market products online or through commodity markets. Finally, farmers favored farm stands and stores, as well as farmers markets, CSA programs, and online outlets.
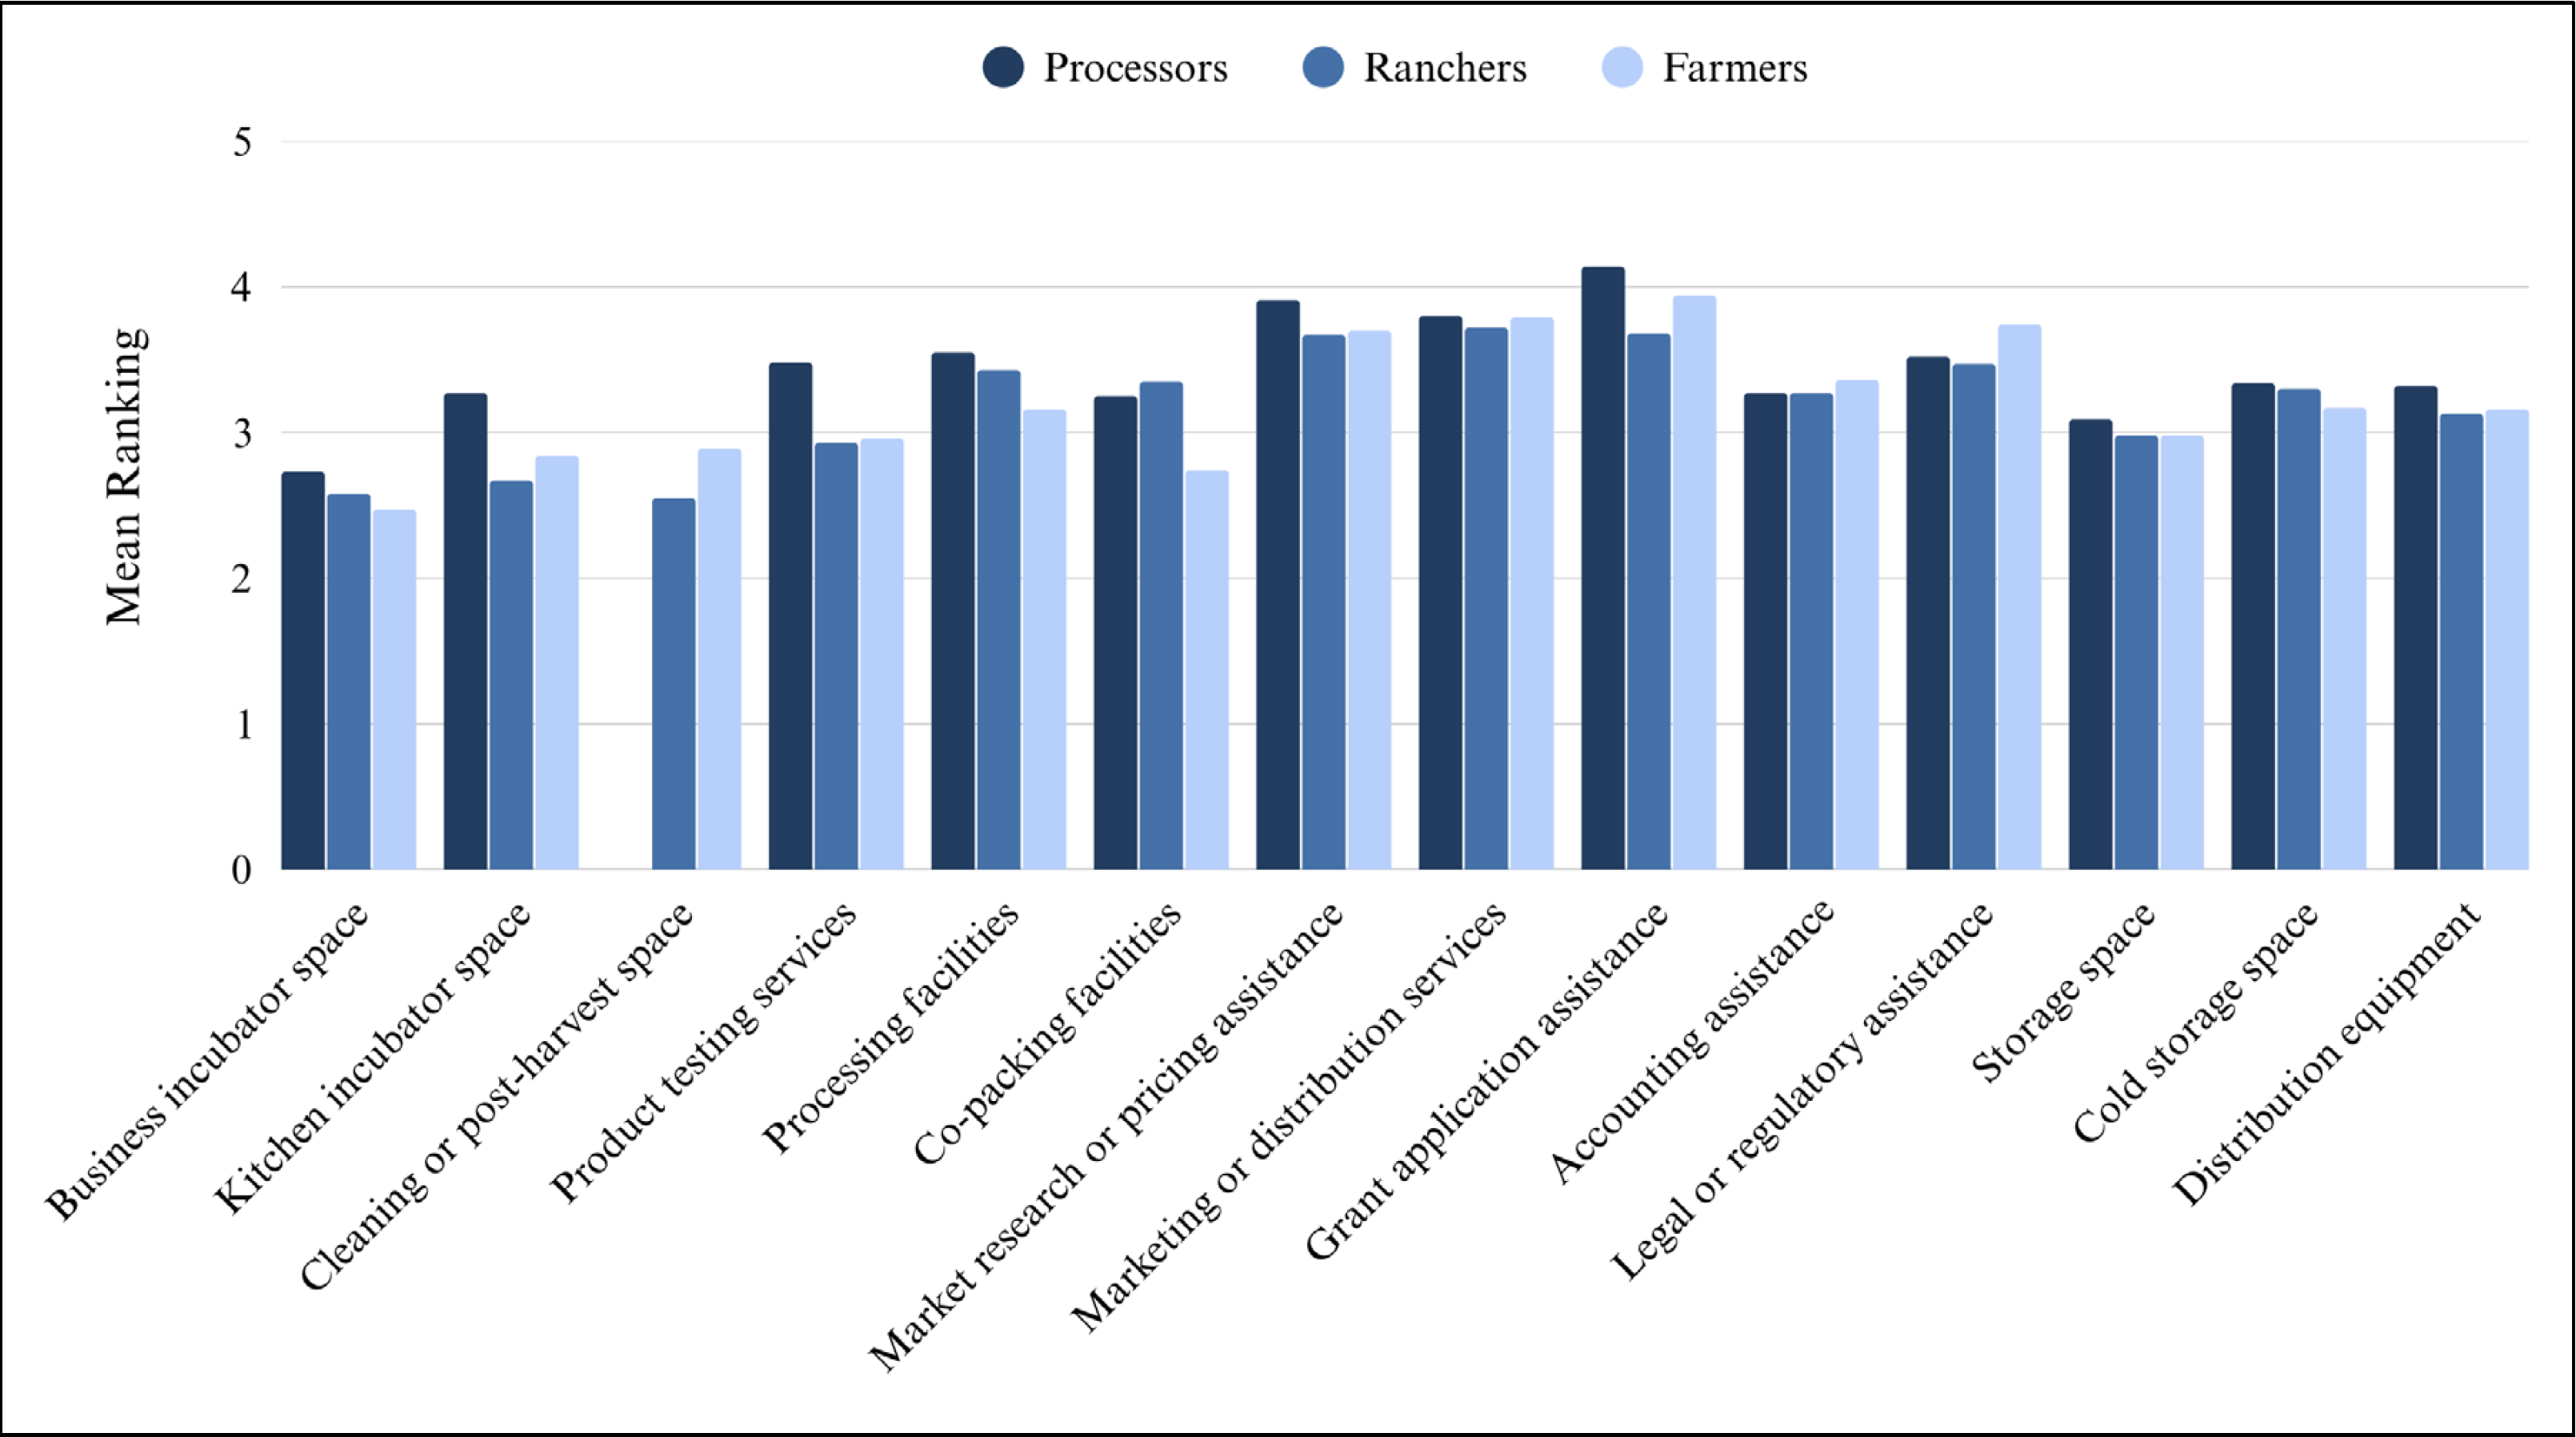
Notes. The mean ranking is on a scale of 1 to 5 (not at all useful to very useful). For example, a mean ranking of 4 for “accounting assistance” would indicate that, on average, respondents felt that accounting assistance would be relatively useful to their processing operation.
In terms of useful tools and resources (see Figure 4), financial and production assessment tools, as well as visits to other producer locations, ranked highly. Processors and farmers indicated that directories of local-sourcing grocery stores, restaurants, and farmers markets/CSA programs, as well as listings of processing and co-packing facilities would be very helpful to them. The ranchers felt that Good Agricultural Practices (GAP) training would be the least beneficial to their operation. Farmers and food processors indicated that a listing of meat processing facilities would be least useful, while ranchers felt the opposite.
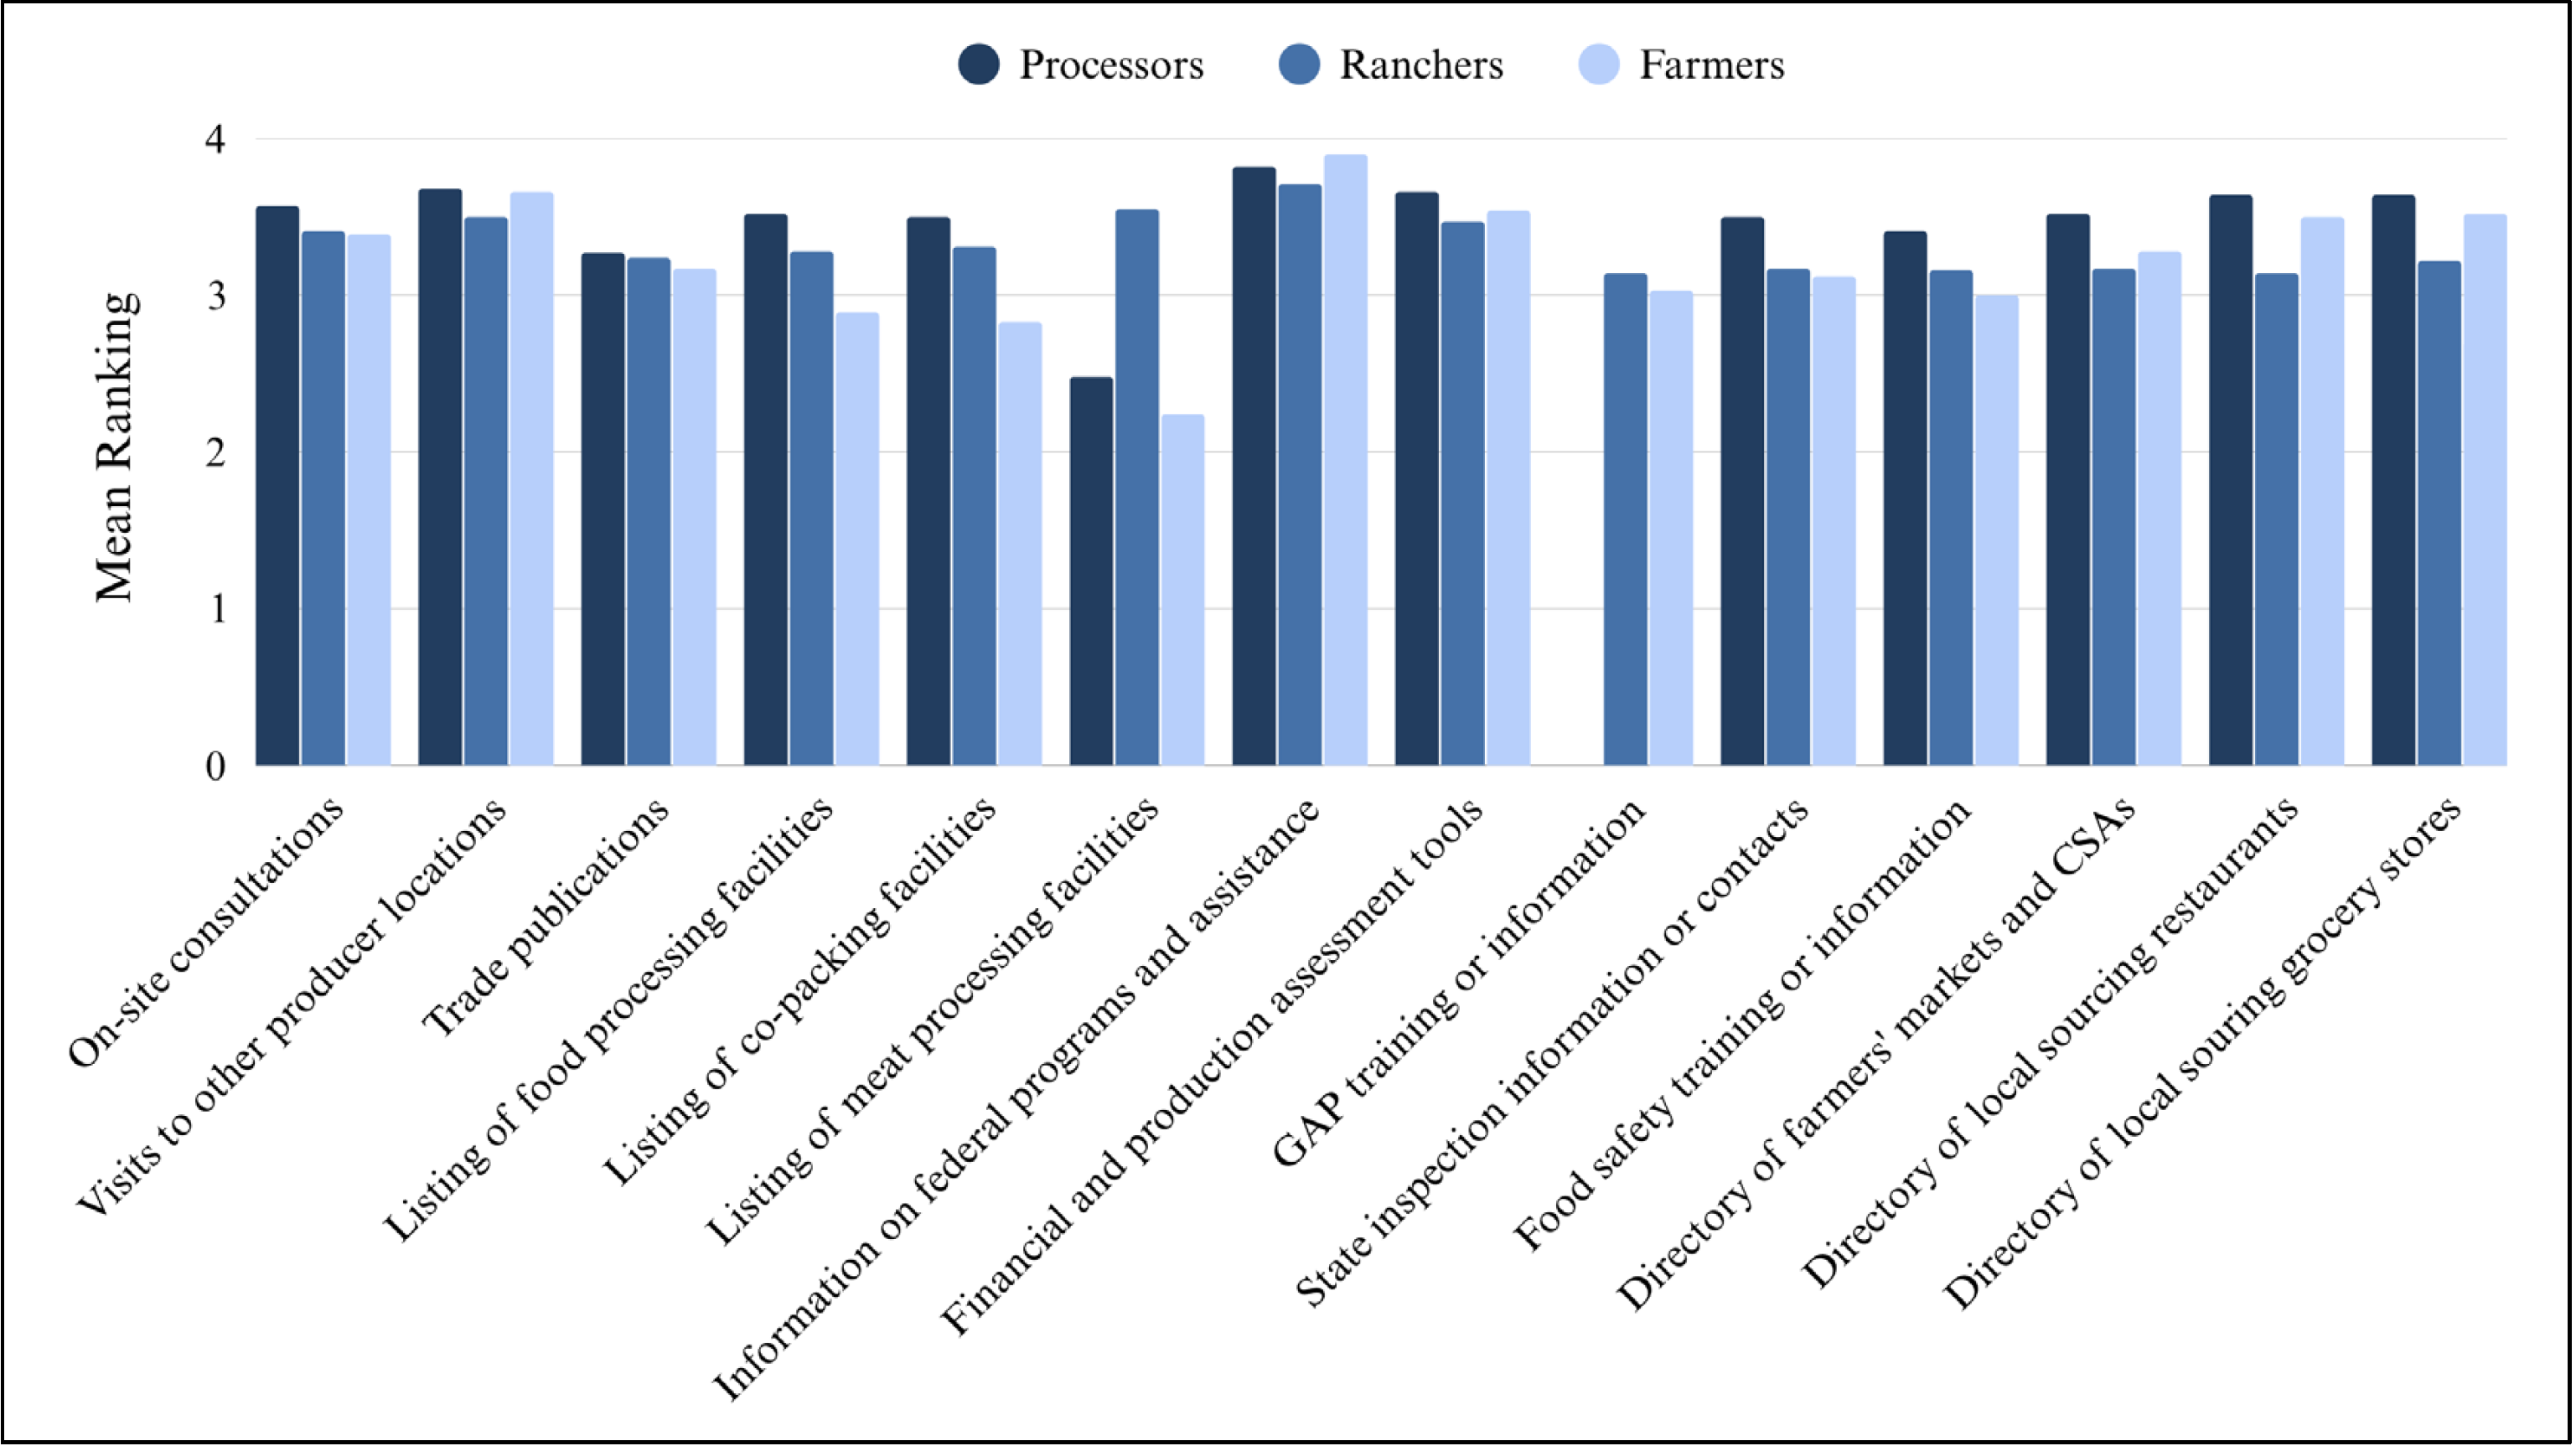
Notes. The mean ranking is on a scale of 1 to 5 (not at all useful to very useful). For example, a mean ranking of 3 for “GAP training” would indicate that, on average, respondents felt GAP training would be somewhat useful to their processing operation.
Conclusions
Based on study findings, Utah’s farmers, ranchers, and small food processors demonstrate strong and growing interest in value-added food production to enhance profitability and diversify their operations. While the types of products and processing approaches vary—ranging from agritourism and baked goods to meat/poultry products—most respondents intend to expand production within one year. However, many are uncertain about sales targets and lack access to key tools such as market planning resources, processing facilities, and business development support. These findings suggest that while enthusiasm for value-added enterprises is high, producers need additional guidance and infrastructure to fully realize these opportunities.
Overall, the study highlights significant potential for expanding Utah’s value-added agriculture sector through targeted support and coordinated resource development. The consistent demand for grant assistance, financial planning, and information on federal programs points to an opportunity for Extension, policymakers, and economic development agencies to strengthen producer capacity through accessible training, grant-writing support, and improved information sharing. By addressing these gaps and building stronger local networks and technical assistance programs, Utah can foster a more resilient and diversified agricultural economy that better supports producers and rural communities statewide.
Recommendations
- Expand funding support. Provide grant-writing workshops and simplified guides to help producers access federal and state funding programs.
- Increase processing access. Develop shared-use and mobile processing facilities and create a statewide directory of co-packers and processors.
- Enhance business and financial training. Offer tools and workshops on business planning, pricing, and financial management.
- Improve marketing assistance. Provide market research, branding, and labeling support to strengthen local and regional food sales.
- Simplify regulatory guidance. Create clear, accessible resources on licensing, labeling, and food safety compliance.
- Build peer learning networks. Facilitate mentorships, producer tours, and networking events to share best practices.
- Support agritourism and direct sales. Offer technical assistance for on-farm retail, agritourism activities, and online marketing.
- Promote awareness of federal programs. Coordinate outreach to connect producers with USDA and state-level assistance opportunities.
Acknowledgments
Funding for this publication was made possible by a grant/cooperative agreement from the U.S. Department of Agriculture (USDA) Agricultural Marketing Service. Its contents are solely the responsibility of the authors and do not necessarily represent the official views of the USDA.
The authors used ChatGPT to generate the “Recommendations” section from the fact sheet text, which the authors edited to ensure accuracy. Authors take full responsibility for the content.

December 2025
Utah State University Extension
Peer-reviewed fact sheet
Authors
Kynda Curtis, Professor and USU Extension Specialist, Department of Applied Economics; Makaylie Langford, Research Assistant, Department of Applied Economics; Karin Allen, Associate Professor and USU Extension Specialist, Department of Nutrition, Dietetics, and Food Sciences; Ruby Ward, Professor and USU Extension Specialist, Department of Applied Economics

Kynda Curtis
Food Systems Specialist
APEC Dept

Karin Allen
Food Quality & Entrepreneurship Specialist
NDFS Dept

Ruby Ward
Agricultural Entrepreneurship Specialist
APEC Dept
Related Research

Agricultural Producer and Food Maker Food Processing Operation Needs Assessment Overview
Utah State University’s 2024 needs assessment explores the educational, funding, and infrastructure needs of Utah farmers, ranchers, and food makers involved in value-added food production. Results highlight respondent demographics, products, markets, lab
Assessing Utah's Agricultural Producer and Small Processor Interest in Value-Added Food Production
This fact sheet presents findings from a study on value-added food production among Utah farmers, ranchers, and food processors. Highlighting operational characteristics, production timelines, markets, sales goals, and key resources needed to support loca

Target Consumers for Beef Jerky
This study identifies the target market for packaged beef jerky in the western U.S., highlighting consumer demographics, purchasing habits, and willingness to pay premiums for organic, grass-fed, and locally sourced products.
Target Consumers for Beef Jerky
This study identifies the target market for packaged beef jerky in the western U.S., highlighting consumer demographics, purchasing habits, and willingness to pay premiums for organic, grass-fed, and locally sourced products.

Target Consumers for Bottled Mild Salsa
This fact sheet summarizes USU research on western U.S. consumers who purchase mild salsa, highlighting their demographics, food habits, and preferences. Target consumers are middle-aged, highly educated, engaged in local food systems, and willing to pay

Target Consumers for Bottled Tart Cherry Juice
This fact sheet provides an overview of the study results conducted by Utah State University to determine western U.S. consumer preferences and willingness to pay for regionally sourced processed food products. This fact sheet addresses target consumers f
U.S. West Consumer Preferences for Specialty Labeled Processed Foods
Highlighting consumer preferences and willingness to pay for specialty-labeled processed foods, including organic, local, grass-fed, and non-GMO products. Survey results show strong consumer value for health, safety, freshness, and transparency, especiall

U.S. West Consumer Processed Food Preferences and Consumption Habits
This article summarizes a 2024 Utah State University study examining processed food preferences and purchasing behaviors among 1,282 consumers across the western United States. Findings highlight key values such as taste, price, product quality, and trust
Utah's Value-Added Food Processing Options
Explaining what value-added foods are and how producers can increase profit through processing, direct marketing, and vertical integration. Also outlining Utah’s regulatory options and programs to help small food businesses choose the right path for produ