What Determines Produce Pricing in Utah?
Introduction
Farmers’ markets have grown in popularity over the past two decades. In 1994 there were 1,755 farmers’ markets across the U.S., but by 2004 farmers’ markets had more than doubled to 3,706. By 2012, the number of farmers’ markets increased 112% to 7,864 across the U.S. (USDA AMS, 2018). This spike in the growth rate is attributed to increasing consumer demand for products with perceived freshness, low environmental impact, greater bio-diversity, as well as general support for local farmers (Hardesty, 2008; Martinez et al., 2010). However, it now seems that a saturation point has been reached. Although the number of farmers’ markets is still increasing, it’s doing so at a decreasing rate. From 2012 to 2017 the number of farmers’ markets increased by 11%, with only 51 new farmers’ markets added between 2017 and 2018.
The number of farmers that participate in direct-to-consumer (DTC) sales, as well as the value of sales generated through DTC sales follows a similar trend. Between 2002 and 2007 the number of farmers participating in DTC sales increased by 17%, and the sales generated increased by 32%. Between 2007 and 2012 the number of farmers participating in DTC sales increased by only 5.5%, and the value of sales declined by 1% when adjusted for inflation (Low et al., 2015). This means that farmers’ markets are competing not only for customers but also for fresh produce vendors. Hence, growers have to decide at which farmers’ market they can most effectively sell their produce.
Since pricing information is valuable for produce growers when estimating the potential profitability of various produce items, as well as market types and locations (Low et al., 2015), this article provides a comparison of fresh produce prices at farmers’ markets and grocery stores in Utah. It also discusses the price impacts for various item characteristics, including variety, market location, seasonality, and production methods (Salisbury, 2018).
Produce Price Collection
Fresh produce prices were collected across a 2-year growing period, June to October 2016 and June to September 2017. Produce prices were collected at eight farmers’ markets and 14 local and national-chain grocery stores in Utah. Vendors at the farmers’ markets were randomly selected and only items that were comparable to those available in grocery stores were used. Each pricing observation included the produce item, market type, location, growing practice, and normalized price in dollars per pound.
Fresh Produce Price Summary
The initial analysis of fresh produce prices included a comparison of a basket of produce between farmers’ markets and grocery stores across four locations. The large market basket (18 items) was determined by the most commonly consumed produce items for a four-person household for a month. The large basket was then broken down into smaller medium and small baskets (5 items), where the small basket contains items most common at farmers’ markets. Table 1 provides a summary of the price differences for conventionally grown produce items only. The four farmers’ markets in Northern Utah shown are the Cache Valley Gardner’s Market in Logan, the Ogden Farmers’ Market, the USU Botanical Center Farmers’ Market in Kaysville, and the Salt Lake City Downtown Farmers’ Market.
The prices of the market baskets vary greatly between locations. The large and the medium market baskets are usually more expensive at the farmers’ market than at neighboring grocery stores. However, the price differences for the small market baskets are small. In fact, the small market basket tends to be priced lower at the farmers’ market than surrounding grocery stores, with the exception of Rancho Market in Ogden. This shows that those buying common farmers’ market items will find farmers’ markets competitively priced. Growers might wish to highlight the low-cost items like vine tomatoes, green bell peppers, and zucchini from the small market basket to draw in customers and then display the higher priced items that may be novel or impulse buys like strawberries, spinach or romaine to improve profit margins.
Table 1. Total Cost of a Large, Medium, and Small Market Produce Basket ($)
| Details | Total Price | |||
|---|---|---|---|---|
| Market Name | N | Large Market Basket | Medium Market Basket | Small Market Basket |
| Logan Area | ||||
| Logan Farmers' Market | 6 | $89.00 | $41.50 | $14.37 |
| Lee's+ | 6 | $61.03** | $36.57 | $17.25 |
| Smith's | 6 | $61.19** | $36.93 | $16.99 |
| Walmart | 6 | $66.63** | $39.86 | $21.65** |
| Ogden Area | ||||
| Ogden Farmers' Market | 5 | $92.50 | $48.54 | $17.93 |
| Smith's | 6 | $64.09*** | $39.42** | $18.25 |
| Macey's+ | 6 | $65.34*** | $40.52** | $18.90 |
| Rancho Market+ | 6 | $50.9*** | $33.36*** | $13.53* |
| Kaysville Layton Area | ||||
| USU Farmers' Market | 4 | $86.35 | $39.97 | $15.03 |
| Bowman's+ | 6 | $60.76** | $34.42 | $16.80 |
| Target | 6 | $73.17 | $41.68 | $21.97** |
| Salt Lake City Area | ||||
| Downtown Farmers' Market | 6 | $97.44 | $52.02 | $17.73 |
| Smith's | 6 | $60.59*** | $36.62** | $17.36 |
| Walmart | 6 | $59.95*** | $32.98** | $15.75 |
| Harmon's+ | 6 | $67.22*** | $39.52** | $18.06 |
Price Analysis of Fresh Produce
Pricing analysis was completed on individual produce items to determine which items demand a higher premium and why the premiums exist. Although the prices shown do not reflect the actual amount a grower would receive by selling to a grocery store, the results are beneficial to growers when developing their market strategy. Price analysis is used to find the marginal value of one of the many characteristics present in an individual produce item such as variety, growing season, location, market type, and production method.
Tomato Varieties
Growers may use these results to look at the price differences between grocery stores and farmers’ markets, as well as the price differences across varieties, or if the organic price premium is large enough to cover the organic certification costs for example. Location/area differences were examined to determine if a producer could expect higher or lower price premiums in a specific area/location. Further examined are the monthly price difference between farmers’ markets and grocery stores as it may be beneficial for producers to target certain produce items, in specific market areas, at certain times of the year. Figures 1 and 2 show the marginal price premiums or discounts for Cherry and Roma tomatoes. First, we set a baseline (constant) for the comparison, in this case, Vine tomatoes sold in Salt Lake City in July. The prices shown are the premium or discount from the baseline price.
Figure 1. Tomato Variety Price Comparisons at Farmers' Markets ($/lb)
| Farmers' Market Price Variations | |
|---|---|
| Baseline Vine Tomato Price | $2.40 |
| Cherry Tomatoes | $4.62 |
| Roma Tomatoes | $2.31 |
| Organic | $3.40 |
| Ogden | $2.04 |
| Kaysville/Layton | $1.84 |
| Moab | $1.44 |
| Roosevelt | $2.84 |
| Vernal | $1.12 |
| September | $1.63 |
| October | $1.34 |
Figure 2. Tomato Variety Price Comparisons at Grocery Stores ($/lb)
| Grocery Store Price Variations | |
|---|---|
| Baseline Vine Tomato Price | $1.82 |
| Cherry Tomatoes | $4.76 |
| Roma Tomatoes | $1.20 |
| Organic | $2.22 |
| Ogden | $1.72 |
| Kaysville/Layton | $1.90 |
| Moab | $2.09 |
| Roosevelt | $1.03 |
| Vernal | $.90 |
| September | $1.88 |
| October | $2.06 |
The price per pound for vine ripened tomatoes sold in SLC in July at the farmers’ market and at the grocery stores is $2.40/lb. and $1.82/lb. respectively. Cherry tomatoes offer higher premiums at both farmers’ markets and grocery stores; however, the premium at the grocery store is slightly higher at $2.94/lb. The price discount for Roma tomatoes is only significant at the grocery store at $0.60/lb., whereas the farmers’ market discount is $0.00/lb. We can explain this qualitatively since farmers’ market vendors tend to combine tomatoes together and price as either dollar per pound or as a unit amount per dollar, without distinguishing between Roma or vine ripened tomatoes. The organic certification is significant at both farmers’ markets and grocery stores, but the price premium is more than double at the farmers’ market at $1.00/lb. The grocery store organic price premium is significant, but the premium is only $0.40/lb. more. Meaning the organic payoff is better at the farmers’ market.
When comparing location differences, Roosevelt and Vernal show significant price differences at the grocery stores. Farmers’ market price discounts occur in the Kaysville/Layton and Ogden areas. Moab also has a significant price discount for conventionally produced items, perhaps because most of the produce sold in that area is organic. The Logan area did not show any significant price premiums or discounts for either type of market.
Grocery stores show an increasing monthly price trend with a significant price premium of $0.24/lb. in October relative to July. Early season tomato varieties were not available at the farmers’ markets in June. With the baseline set to July, there is an increasing price discount throughout the summer with significant price discounts in September at $0.77/lb. and October at $1.06/lb.
Seasonal Considerations
The seasonal effects at farmers’ markets and grocery stores for each produce item in the medium market basket were examined. Figure 3 shows the results of the seasonality comparisons. Of the ten produce items in the medium market basket, four items have significant price discounts at the farmers’ market and significant price premiums at the grocery store as the growing season progresses (late summer or early fall). Generally, grocery stores do not have the seasonality effects that farmers’ markets do; there is also less variability in pricing overall. Also, the availability of produce items is more consistent at the grocery store than the farmers’ market.
Figure 3. Produce Variety Monthly Price Variations ($/lb)
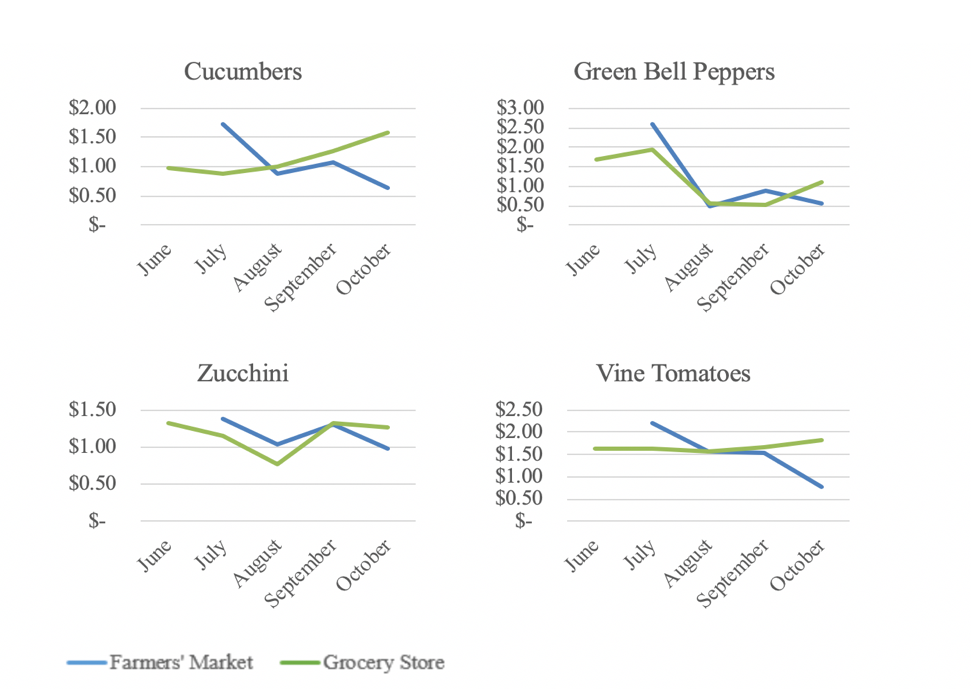
Consistently, the highest price premium at the farmers’ markets are in July, with the exception of cantaloupe, which has a higher price premium in August. Also, all of the produce items, with the exception of garlic, are significantly less expensive at the farmers’ markets in October. Additionally, there is a significant price discount trend at the farmers’ market for sweet corn, cucumbers, and vine tomatoes as the growing season progresses. Whereas at the grocery stores there is a significant upward price trend for cucumbers, zucchini, and vine tomatoes. Hence, early season produce consistently brings a higher price premium at the farmers’ market. When produce becomes more abundant prices decrease later in the summer.
Conclusions
This article provides a comparison of fresh produce prices at farmers’ markets and grocery stores in Utah. It also discusses the price impacts for various item characteristics, including variety, market location, seasonality, and production methods (Salisbury, 2018). Overall, produce pricing is dependent on product characteristics, such production type (organic vs. conventionally grown), market type (farmers’ market vs. grocery store), location, and seasonality. Generally, for consumers purchasing large market baskets, the farmers’ market basket price is higher than the local grocery store. But, for common items (sweet corn, vine tomatoes, bell peppers, etc.), the farmers’ market price is the same or even cheaper than the grocery store. For growers, having competitively priced common items at the farmers’ market will be effective at bringing customers in. Then offering other “in season” higher priced items, such as Cherry tomatoes, may be effective at increasing sales. Organic versions also bring higher pricing at farmers’ markets. Seasonality is a key contributor to produce pricing. For farmers’ markets early season produce sells at a higher price, for grocery stores the late season brings higher pricing. Those growers using early season growing methods, such as hoop houses, will be able to take advantage of early season price premiums. Growers may also find that selling larger quantities to grocery stores for late season sales may be more profitable than farmers’ markets.
References
- Hardesty, S. 2008. “The Growing Role of Local Food Markets.” Online at: http://about.jstor.org/terms.
- Low, S., et al. 2015. “Trends in U . S . Local and Regional Food Systems Report to Congress.” USDA Economic Research Report (068): 92. Online at: https:// www.ers.usda.gov/webdocs/publications/42805/51173_ap068.pdf?v=42083.
- Martinez, S., et al. 2010. “Local Food Systems Concepts, Impacts, and Issues.” Online at: https://www.ers.usda.gov/webdocs/publications/46393/7054_err97_1_.pdf?v=42265.
- Salisbury, K. 2018. “Examining Market Channels for Local Produce: Consumer Affordability and Producer Profitability.” Online at: https://digitalcommons.usu.edu/etd.
- U.S. Department of Agriculture, Agricultural Marketing Service (USDA-AMS). 2018. “Local Food Directories: National Farmers Market Directory.” Online at: https://www.ams.usda.gov/local-food-directories/farmersmarkets.
This material is based upon work supported by USDA/NIFA under Award Number 2015-49200-24225.
Authors
Kynda R. Curtis, Professor & Extension Specialist, Department of Applied Economics; Karli Salisbury, Graduate Research Assistant, Department of Applied Economics; Veronica Pozo, Assistant Professor, Department of Applied Economics; Ruby Ward, Professor & Extension Specialist, Department of Applied Economics; Carrie Durward, Associate Professor & Extension Specialist, Department of Nutrition, Dietetics, & Food Science


Related Nutrition Articles

Does Healthy Eating Cost More?
Decisions regarding food choices are based on a variety of factors including cost, taste, convenience, and availability. Many people feel that nutritious foods cost more than foods high in calories and low in important nutrients. In an effort to save mone

Food Security – What It Is and Why It Matters
This website provides comprehensive information on food security, including its definition, pillars, health consequences, resources available, and ways to support food security efforts. It offers a detailed list of federal programs, food banks, and other

Food Waste Part 6: Introduction to Increasing Cooking Skills and Preserving Foods
Learn the basic skills for preserving and cooking foods so that you can save time, money, and decrease the amount of food wasted in your home.
Food Waste Part 7: “Wait! Don’t throw that away!” Composting and Creative Recipes
Learn to reduce food waste through composting and creative recipes.

Food Waste Prevention Part 1: Introduction
No one likes wasting food, but in the United States each person wastes on average about a pound of food every day. Thirty million acres of cropland is used to produce this wasted food every year. To learn more about options to reduce food waste and resour

Food Waste Prevention Part 2: Meal Planning
Prevent food waste through meal planning and shopping habits.

Food Waste Prevention Part 4: Using Leftovers
Don’t waste food or money: learn to safely use leftovers to make delicious meals.

Food Waste Prevention Part 5: Food Labels and Food Safety
Stop wasting food and money: learn what the dates on your food mean and safe food storage.

Increasing Access to Acceptable and Affordable Gluten-Free Baked Goods
Transitioning to a gluten-free (GF) diet can be difficult due to limited reliable recipes to produce baked goods at home and poor quality of commercially available baked goods. This study tested basic recipes capable of creating acceptable GF baked produc

Reducing Food Waste at Home
Food loss in the U.S. occurs throughout the supply chain, with the largest portion happening at the consumer stage, leading to significant waste of resources like money, water, and calories that could feed millions. Practical solutions include meal planni
Targeting Farmers’ Markets in Utah: Understanding Fresh Produce Pricing
This article focuses primarily on farmers’ market price comparisons to assist fresh produce growers in determining which produce varieties have the highest premiums, the range of prices they can expect, and any considerations for production method, season
What Determines Produce Pricing in Utah?
A comparison of fresh produce prices at farmers markets and grocery stores in Utah.