Who Are Organic Wheat Consumers?
Introduction
Consumer demand for organic foods has skyrocketed over the past two decades. From 1997-2017, sales of organic foods increased from $3.4 billion to $45.2 billion (Organic Trade Association, 2018). In the organic wheat market supplies haven’t kept up with demand. In 2016, organic wheat acreage represented just 1% of the total U.S. wheat acreage and 6.7% of total U.S. organic crop acreage (USDA-NASS, 2017). Yet bread and grains accounted for 9% of overall organic food consumed (USDA-ERS, 2017).
For wheat producers and millers considering entering the organic wheat market, it’s important to understand who the consumers of organic wheat products are in terms of demographics, attitudes, and lifestyles, what product elements are important to them, and why they are interested in organic products. This fact sheet provides an overview of the socio-demographics, attitudes, and preferences of organic wheat consumers in the Western U.S. It discusses information on what food attributes these consumers value most along with their lifestyle and shopping habits.
Data Overview
The data for this fact sheet comes from a survey conducted with 1,009 consumers in the U.S. West in the summer of 2017. The survey asked questions about consumer shopping and consumption habits, preferences related to bread products and banked goods, reasons for purchasing/not purchasing organic breads, general attitudes towards organic foods, knowledge of organic production systems, as well as lifestyle and socio-demographic questions. The survey respondents were divided into three groups based on their likelihood or frequency of purchasing organic wheat products, groups include “very likely,” “likely” and “unlikely.” The organic bread consumers in the sample (both very likely (307) and likely (267)) were then compared with the unlikely (435) organic bread consumers.
Socio-Demographics
According to the results for organic bread products, see Table 1, younger respondents (45 years and younger), are more likely to be organic bread consumers than not. Very likely organic consumers are also more likely to have children living with them, live in California, have an annual household income above $60,000, at least a four-year college degree, and be fully employed. Likely organic bread consumers also have a higher annual income, hold a college degree or better, but are less likely to have children in the household or be employed full or part-time than the regular organic break consumers. Female gender, household size, marital status, and ethnicity were relatively consistent among all three groups.
Table 1: Sample Socio-Demographics by Group (%)
| Organic Bread | |||
|---|---|---|---|
| Characteristic | Very likely | Likely | Unlikely |
| Female | 0.515 | 0.532 | 0.508 |
| Married | 0.518 | 0.521 | 0.478 |
| Income above $60k | 0.466 | 0.431 | 0.306 |
| 4-year college or higher | 0.476 | 0.472 | 0.297 |
| Employed | 0.733 | 0.487 | 0.487 |
| California resident | 0.564 | 0.472 | 0.490 |
| Age below 45 years | 0.658 | 0.311 | 0.434 |
| Children 0-17 years | 0.821 | 0.442 | 0.559 |
| Household size | 2.889 | 2.423 | 2.740 |
| Ethnicity (=1 if white) | 0.661 | 0.798 | 0.720 |
| N | 307 | 267 | 435 |
 Lifestyles
Survey respondents were asked to rate their agreement with several lifestyle questions on a scale of 1-5, where 5 represents strongly agree. Overall, very likely organic bread consumers have a healthy lifestyle as they agreed significantly more with the lifestyle statements for 11 of 16 of the statements (See Table 2). Regular consumers tend to eat fresh produce daily, avoid eating processed foods and foods with additives, and are physically active. They are more concerned about the safety and origin of their food compared to the other groups who are less likely to consume organic wheat products. Respondents in the very likely group also buy products with low environmental impact, recycle, support local farmers, and follow a vegetarian or vegan diet. Occasional organic bread consumers also avoid processed foods and additives, and purchase foods with low environmental impact. The unlikely group has fewer vegetarians, and they eat more processed food and food with additives.
Table 2: Sample Lifestyles by Group (Scale of 1-5)
| Organic Bread | |||
|---|---|---|---|
| Statement | Very likely | Likely | Unlikely |
| I control my salt & sugar | 3.85 | 3.84 | 3.59 |
| I control my fat consumption | 3.78 | 3.61 | 3.34 |
| I follow a vegetarian or vegan diet | 2.32 | 1.63 | 1.48 |
| I eat fresh produce daily | 4.02 | 3.72 | 3.52 |
| I eat grains daily | 3.71 | 3.83 | 3.69 |
| I avoid eating processed foods | 3.48 | 3.16 | 2.62 |
| I avoid eating food products with additives | 3.66 | 3.22 | 2.65 |
| I am concerned with my health | 4.10 | 4.01 | 3.88 |
| I am concerned about food safety | 4.18 | 3.82 | 3.66 |
| I am concerned about food origin | 3.81 | 3.51 | 3.27 |
| I eat out infrequently | 3.25 | 3.15 | 3.10 |
| Physical activity or exercise is important | 3.96 | 3.64 | 3.43 |
| I buy products with low environmental impact. | 3.48 | 3.04 | 2.82 |
| Recycling is a priority | 4.07 | 3.93 | 3.70 |
| Supporting local farmers is important | 4.07 | 3.76 | 3.68 |
| Agricultural open space is important | 3.88 | 3.71 | 3.51 |
| N | 307 | 267 | 435 |
Shopping and Consumer Behavior
As shown in Table 3, consumers of organic breads are more likely to purchase at specialty stores, bulk stores, and local bakeries compared to non-consumers. The results show that very likely consumers are more likely to review nutritional facts, ingredients, allergy warnings, and labels on the front of the package more frequently than non-consumers. Unlikely organic consumers shop often at grocery stores and multi-purpose stores and are very interested in package size. Front labels and allergy warnings are less important to this group. Also, consumers with food limitations such a gluten-intolerance and other food allergies are more likely to consume organic breads than those who don’t have these restrictions.
Table 3. Sample Shopping Habits by Group (%)
| Organic Bread | |||
|---|---|---|---|
| Habit | Very likely | Likely | Unlikely |
| Store type | |||
| Grocery Store | 0.71 | 0.72 | 0.76 |
| Multipurpose store | 0.49 | 0.35 | 0.49 |
| Specialty store | 0.38 | 0.23 | 0.11 |
| Bulk store | 0.30 | 0.17 | 0.15 |
| Local bakery | 0.23 | 0.09 | 0.11 |
| Discount store | 0.11 | 0.10 | 0.12 |
| Reviewed information+ | |||
| Nutrition facts panel | 69.1 | 62.1 | 50.0 |
| Ingredient list | 67.9 | 61.2 | 47.9 |
| Serving size | 55.1 | 48.6 | 45.5 |
| Package size | 58.3 | 56.8 | 60.5 |
| Allergy warnings | 47.2 | 25.0 | 25.4 |
| Front labels | 70.5 | 56.4 | 39.8 |
Consumer Preferences
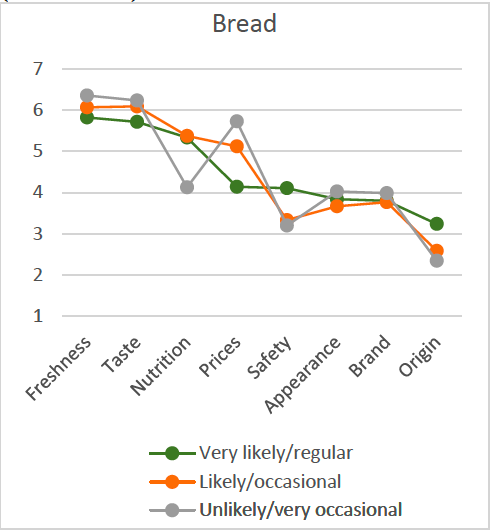
(Scale of 1-7)
On average, the survey respondents who are very likely to purchase organic breads, stated that freshness is the most important characteristic when choosing which breads to buy (See Figure 1). Taste and nutrition were other characteristics that they prioritized, as well as safety. They rated price and taste lower than the other two groups. Furthermore, when asked what their reasons were for purchasing organic breads, respondents answered that organic products were healthier, organics don’t contain harmful substances, and organic bread tastes better.
Next, respondents were asked to rank the importance of having a certified organic option for different wheat product categories, where 9 = “most important” and 1 = “least important.” The results in Table 4 reveal that the importance of having a certified organic option for different products is fairly similar across all groups, with only a few differences. The very likely group preferred the organic certified pasta, and specialty and white bread options. The likely group preferred organic certified crackers and bagels more than the very likely group. Strangely the unlikely group’s ratings were very similar to the other two groups.
Table 4: Importance of Certified Organic Option (Scale of 1-9)
| Organic Bread | |||
|---|---|---|---|
| Organic Product | Very likely | Likely | Unlikely |
| Specialty bread | 6.87 | 7.03 | 6.18 |
| White bread | 6.85 | 6.95 | 6.60 |
| Pasta | 5.35 | 5.35 | 5.41 |
| Bagels | 4.83 | 4.94 | 4.82 |
| Cookies | 4.77 | 4.13 | 4.53 |
| Crackers | 4.50 | 4.90 | 4.54 |
| Pastries | 4.29 | 4.13 | 4.52 |
| Breadsticks | 3.95 | 3.76 | 4.15 |
| Pies | 3.60 | 3.83 | 4.25 |
Conclusions
This fact sheet discussed results of a consumer survey of 1,009 U.S. residents in the West. The respondents of the survey were categorized into three groups, “very likely,” “likely,” and “unlikely” consumers of organic wheat products. Results show that consumers who are very likely to purchase organic foods lead a very active and healthy lifestyle, are environmentally minded, support local farmers, and are concerned about food safety. In terms of food characteristics, very likely consumers care about freshness as well as taste and nutrition, but are less concerned with price. They tend to purchase organic breads because they consider them to be healthier, don’t contain harmful substances, and feel that organic foods taste better. These results show the areas that marketers should focus on to increase organic bread sales, especially to the likely group who have somewhat different preferences than the very likely group.
References
- Organic Trade Association OTA. 2017. Robust Organic Sector Stays on Upward Climb, Posts New Records in U.S. Sales. Online at: https://www.ota.com/news/press-releases/19681
- U.S. Department of Agriculture, National Agricultural Statistics Service (USDA-NASS). 2017. Certified Organic Survey 2016 Summary. Washington DC, September. Online at: https://www.nass.usda.gov/Publications/Todays_Reports/reports/census17.pdf
- U.S. Department of Agriculture, Economic Research Service (USDA-ERS). 2017. Organic Market Overview. Washington, DC. Online at: https://www.ers.usda.gov/topics/natural-resources-environment/organic-agriculture/organic-market-overview/
Date Published: December 2018
Authors
Kynda R. Curtis, Professor and Extension Specialist, Department of Applied Economics; Tatiana Drugova, Graduate Research Assistant, Department of Applied Economics; Haylea Thomason, Small Farm Extension Marketing Intern, Department of Applied Economics

Kynda Curtis
Food Systems Specialist
APEC Dept
Related Research
Who Are Organic Wheat Consumers?
This fact sheet provides an overview of the socio-demographics, attitudes, and preferences of organic wheat consumers in the Western U.S. It discusses information on what food attributes these consumers value most along with their lifestyle and shopping h
Adopting Organic Wheat: Grower Motivations and Concerns
This fact sheet provides an overview of the study results by discussing grower motivations for adopting organic methods, as well as grower concerns regarding organic production.
Consumer Taste Beliefs Impact Organic Specialty Baked Good Pricing
In this fact sheet, we discuss how consumer taste beliefs related to organic specialty baked goods differ from their taste beliefs for conventional specialty baked goods, and whether this difference affects the amount consumers are willing to pay for orga
Which Factors Influence Consumer Organic Specialty Bakery Product Taste Ratings?
In this fact sheet, we compare consumer taste ratings for organic and conventional specialty bakery products and analyze what factors explain the differences.
Characteristics of Organic Wheat Growers
This fact sheet provides an overview of the study results and compares and contrasts these results with the results of other studies. It also provides suggestions for outreach to current and potential organic wheat growers.
Do Consumers Who Prefer Gluten-Free Also Prefer Organic?
In this fact sheet, we examine how consumers, who choose to avoid wheat/gluten bakery products for a variety of reasons, respond to organic wheat products relative to those who do not limit their wheat/gluten consumption, and whether organic wheat product

Labeling and Product Characteristic Preferences of Organic Food Buyers
This Extension fact sheet discusses the results of an online survey conducted in 2017 across 16 western states via Qualtrics. Just over one thousand residents responded to the survey.
Does Consumer Knowledge of Organic Production Standards Influence Demand for Organic and Non-GMO Labeled Foods?
This fact sheet summarizes a study conducted on consumer willingness to pay (WTP) for organic and non-GMO labels alone and in combination for bread and cookies, and how consumer knowledge that organic is non-GMO and overall organic knowledge of organic st
Who Values Organic Specialty Bakery Products?
In this fact sheet, we examine differences in sociodemographics and lifestyle choices between those who view organic as important when purchasing specialty bakery products and those who don’t, with the aim to identify a target market of consumers who pref
Bakery Organic Wheat Flour Quality and Quantity Requirements
This fact sheet summarizes the findings of a survey conducted with bakery owners and managers to assess their organic wheat flour quality and sourcing needs.
Premium Potential for Organic Wheat Products
This Extension fact sheet provides an overview of the premiums consumers in the Western U.S. are willing to pay for organic wheat products, as well as their knowledge of organic production methods, and opinions and attitudes toward organic food products i
Wheat Miller and Distributor Organic Wheat Quality and Quantity Requirements
This fact sheet summarizes the findings of a survey conducted with wheat buyers (millers and distributors) to assess their organic wheat quality and sourcing needs. We examine the importance of various quality measures in miller and distributor decisions