Which Factors Influence Consumer Organic Specialty Bakery Product Taste Ratings?
Introduction
In general, consumers feel that organic products taste different than conventional products (e.g., Napolitano et al., 2013; Ellison et al., 2016). Consumers even rate the taste of organic labeled products differently than the exact same but unlabeled organic products (Lee at al., 2013; Bernard & Liu, 2017). The organic label may impact taste perceptions and product attractiveness differently depending on whether the product is consumed for utilitarian or hedonistic purposes (Ellison et al., 2016; Nadricka et al., 2020). Consumers often purchase specialty bakery and pastry products (croissants, large cookies, specialty breads, scones, etc.) for a treat or special occasion, and thus are hedonistic. If consumers perceive organic foods to be healthy, which is often the case (Nadricka et al., 2020; Hughner et al., 2007; Lea & Worsley, 2005), they may value conventional products over organic when seeking out tasty treats due to beliefs that healthy and tasty are negatively correlated (Raghunathan et al., 2006). Hence, consumer organic product taste perceptions may reduce their interest in organic specialty bakery/pastry products. Clearly, the organic label biases taste evaluations, and thus, it would be helpful to understand what factors influence organic product taste evaluations to determine what might be done to improve the reputation of organic hedonistic products.
In this fact sheet, we compare consumer taste ratings for organic and conventional specialty bakery products and analyze what factors explain the differences. These products are typically consumed for pleasure and are more expensive than mainstream baked goods. However, consumers have high quality expectations, including taste, which may be an issue if not satisfactory. Understanding factors that impact consumer taste rating for organic specialty bakery products can help identify what might be done to improve taste perceptions/expectations and the success of organic specialty bakery/pastry products.
The factors examined include:
- Respondent consumption frequency of organic and conventional specialty bakery products.
- Importance of organic label and taste when purchasing specialty bakery products.
- Attitudes toward organics.
- Knowledge of organic labeling standards.
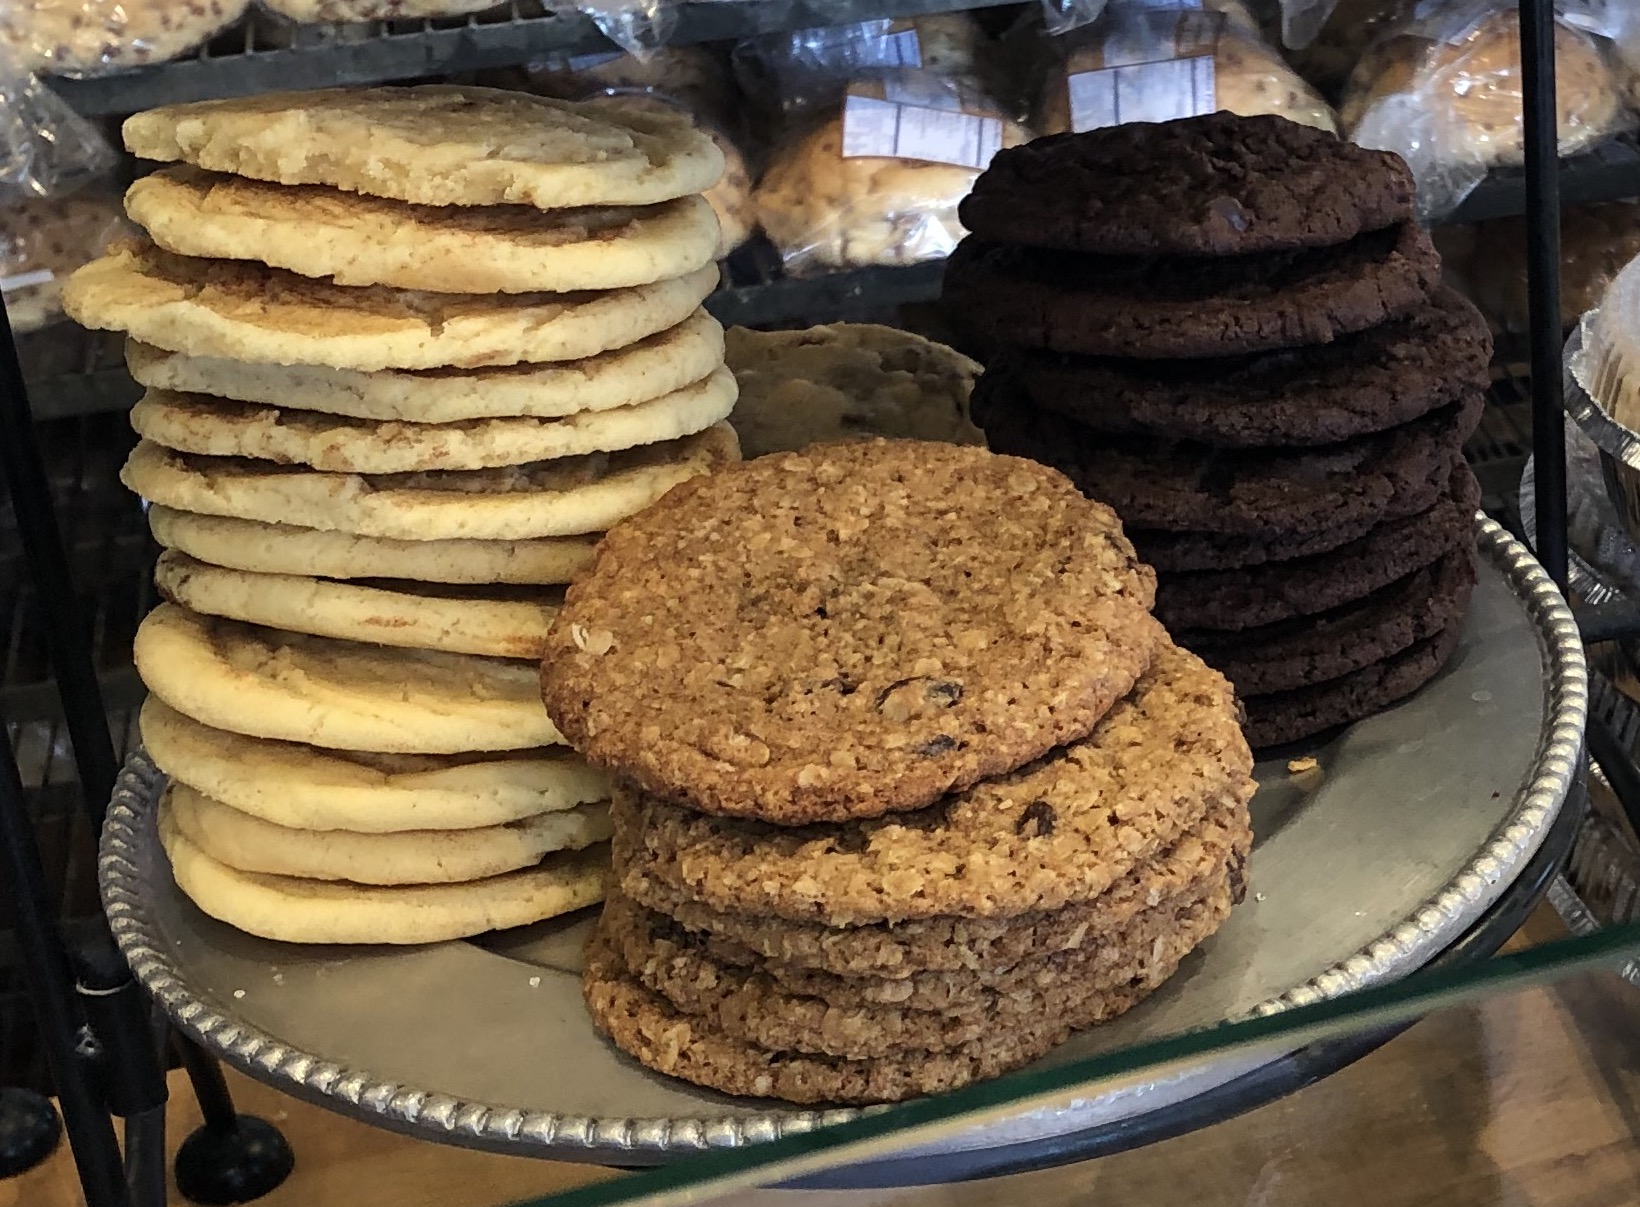
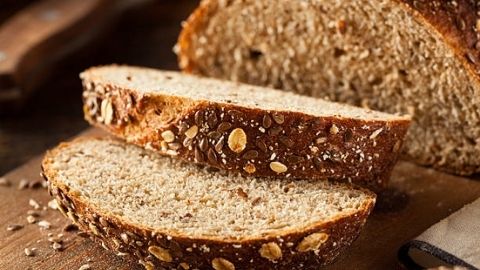
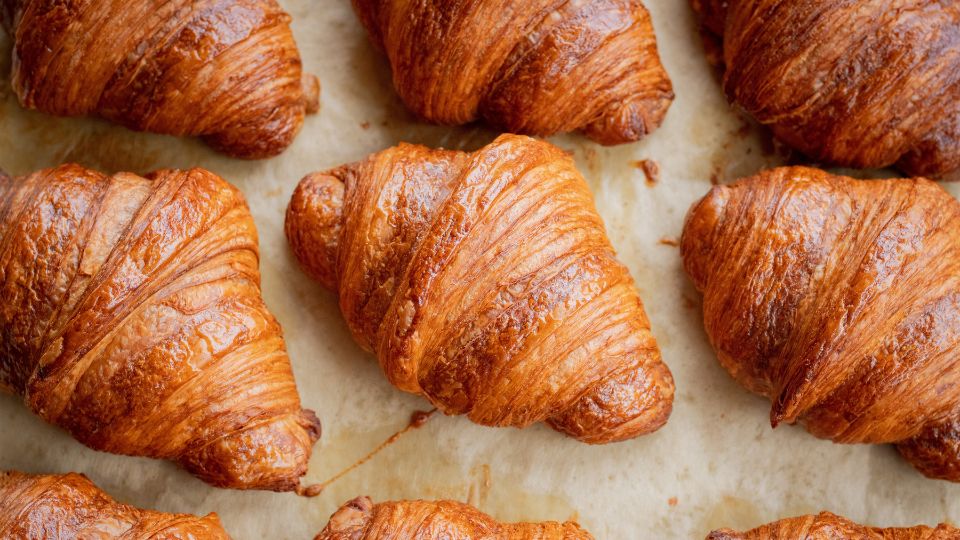
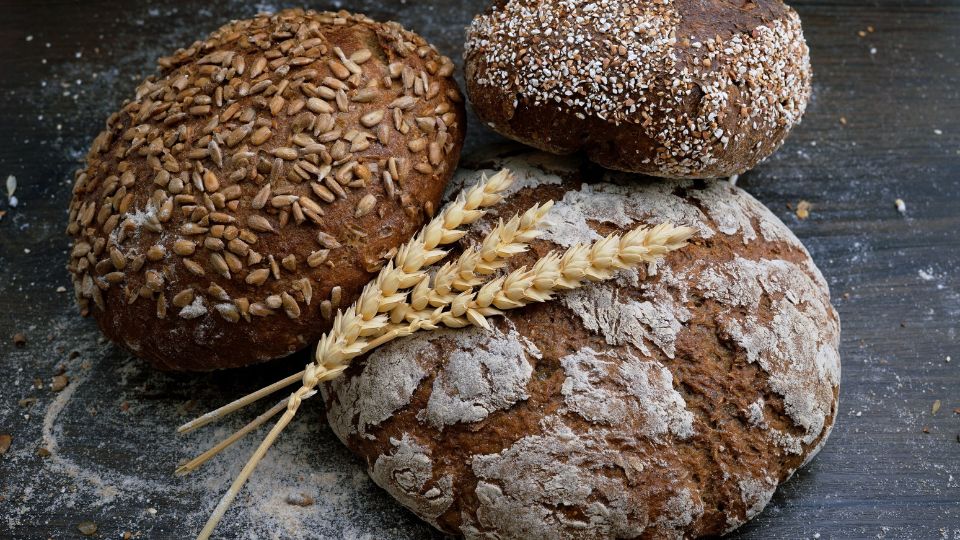
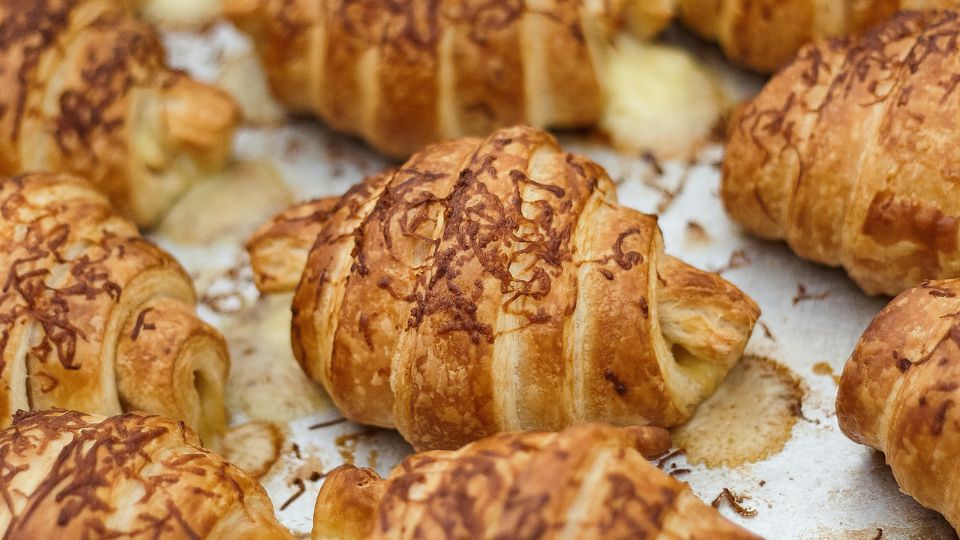
We conducted the analysis for three different products—bread loaf, croissant, and large cookie.
 Collecting Taste Ratings
Data were collected in the fall of 2021 through a nationwide consumer survey using Qualtrics, and 721 valid responses were received. Table 1 shows that the sample is representative of the U.S. population in terms of age, gender, marital status, and households with children. The respondents in the sample are slightly more educated than the U.S. average but have a lower household income.
Respondents were asked to rate the taste of organic and conventional specialty bakery/pastry products on a scale from 1 = very poor to 5 = very good. Table 2 shows that the average taste ratings for the organic products are significantly lower than the conventional for all three products, but especially for large cookie. These results seem to confirm the “healthy = tastes bad” theory previously discussed, although the organic product ratings were still above 3. Next, we examine what factors impact consumer taste ratings for these products.
Table 1.
Sample Demographics vs. U.S. Population
|
Characteristic |
Category |
Sample |
U.S. population |
|
Age |
Age 18–24 |
12% |
12% |
|
Age 25–44 |
33% |
34% |
|
|
Age 45–64 |
33% |
33% |
|
|
Age >64 |
21% |
21% |
|
|
Gender |
Male |
49% |
48% |
|
Female |
50% |
52% |
|
|
Marital status |
Married |
49% |
48% |
|
Children |
Children in the household |
34% |
31% |
|
Education level |
High school or less |
24% |
39% |
|
Some college or associate degree |
41% |
31% |
|
|
4-year collegea |
23% |
19% |
|
|
Graduate degree or higher |
12% |
11% |
|
|
Household income |
<$50,000 |
50% |
39% |
|
$50,000–$99,999 |
35% |
30% |
|
|
≥ $100,000 |
15% |
31% |
Note. aU.S. population data include graduate degree for the population between 18–24 years old.
Source: U.S. Census Bureau, 2020 American Community Survey 5-Year Estimates.
Table 2.
Taste Ratings for Organic and Conventional Bakery Products (scale of 1–5)
|
Bread loaf |
Croissant |
Large cookie |
|
|
Organic rating (O) |
3.60 |
3.61 |
3.57 |
|
Conventional rating (C) |
3.91 |
4.03 |
4.12 |
|
Difference in ratings (O - C) |
-0.32* |
-0.41* |
-0.55* |
Note.The asterisk (*) denotes significant difference in taste ratings between organic and conventional products.
Which Factors Explain Taste Rating Differences?
In examining sample averages for the various factors that might explain differences in respondent taste ratings, Table 3 shows that respondents tend to consume organic specialty bakery/pastry products less often than the conventional. This means that they likely have less experience with organic bakery products and may rely more on their beliefs than actual product experience. Of respondents, 70%–78% (depending on the product) consider taste as an important attribute when purchasing bakery products, while only 21%–38% consider organic an important product attribute.
Respondents were also asked to express their agreement with eight statements related to organic bakery/pastry products on a scale from 1 = strongly disagree to 5 = strongly agree. The sample averages in Table 4 are mostly greater than 3, which means that respondents tend to agree with the statements. Based on these statements, two composite variables representing positive and negative attitudes toward organic bakery products were used in the statistical analysis. We also provided respondents six statements related to organic labeling standards and asked them to indicate whether they were true or false. On average, respondents identified less than three statements correctly, so their knowledge of organic labelling standards was relatively low. Finally, organic labeling standards information was provided to half the respondents to examine whether increasing their knowledge might improve their taste ratings for organic bakery/pastry products.
Table 3.
Consumption Frequency, Importance of Organic and Taste
|
|
Bread loaf |
Croissant |
Large cookie |
|
Organic bakery product consumption frequencya |
1.23 |
1.03 |
1.15 |
|
Conventional bakery product consumption frequencya |
2.18 |
1.47 |
2.06 |
|
Importance of organic when purchasing |
38% |
28% |
21% |
|
Importance of taste when purchasing |
70% |
73% |
78% |
Note. a0 = never; 1 = once a month or less; 2 = several times a month; 3 = once a week; 4 = several times a week
Table 4.
Attitudes Toward Organic Bakery Products, Organic Knowledge
|
Statement |
Attitude description |
Sample average |
|
I am interested in organic bakery products. |
Positive |
3.47 |
|
Organic bakery products are healthier than conventional ones. |
Positive |
3.67 |
|
Organic bakery products are safer than conventional ones. |
Positive |
3.42 |
|
I am concerned about the taste of organic bakery products. |
Negative |
3.26 |
|
The selection of organic bakery products is not good. |
Negative |
2.99 |
|
Organic bakery products are too expensive. |
Negative |
3.79 |
|
Organic bakery products are not important to me. |
Negative |
2.98 |
|
Variety/flavor is more important to me than the organic label. |
Negative |
3.68 |
|
Knowledge of organic labeling standards. |
Organic score |
2.90 |
Three models were used to examine which factors explain the difference in taste ratings—one model per product (see Table 5). A positive value means that the factor improves the taste rating of the organic bakery/pastry product. Factors with negative values contribute to lower taste rating for the organic bakery products.
Table 5.
Factor Impacts on Organic Taste Ratings
|
Factor |
Bread loaf |
Croissant |
Large cookie |
|
Organic consumptiona |
0.31* |
0.38* |
0.36* |
|
Conventional consumptiona |
-0.16* |
-0.24* |
-0.22* |
|
Organic importancea |
-0.08 |
0.17* |
0.24* |
|
Taste importancea |
0.14 |
0.05 |
-0.19* |
|
Positive attitudesb |
0.14* |
0.15* |
0.13* |
|
Negative attitudesc |
-0.16* |
-0.21* |
-0.25* |
|
Organic score |
0.03 |
0.00 |
-0.02 |
|
Organic information |
0.09 |
0.07 |
0.07 |
|
Age |
-0.08* |
-0.08 |
-0.07 |
|
Female |
-0.19* |
-0.12 |
-0.16* |
|
Children |
-0.08 |
-0.18* |
-0.16* |
|
Education level |
0.00 |
0.00 |
0.01 |
|
Employed |
0.00 |
-0.09 |
-0.15 |
|
Household income |
0.00 |
0.01 |
0.02 |
|
Caucasian |
-0.08 |
-0.14 |
0.03 |
Note. The asterisk (*) denotes the estimated value is statistically significant.
a The factor was measured for bread in “Bread loaf” regression, croissant in “Croissant” regression, etc.
b Composite variable representing positive attitudes toward organic bakery products.
c Composite variable representing negative attitudes toward organic bakery products.
The results show that more frequent consumption of an organic bakery/pastry product increases respondent taste ratings for that product compared to the conventional product, while more frequent consumption of a conventional product reduces their taste rating for the organic products. This suggests that additional experience with organic bakery products can improve consumer taste perceptions. Further, respondents who think that organic is important rate the taste of organic croissants and cookies better, but not the bread loaf. This suggests that consumers who value organic products may be willing to compromise on taste. Respondents who think that taste is important have a lower taste rating for organic cookies but not for organic bread loaf and croissants. We also find that respondents with stronger positive attitudes toward organic bakery products tend to rate their taste better compared to conventional, while the opposite applies to respondents with stronger negative attitudes. Additionally, the results show that knowledge of organic labeling standards does not impact their taste ratings. Thus, educating consumers about organic labeling will likely not improve their taste perceptions, at least for organic specialty bakery products.
Conclusions
In this fact sheet, we show significant differences between the taste ratings for organic and conventional specialty bakery/pastry products among a sample of U.S. consumers. The consumption frequency of organic and conventional specialty bakery products, the importance of organic and taste when purchasing specialty bakery products, and attitudes toward these products significantly impacted respondent taste ratings.
We found that actual organic labeling knowledge, as well as provided information about organic labeling standards, did not explain differences in taste ratings, suggesting that educating consumers about organic labeling standards will not be helpful in eliminating their taste biases. On the other hand, improving consumer attitudes toward and taste perceptions of organic products will likely improve their taste ratings. Overall, it appears that consumers generally feel that organic specialty bakery/pastry products will not taste good. Marketing efforts should include clear messages that would improve consumer perceptions of organic foods. Additionally, increased exposure to organic specialty bakery products, such as provided samples, use of organic products at events, etc., will likely improve consumer taste expectations of these products.
References
- Bernard, J. C., & Liu, Y. (2017). Are beliefs stronger than taste? A field experiment on organic and local apples. Food Quality and Preference, 61, 55–62. doi: 10.1016/j.foodqual.2017.05.005.
- Ellison, B., Duff, B. R., Wang, Z., & White, T. B. (2016). Putting the organic label in context: Examining the interactions between the organic label, product type, and retail outlet. Food Quality and Preference, 49, 140–150. doi: 10.1016/j.foodqual.2015.11.013.
- Hughner, R. S., McDonagh, P., Prothero, A., Shultz, C. J., & Stanton, J. (2007). Who are organic food consumers? A compilation and review of why people purchase organic food. Journal of Consumer Behaviour, 6(2‐3), 94–110. https://dx.doi.org/10.1002/cb.210.
- Lea, E., & Worsley, T. (2005). Australians' organic food beliefs, demographics and values. British Food Journal, 107(11), 855–869. https://dx.doi.org/10.1108/00070700510629797.
- Lee, W. C. J., Shimizu, M., Kniffin, K. M., & Wansink, B. (2013). You taste what you see: Do organic labels bias taste perceptions? Food Quality and Preference, 29(1), 33–39. doi: 10.1016/j.foodqual.2013.01.010.
- Nadricka, K., Millet, K., & Verlegh, P. W. (2020). When organic products are tasty: Taste inferences from an Organic = Healthy Association. Food Quality and Preference, 83, 103896. https://doi.org/10.1016/j.foodqual.2020.103896.
- Napolitano, F., Castellini, C., Naspetti, S., Piasentier, E., Girolami, A., & Braghieri, A. (2013). Consumer preference for chicken breast may be more affected by information on organic production than by product sensory properties. Poultry Science, 92(3), 820–826. doi: 10.3382/ps.2012-02633.
- Raghunathan, R., Naylor, R. W., & Hoyer, W. D. (2006). The unhealthy = tasty intuition and its effects on taste inferences, enjoyment, and choice of food products. Journal of Marketing, 70(4), 170–184. https://dx.doi.org/10.1509/jmkg.70.4.170
Published February 2023
Utah State University Extension
Peer-Reviewed Fact Sheet
Authors
Tatiana Drugova, Post-Doctoral Fellow, Department of Applied Economics; Kynda R. Curtis, Professor and Extension Specialist, Department of Applied Economics

Kynda Curtis
Food Systems Specialist
APEC Dept
Related Research
Who Are Organic Wheat Consumers?
This fact sheet provides an overview of the socio-demographics, attitudes, and preferences of organic wheat consumers in the Western U.S. It discusses information on what food attributes these consumers value most along with their lifestyle and shopping h
Adopting Organic Wheat: Grower Motivations and Concerns
This fact sheet provides an overview of the study results by discussing grower motivations for adopting organic methods, as well as grower concerns regarding organic production.
Consumer Taste Beliefs Impact Organic Specialty Baked Good Pricing
In this fact sheet, we discuss how consumer taste beliefs related to organic specialty baked goods differ from their taste beliefs for conventional specialty baked goods, and whether this difference affects the amount consumers are willing to pay for orga
Which Factors Influence Consumer Organic Specialty Bakery Product Taste Ratings?
In this fact sheet, we compare consumer taste ratings for organic and conventional specialty bakery products and analyze what factors explain the differences.
Characteristics of Organic Wheat Growers
This fact sheet provides an overview of the study results and compares and contrasts these results with the results of other studies. It also provides suggestions for outreach to current and potential organic wheat growers.

Do Consumers Who Prefer Gluten-Free Also Prefer Organic?
In this fact sheet, we examine how consumers, who choose to avoid wheat/gluten bakery products for a variety of reasons, respond to organic wheat products relative to those who do not limit their wheat/gluten consumption, and whether organic wheat product

Labeling and Product Characteristic Preferences of Organic Food Buyers
This Extension fact sheet discusses the results of an online survey conducted in 2017 across 16 western states via Qualtrics. Just over one thousand residents responded to the survey.
Does Consumer Knowledge of Organic Production Standards Influence Demand for Organic and Non-GMO Labeled Foods?
This fact sheet summarizes a study conducted on consumer willingness to pay (WTP) for organic and non-GMO labels alone and in combination for bread and cookies, and how consumer knowledge that organic is non-GMO and overall organic knowledge of organic st
Who Values Organic Specialty Bakery Products?
In this fact sheet, we examine differences in sociodemographics and lifestyle choices between those who view organic as important when purchasing specialty bakery products and those who don’t, with the aim to identify a target market of consumers who pref
Bakery Organic Wheat Flour Quality and Quantity Requirements
This fact sheet summarizes the findings of a survey conducted with bakery owners and managers to assess their organic wheat flour quality and sourcing needs.
Premium Potential for Organic Wheat Products
This Extension fact sheet provides an overview of the premiums consumers in the Western U.S. are willing to pay for organic wheat products, as well as their knowledge of organic production methods, and opinions and attitudes toward organic food products i
Wheat Miller and Distributor Organic Wheat Quality and Quantity Requirements
This fact sheet summarizes the findings of a survey conducted with wheat buyers (millers and distributors) to assess their organic wheat quality and sourcing needs. We examine the importance of various quality measures in miller and distributor decisions