Do Consumers Who Prefer Gluten-Free Also Prefer Organic?
Introduction
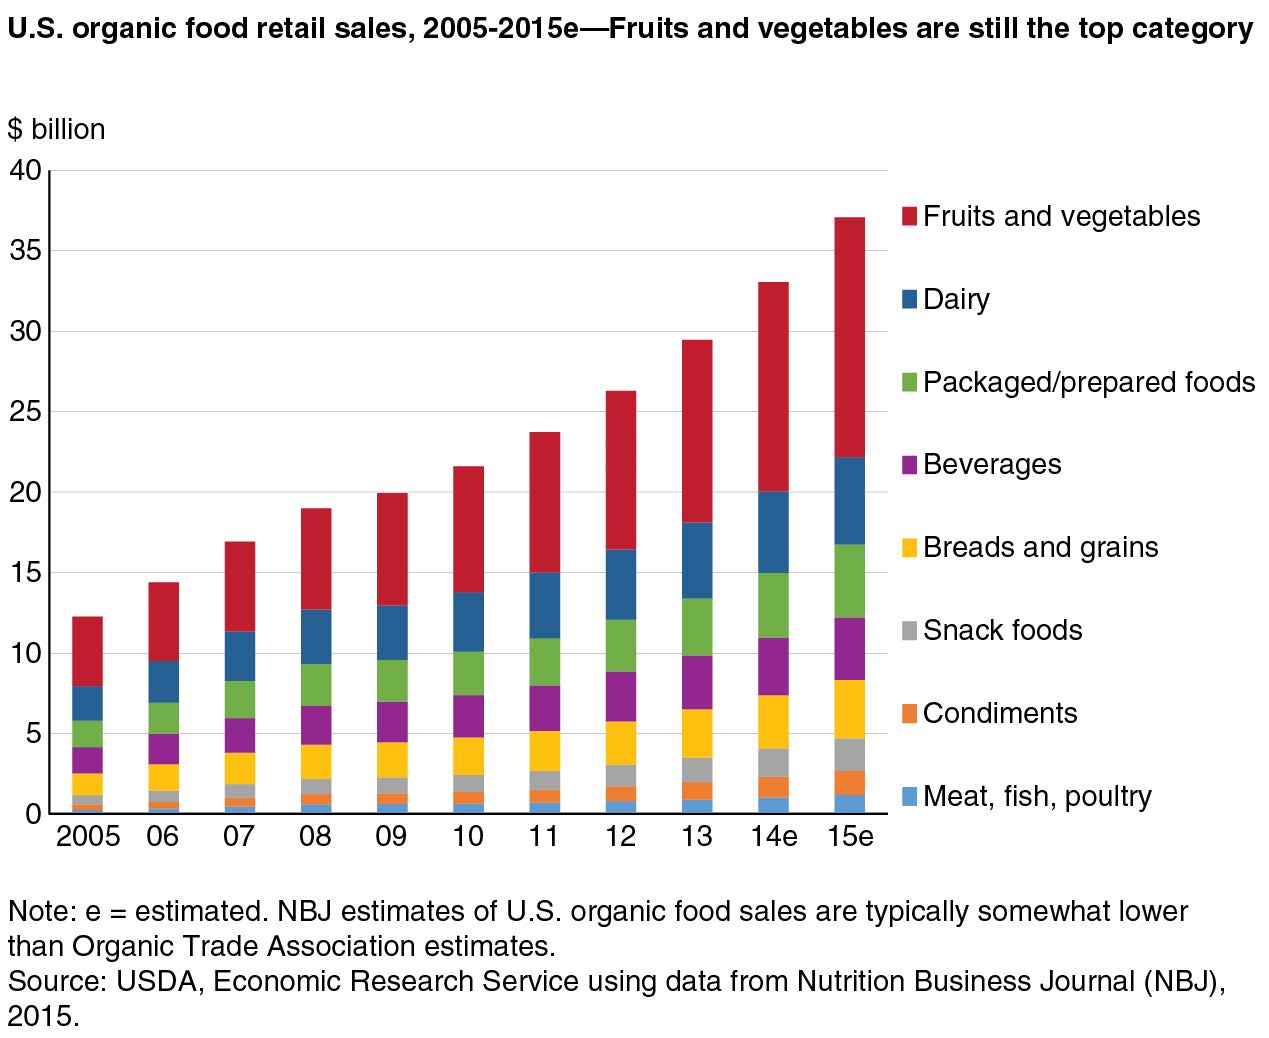
In recent years, consumers interest in products with labels claiming that the product is either free from an ingredient perceived as potentially harmful, or that the product is safer for consumption, due to less processing or grown with environmentally friendly production practices for example, has increased. These types of labels are referred to as “clean labels” (Asioli et al., 2017). The organic label is an example of a clean label and the sales of organic foods increased from $3.4 billion to $45.2 billion between 1997 and 2017, with an average annual growth of 14% (OTA, 2018). Within organic food sales, the bread and grains category represented around 10% of total organic sales in 2015 as shown in Figure 1 (USDA ERS, 2017). Consumers who prefer healthier versions of bread and bakery products may choose gluten-free versions, as gluten-free is another clean label. Between 2010 and 2015, the U.S. gluten-free foods market grew by 36% annually (Berry, 2017). However, studies suggest that some quality attributes of gluten-free bakery products lag behind those of traditional wheat-based bakery products (Arendt et al., 2002; Potter, Stojceska, and Plunkett, 2014).
While some consumers must avoid wheat/gluten for health reasons, due to celiac disease for example, many others choose to avoid them based on their beliefs that gluten-free products are better for their health. Similarly, research shows that perceived healthiness is among the most important reasons for purchasing organic food (Padel and Foster, 2005; Lee and Yun, 2015). In this fact sheet, we examine how consumers, who choose to avoid wheat/gluten bakery products for a variety of reasons, respond to organic wheat products relative to those who do not limit their wheat/gluten consumption, and whether organic wheat products are viewed as an alternative to gluten-free bakery products. We also examine consumer preferences for the combination of organic and gluten-free labels on bakery products.
The data for this fact sheet were collected via an online survey conducted in the summer 2017 across 16 U.S. western states. A total of 1,009 responses were recorded. Respondents were asked whether they or anyone else in their household suffer from wheat/gluten intolerance or celiac disease and whether or not they avoid wheat/gluten for other reasons. Further, they were asked about their past organic bread and organic cookie purchases as well as the importance of organic and gluten-free labels on the bakery products they purchase. Finally, hypothetical descriptions of bread and cookie products were presented to each respondent and they were asked to select the one they would choose in a real shopping scenario. The products differed in price and the labels provided. Respondents were also given an option to opt out. Their choices allowed us to estimate willingness to pay (WTP) for the organic and gluten-free labels on bread and cookies. The WTP values were obtained for products with each of these labels alone, as well as for a product with both labels.
Wheat/Gluten Limitations and Organic Bakery Product Purchase History
Out of 1,009 respondents, 230 respondents indicated that they or someone in their household have a wheat/gluten intolerance or avoid wheat/gluten for other reasons (WGIA group). Another 779 respondents indicated no wheat/gluten intolerance or avoidance (NWGIA group) by members of their household. Table 1 shows that the share of those who purchased organic bread and cookies within WGIA group is greater than the share of those within NWGIA group. This provides evidence that those with some wheat/gluten intolerance/avoidance are more likely to purchase organic bread and cookies than those without such limitations. Next, we examine whether there are differences in consumer preferences for the organic and gluten-free labels across the two groups.
Wheat or Gluten Limitations and Preferences for Organic and Gluten-Free Labels
We asked respondents to rank importance of seven labels on bread and cookies, including organic and gluten-free labels, where 7 = “most important” and 1 = “least important.” Table 2 reports the average rankings of the organic and gluten-free labels in WGIA and NWGIA groups. Those in the WGIA group rank both labels as more important, on average, than those in NWGIA group, for both products. As expected, those in the WGIA group rank the gluten-free label as slightly more important than the organic label and their ranking of these labels is similar for bread and cookies.
Table 1. Organic Bread and Cookie Purchase History
| Some wheat/gluten intolerance/avoidance (WGIA) | No wheat/gluten intolerance/avoidance (NWGIA) | |
|---|---|---|
| Purchased organic bread Did not purchase organic bread |
147 (64% of 230) 83 (36% of 230) |
257 (33% of 779) 522 (67% of 779) |
| Purchased organic cookies Did not purchase organic cookies |
112 (49% of 230) 118 (51% of 230) |
129 (17% of 779) 650 (83% of 779) |
| Total | 230 | 779 |
Table 2. Average Ranking of the Organic and Gluten-Free Labels (Scale of 1-7)
| Product | Label | WGIA | NWGIA |
|---|---|---|---|
| Bread | Organic | 4.18 | 3.63 |
| Gluten-free | 4.31 | 2.06 | |
| Cookies | Organic | 4.16 | 3.52 |
| Gluten-free | 4.31 | 2.48 |
 Willingness to Pay for Organic and Gluten-Free Labels
Table 3 shows consumer WTP for bread products with only the organic label, the gluten-free label only, and products with both labels. On average, those in WGIA group are willing to pay $1.44 more for the gluten-free label on bread than those in NWGIA group, as expected. They are also willing to pay $1.15 more for the organic label, and $2.59 more for the bread with both labels. Non-zero standard deviations mean that individual respondents’ WTP values are not the same, but they are spread around the averages. In the WGIA group, 44% of respondents are willing to pay $2 extra or more for organic bread, but for the NWGIA group only 23% are willing to pay extra. Further, since those in NWGIA group value the gluten-free label by itself negatively, and their overall average WTP for bread with both labels is smaller than their WTP for organic bread, which is not the case for WGIA group. Only 21% of those in NWGIA group are willing to pay more than $2 for bread with both labels, while the share of those willing to pay more is 56% in the WGIA group.
 Table 4 reports WTP values for the labels alone and in combination on cookies. Again, those in the WGIA group are willing to pay more for gluten-free cookies than those in NWGIA group—on average $1.04 more. They are also willing to pay $1.06 more for the organic cookies, and a total of $2.10 more for cookies with both labels. While 34% of respondents in WGIA group are willing to pay $2 or more for organic cookies, only 17% of respondents in NWGIA group would do the same. Again, the combination of the organic and gluten-free labels on cookies results in overall higher average WTP than the WTP for the cookies with organic label alone within the WGIA group, but not within NWGIA group.
Table 3. WTP Values for Organic and Gluten-Free Labels, Bread
| Group | Labels | WTP Mean | WTP St. Dev. | WTP>$0 | WTP>$1 | WTP>$2 |
|---|---|---|---|---|---|---|
| WGIA | Organic only | $1.52 | $3.40 | 67% | 56% | 44% |
| Gluten-free only | $1.10 | $2.50 | 67% | 52% | 36% | |
| Both labels | $2.62 | $4.22 | 73% | 65% | 56% | |
| NWGIA | Organic only | $0.37 | $2.22 | 57% | 39% | 23% |
| Gluten-free only | $0.34 | $1.01 | 37% | 9% | 1% | |
| Both labels | $0.03 | $2.44 | 50% | 35% | 21% |
Table 4. WTP Values for Organic and Gluten-Free Labels, Cookies
| Group | Labels | WTP Mean | WTP St. Dev. | WTP>$0 | WTP>$1 | WTP>$2 |
|---|---|---|---|---|---|---|
| WGIA | Organic only | $1.06 | $2.30 | 68% | 51% | 34% |
| Gluten-free only | $0.63 | $1.88 | 63% | 42% | 23% | |
| Both labels | $1.69 | $2.97 | 72% | 59% | 46% | |
| NWGIA | Organic only | $0.00 | $2.06 | 50% | 31% | 17% |
| Gluten-free only | -$0.41 | $1.13 | 36% | 11% | 2% | |
| Both labels | -$0.41 | $2.35 | 43% | 27% | 15% |
Conclusions
This fact sheet summarizes results of an online survey that examined consumer preferences for labels on bread and cookies, focusing on the preferences for organic and gluten-free labels and how they relate to the consumer wheat/gluten intolerance/avoidance (WGIA). First, we find that those with some WGIA are more likely to have purchased organic versions of bread and cookies than those with no WGIA. Those in WGIA group also rank both labels as more important than those in the NWGIA group, regardless of the product category. Further, those in WGIA group are willing to pay, on average a positive amount for the organic label, gluten-free label, and combination of both labels on bread and cookies, and significantly higher amounts than those in NWGIA group.
Interestingly, on average, the WGIA group is willing to pay more for the organic label than the gluten-free label on both products, but they rank gluten-free label as slightly more important. Those in NWGIA group are willing to pay a positive amount for the organic label too, but they require a discount for the gluten-free label. Comparing the WTP values across product categories, both WGIA and NWGIA are willing to pay more for the organic label on bread than cookies. Finally, we find that consumers evaluate the organic and gluten-free labels independently from each other. That is, the WTP for a product with both labels is the sum of the WTP for each label alone and there are no additional effects as a result of the labels interaction.
Overall, the results show that those with some wheat/gluten intolerance/avoidance are an important market segment for organic bakery products. The findings suggest that the promotion of organic wheat products to this segment can stimulate sales and lead to higher pricing when both labels are present.
References
- Arendt, E.K., C.M. O'Brien, T.J. Schober, E. Gallagher, and T.R. Gormley. 2002. “Development of Gluten-Free Cereal Products.” Farm Food 12(2):21–27.
- Asioli, D., J. Aschemann-Witzel, V. Caputo, R. Vecchio, A. Annunziata, T. Næs, and P. Varela. 2017. “Making Sense of the “Clean Label” Trends: A Review of Consumer Food Choice Behavior and Discussion of Industry Implications.” Food Research International 99:58-71.
- Berry, D. 2017. “Special Report: Gluten-free enters the Mainstream.” Available at: https://www.foodbusinessnews.net/articles/9612-special-report-gluten-free-enters-the-mainstream?page=1
- Lee, H.J., and Z.S. Yun. 2015. “Consumers’ per-ceptions of organic food attributes and cognitive and affective attitudes as determinants of their purchase intentions toward organic food.” Food Quality and Preference 39:259-267.
- Organic Trade Association (OTA). 2018. “Maturing U.S. Organic Sector Sees Steady Growth of 6.4 Percent in 2017.” Press release. Available at: https://ota.com/news/press-releases/20236
- Padel, S., and C. Foster. 2005. “Exploring the Gap between Attitudes and Behaviour: Understanding Why Consumers Buy or Do Not Buy Organic Food.” British Food Journal 107(8):606-625.
- Potter, R., V. Stojceska, and A. Plunkett. 2014. “An Investigation of the Consumer Perception on the Quality of the Gluten and Wheat Free Breads Available on the UK Market.” Journal of Food Measurement and Characterization 8(4):362-372.
- U.S. Department of Agriculture, Economic Research Service (USDA ERS). 2017. Organic Market Overview. Available at: https://www.ers.usda.gov/topics/natural-resources-environment/organic-agriculture/organic-market-overview/
Date Published: August 2019
Authors
Tatiana Drugova, Graduate Research Fellow, Department of Applied Economics; Kynda R. Curtis, Professor and Extension Specialist, Department of Applied Economics

Kynda Curtis
Food Systems Specialist
APEC Dept
Related Research
Who Are Organic Wheat Consumers?
This fact sheet provides an overview of the socio-demographics, attitudes, and preferences of organic wheat consumers in the Western U.S. It discusses information on what food attributes these consumers value most along with their lifestyle and shopping h

Adopting Organic Wheat: Grower Motivations and Concerns
This fact sheet provides an overview of the study results by discussing grower motivations for adopting organic methods, as well as grower concerns regarding organic production.
Consumer Taste Beliefs Impact Organic Specialty Baked Good Pricing
In this fact sheet, we discuss how consumer taste beliefs related to organic specialty baked goods differ from their taste beliefs for conventional specialty baked goods, and whether this difference affects the amount consumers are willing to pay for orga
Which Factors Influence Consumer Organic Specialty Bakery Product Taste Ratings?
In this fact sheet, we compare consumer taste ratings for organic and conventional specialty bakery products and analyze what factors explain the differences.

Characteristics of Organic Wheat Growers
This fact sheet provides an overview of the study results and compares and contrasts these results with the results of other studies. It also provides suggestions for outreach to current and potential organic wheat growers.

Do Consumers Who Prefer Gluten-Free Also Prefer Organic?
In this fact sheet, we examine how consumers, who choose to avoid wheat/gluten bakery products for a variety of reasons, respond to organic wheat products relative to those who do not limit their wheat/gluten consumption, and whether organic wheat product

Labeling and Product Characteristic Preferences of Organic Food Buyers
This Extension fact sheet discusses the results of an online survey conducted in 2017 across 16 western states via Qualtrics. Just over one thousand residents responded to the survey.

Does Consumer Knowledge of Organic Production Standards Influence Demand for Organic and Non-GMO Labeled Foods?
This fact sheet summarizes a study conducted on consumer willingness to pay (WTP) for organic and non-GMO labels alone and in combination for bread and cookies, and how consumer knowledge that organic is non-GMO and overall organic knowledge of organic st

Who Values Organic Specialty Bakery Products?
In this fact sheet, we examine differences in sociodemographics and lifestyle choices between those who view organic as important when purchasing specialty bakery products and those who don’t, with the aim to identify a target market of consumers who pref
Bakery Organic Wheat Flour Quality and Quantity Requirements
This fact sheet summarizes the findings of a survey conducted with bakery owners and managers to assess their organic wheat flour quality and sourcing needs.
Premium Potential for Organic Wheat Products
This Extension fact sheet provides an overview of the premiums consumers in the Western U.S. are willing to pay for organic wheat products, as well as their knowledge of organic production methods, and opinions and attitudes toward organic food products i

Wheat Miller and Distributor Organic Wheat Quality and Quantity Requirements
This fact sheet summarizes the findings of a survey conducted with wheat buyers (millers and distributors) to assess their organic wheat quality and sourcing needs. We examine the importance of various quality measures in miller and distributor decisions