
Postmenopause: Understanding Utahns’ Experiences


Introduction
Key Takeaways
- Perimenopause begins with fluctuating or declining hormone levels, irregular menstruation, and symptoms such as hot flashes and mood changes.
- Menopause is 12 consecutive months without a menstrual cycle.
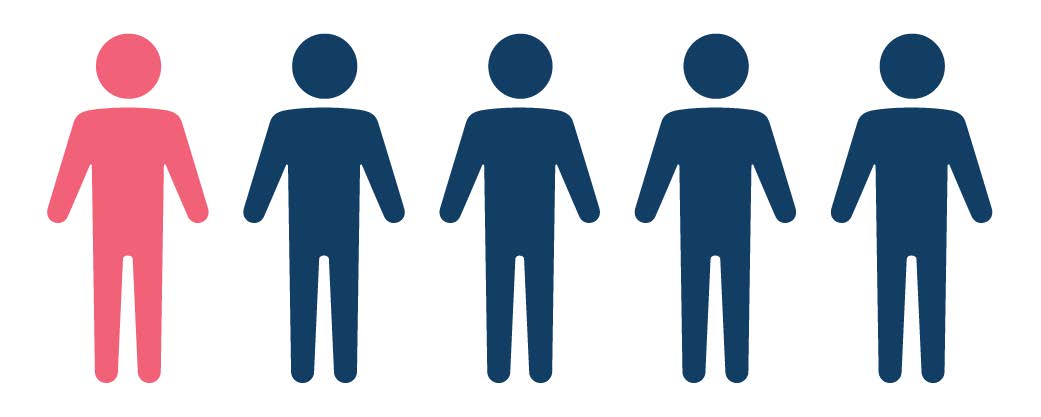
- In a USU Extension study, researchers found that the average age of perimenopause/menopause onset in Utah was 42.1 years and the average age of menopause onset in Utah was 47.5 years.
- Their survey found that hot flashes and fatigue were the symptoms most experienced, while exercise and hormone replacement therapy were the most used remedies.
- Only about half of participants reported that conversations with medical professionals were helpful.
- After going through menopause, most often women felt relieved and saw it as a new chapter without menstrual cycles.
Menopause is an important transition period that occurs over time and progresses through several phases (National Institute on Aging [NIA], 2024; Office on Women’s Health [OASH], 2025). The first stage of menopause, known as perimenopause, is signaled by fluctuating or declining hormone levels, irregular menstruation, and the onset of symptoms such as hot flashes and mood changes. Menopause follows this phase, which is 12 consecutive months when no menstrual cycles occur in combination with hormone decline and experiencing additional symptoms (e.g., hot flashes, sleep disturbances). At this phase concludes, women enter the postmenopause phase, when normal hormone levels stabilize at a new baseline, and many menopause-related symptoms resolve.
Menopause can occur naturally or can be induced medically. The phases of menopause can span a significant portion of women’s lives (e.g., perimenopause typically lasts 2 to 10 years; NIA, 2024; OASH, 2025), necessitating resources and support to help women navigate this life stage. However, medical care, resources, and support for menopause have typically failed to meet women’s needs (Cunningham et al., 2025; Gilmer et al., 2023). Additionally, few studies have examined the menopausal experiences of Utahns, forcing providers and other professionals to rely on anecdotal accounts and national studies to guide their intervention efforts. The current project fills this gap by assessing Utahns’ perceptions and experiences of menopause.
Utah State University (USU) Extension is an important community resource, with a long history of providing health education programs and materials to Utahns in both rural and urban areas. USU Extension is a trusted source of information, translating academic research into accessible, evidence-informed information that helps Utahns live their healthiest and happiest lives. While USU Extension has provided health education programming across various health topics (e.g., mental health, physical health, nutrition), midlife health and menopause-specific efforts have not historically been included and have been areas of reported interest among county faculty. To better understand Utahns’ needs and preferences during menopause, researchers conducted a needs assessment to inform programming creation and delivery.
The purpose of this survey was twofold:
- Understand the menopause experiences, perceptions, and attitudes of women across the lifespan.
- Identify Utahns’ needs and preferences for menopause programming and education materials from USU Extension.
Method
The survey used in the project was carefully constructed through reviewing the current literature and piloting the instrument prior to data collection. The survey included questions about menopause knowledge, symptoms, information-seeking behaviors, and preferences for menopause educational programming. Additionally, this project was determined to be nonhuman subjects by the USU Institutional Review Board (#15580).
The survey was disseminated in the spring of 2026. The project team determined it was best to actively recruit participants between February 1 and April 1, 2026, to avoid holidays, survey fatigue from other Extension surveys, and the busy season in the spring.
The survey was sent at differing intervals throughout the intentional data collection recruitment window via a variety of recruitment methods. These included: flyers distributed to USU Extension programming participants when the program’s target audience matched our target population, flyers posted in the community, direct emails through listservs, and social media posts. Because social media recruitment carries a risk of bot activity, we constantly monitored survey completions, examining IP address codes and responses to the zip code question to identify bot responses. Only two responses were removed, as IP addresses came from outside of the United States or Utah.
The recruitment materials provided a link or QR code that took potential participants to the survey, which began by asking them to complete two selection criteria questions (e.g., 18 years or older and can, has, or will experience menopause). The survey took approximately 10 minutes to complete.
Analysis
The current report provides a descriptive understanding of survey responses from a subsample of survey respondents who self-identified as being in the postmenopause phase (22.9% of the total sample, n = 114). A descriptive analysis was conducted in Stata 19, including the frequency of responses and, when appropriate, using the mean of responses to rank-order items.
Survey Results
Who took the survey?
We asked participants a variety of demographic questions, including their age, race, and ethnicity, relationship status, and educational attainment. The average age of participants was 60.5 years. A small number of participants identified as Hispanic or Latino (3.8%), while the majority of participants identifying as white (97.2%). Most participants were married (83.6%). Finally, most often participants reported a bachelor’s degree as their highest level of educational attainment (31.8%).
When do they think they started menopause, and how did they feel about it?
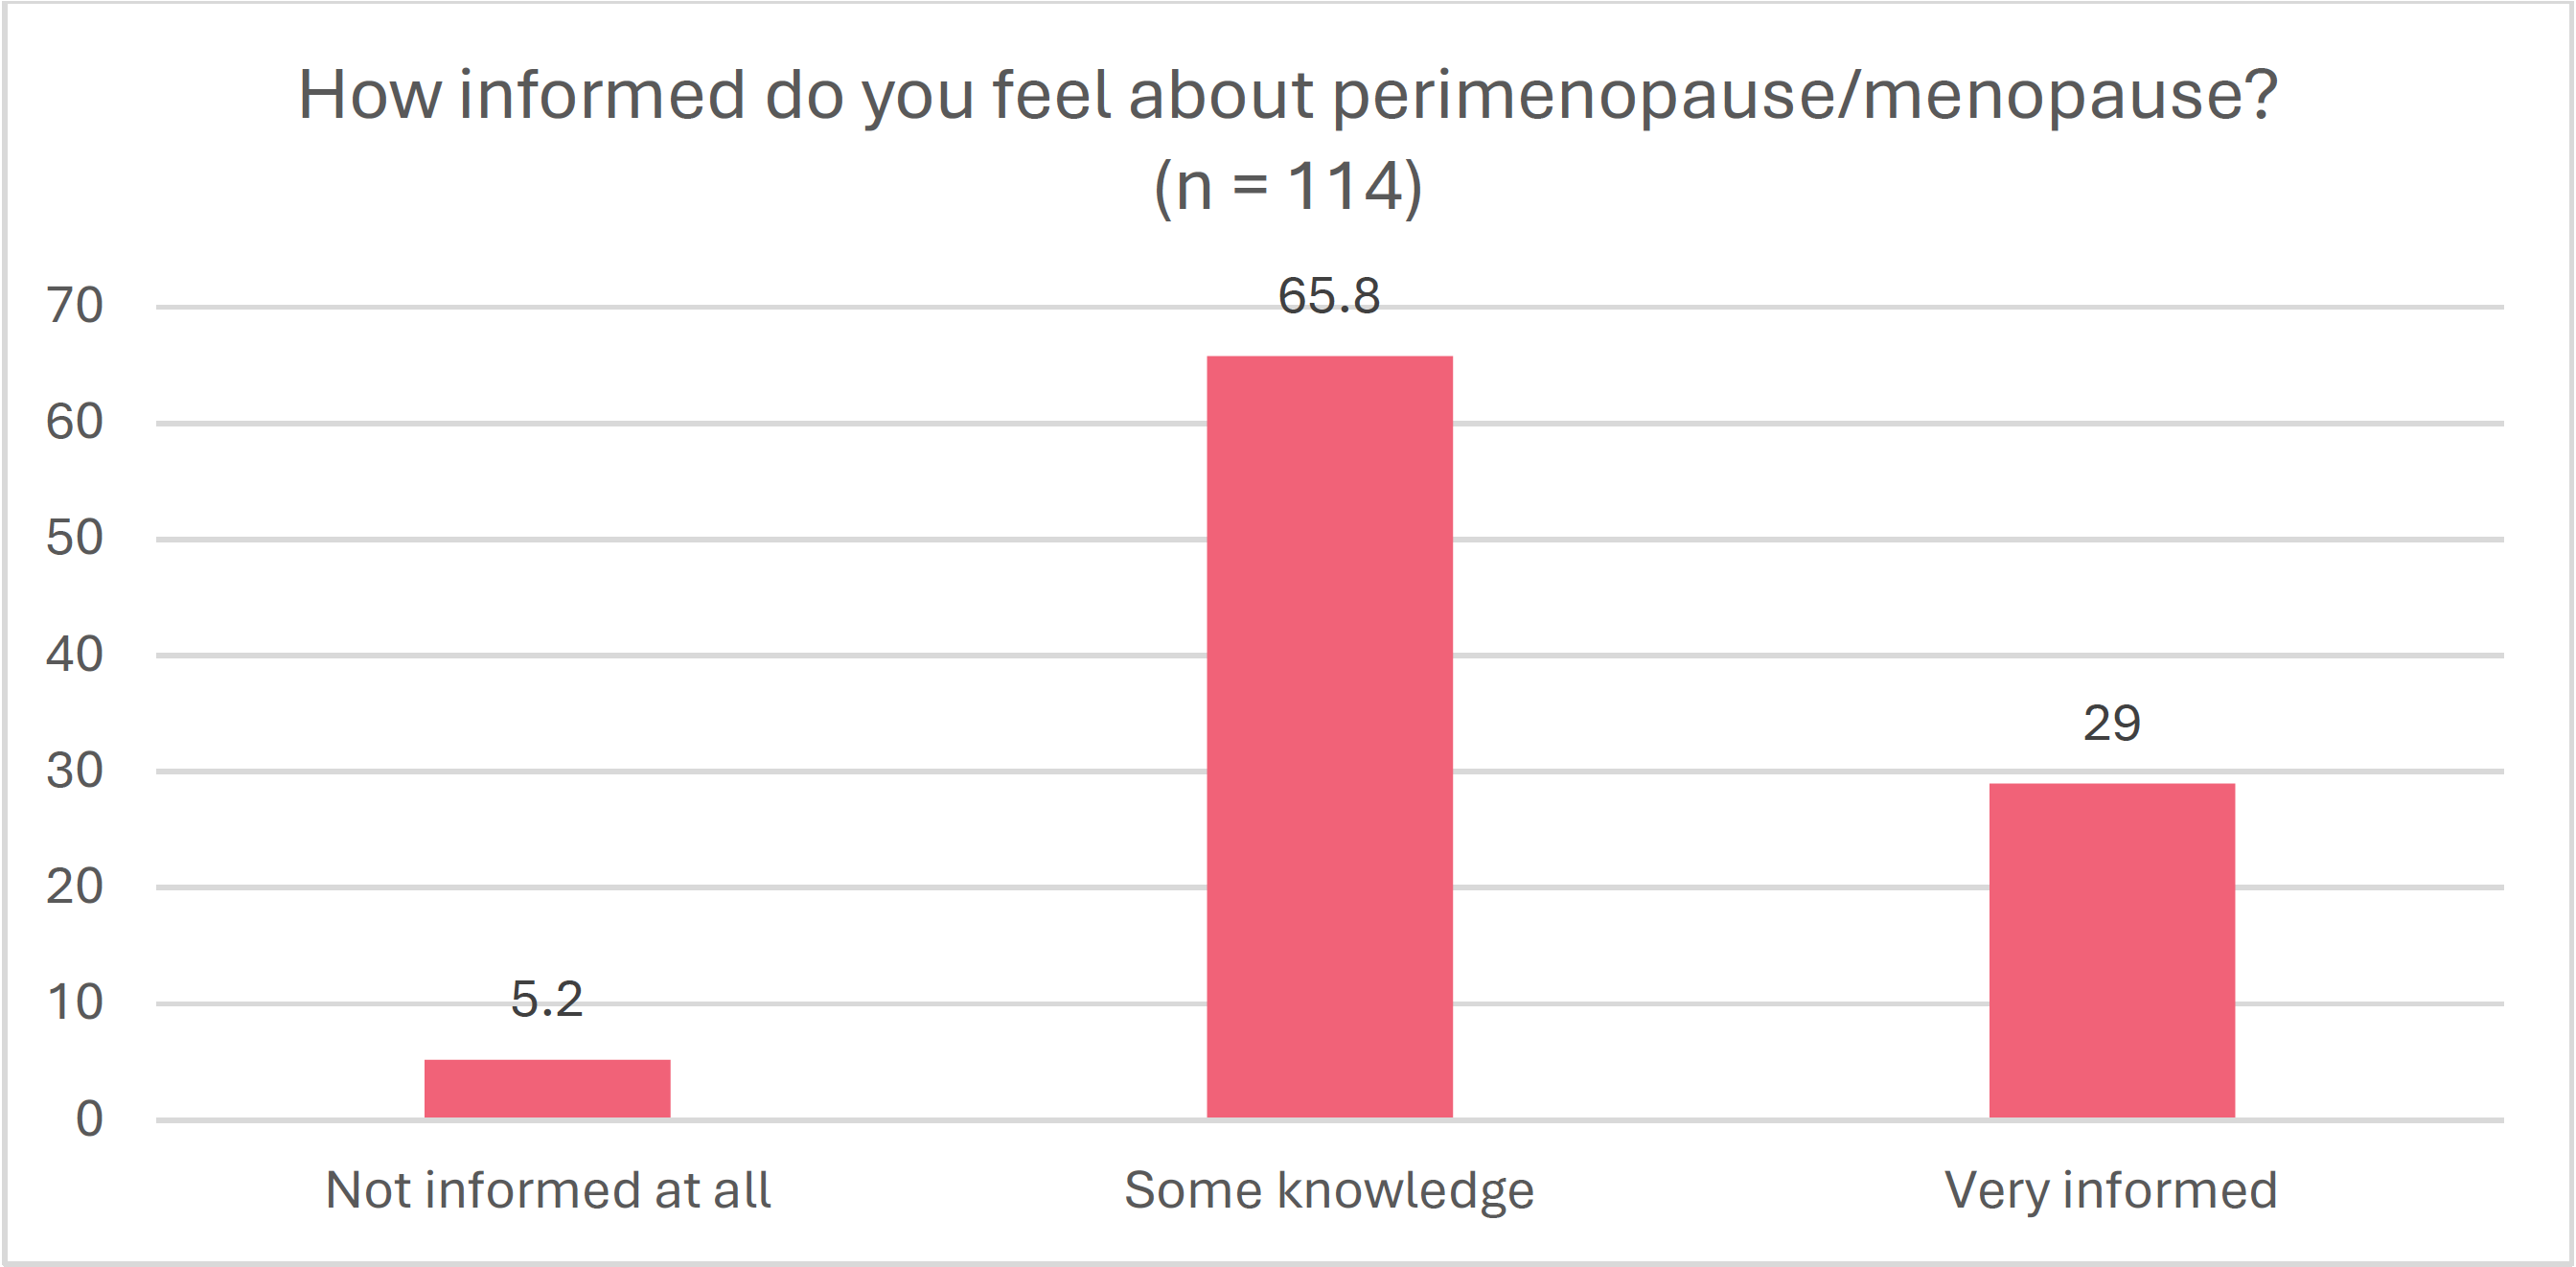
A majority of participants (61.4%) reported being between the ages of 40 and 49 years old when they first began thinking about perimenopause/menopause. On average, the age of menopause onset was 47.5 (n = 109, range 26–57) (Figure 1). Figure 2 shows that the majority (64.8%) of participants had some knowledge about perimenopause/menopause. Additionally, most participants (79.8%) looked for information about perimenopause/menopause at some point.
Figure 1. Average Age of Menopause Onset

Figure 2. Participants’ Level of Being Informed About Perimenopause/Menopause (%)

medical providers as one of the
most trusted information sources.
Most often, participants reported that before going through menopause, they felt neutral or no strong opinion (39.1%) about going through menopause. On the other hand, after going through menopause, most often (31.8%) women felt relieved and saw it as a new chapter without menstrual cycles.
What were women's sources of information?
Participants were asked to identify which sources of information on perimenopause/menopause they used. Table 1 shows that the most frequently used sources included discussions with medical professions and that people/friends are a key source of information for women in Utah. We also asked participants to rank sources of information about perimenopause/menopause from 1 (most trusted) to 12 (least trusted) and found that formal sources (e.g., medical providers, websites) were the most trusted.
Table 1. Sources Most Used and Trusted to Learn About Perimenopause/Menopause
| Order/Rank | Most used resources to learn about perimenopause/menopause |
Most trusted resources to learn about perimenopause/menopause |
|---|---|---|
| 1st | Medical/health professional (86.8%) | Medical/health professional |
| 2nd | Friends (86.4%) | Formal websites |
| 3rd | Hearing discussions (80.5%) | Scientific literature |
| 4th | Formal websites (77.3%) | Books |
| 5th | Family (63.5%) | Informal websites |
Inversely, Table 2 shows the least frequently used sources, including print media and visual media. The least trusted sources were similar to the least used, with print media and visual media being ranked the lowest.
Table 2. Sources Least Used and Trusted to Learn About Perimenopause/Menopause
| Order/Rank | Least used resources to learn about perimenopause/menopause |
Least trusted resources to learn about perimenopause/menopause |
|---|---|---|
| 1st | Newspaper (10.7%) | Newspapers |
| 2nd | Films/TV programs/Documentaries (16.7%) | Social media |
| 3rd | YouTube (18.8%) | Films/TV programs/Documentaries |
| 4th | Magazines (31.8%) | YouTube |
| 5th | Social media (42.1%) | Magazines |
What symptoms did Utahns experience?
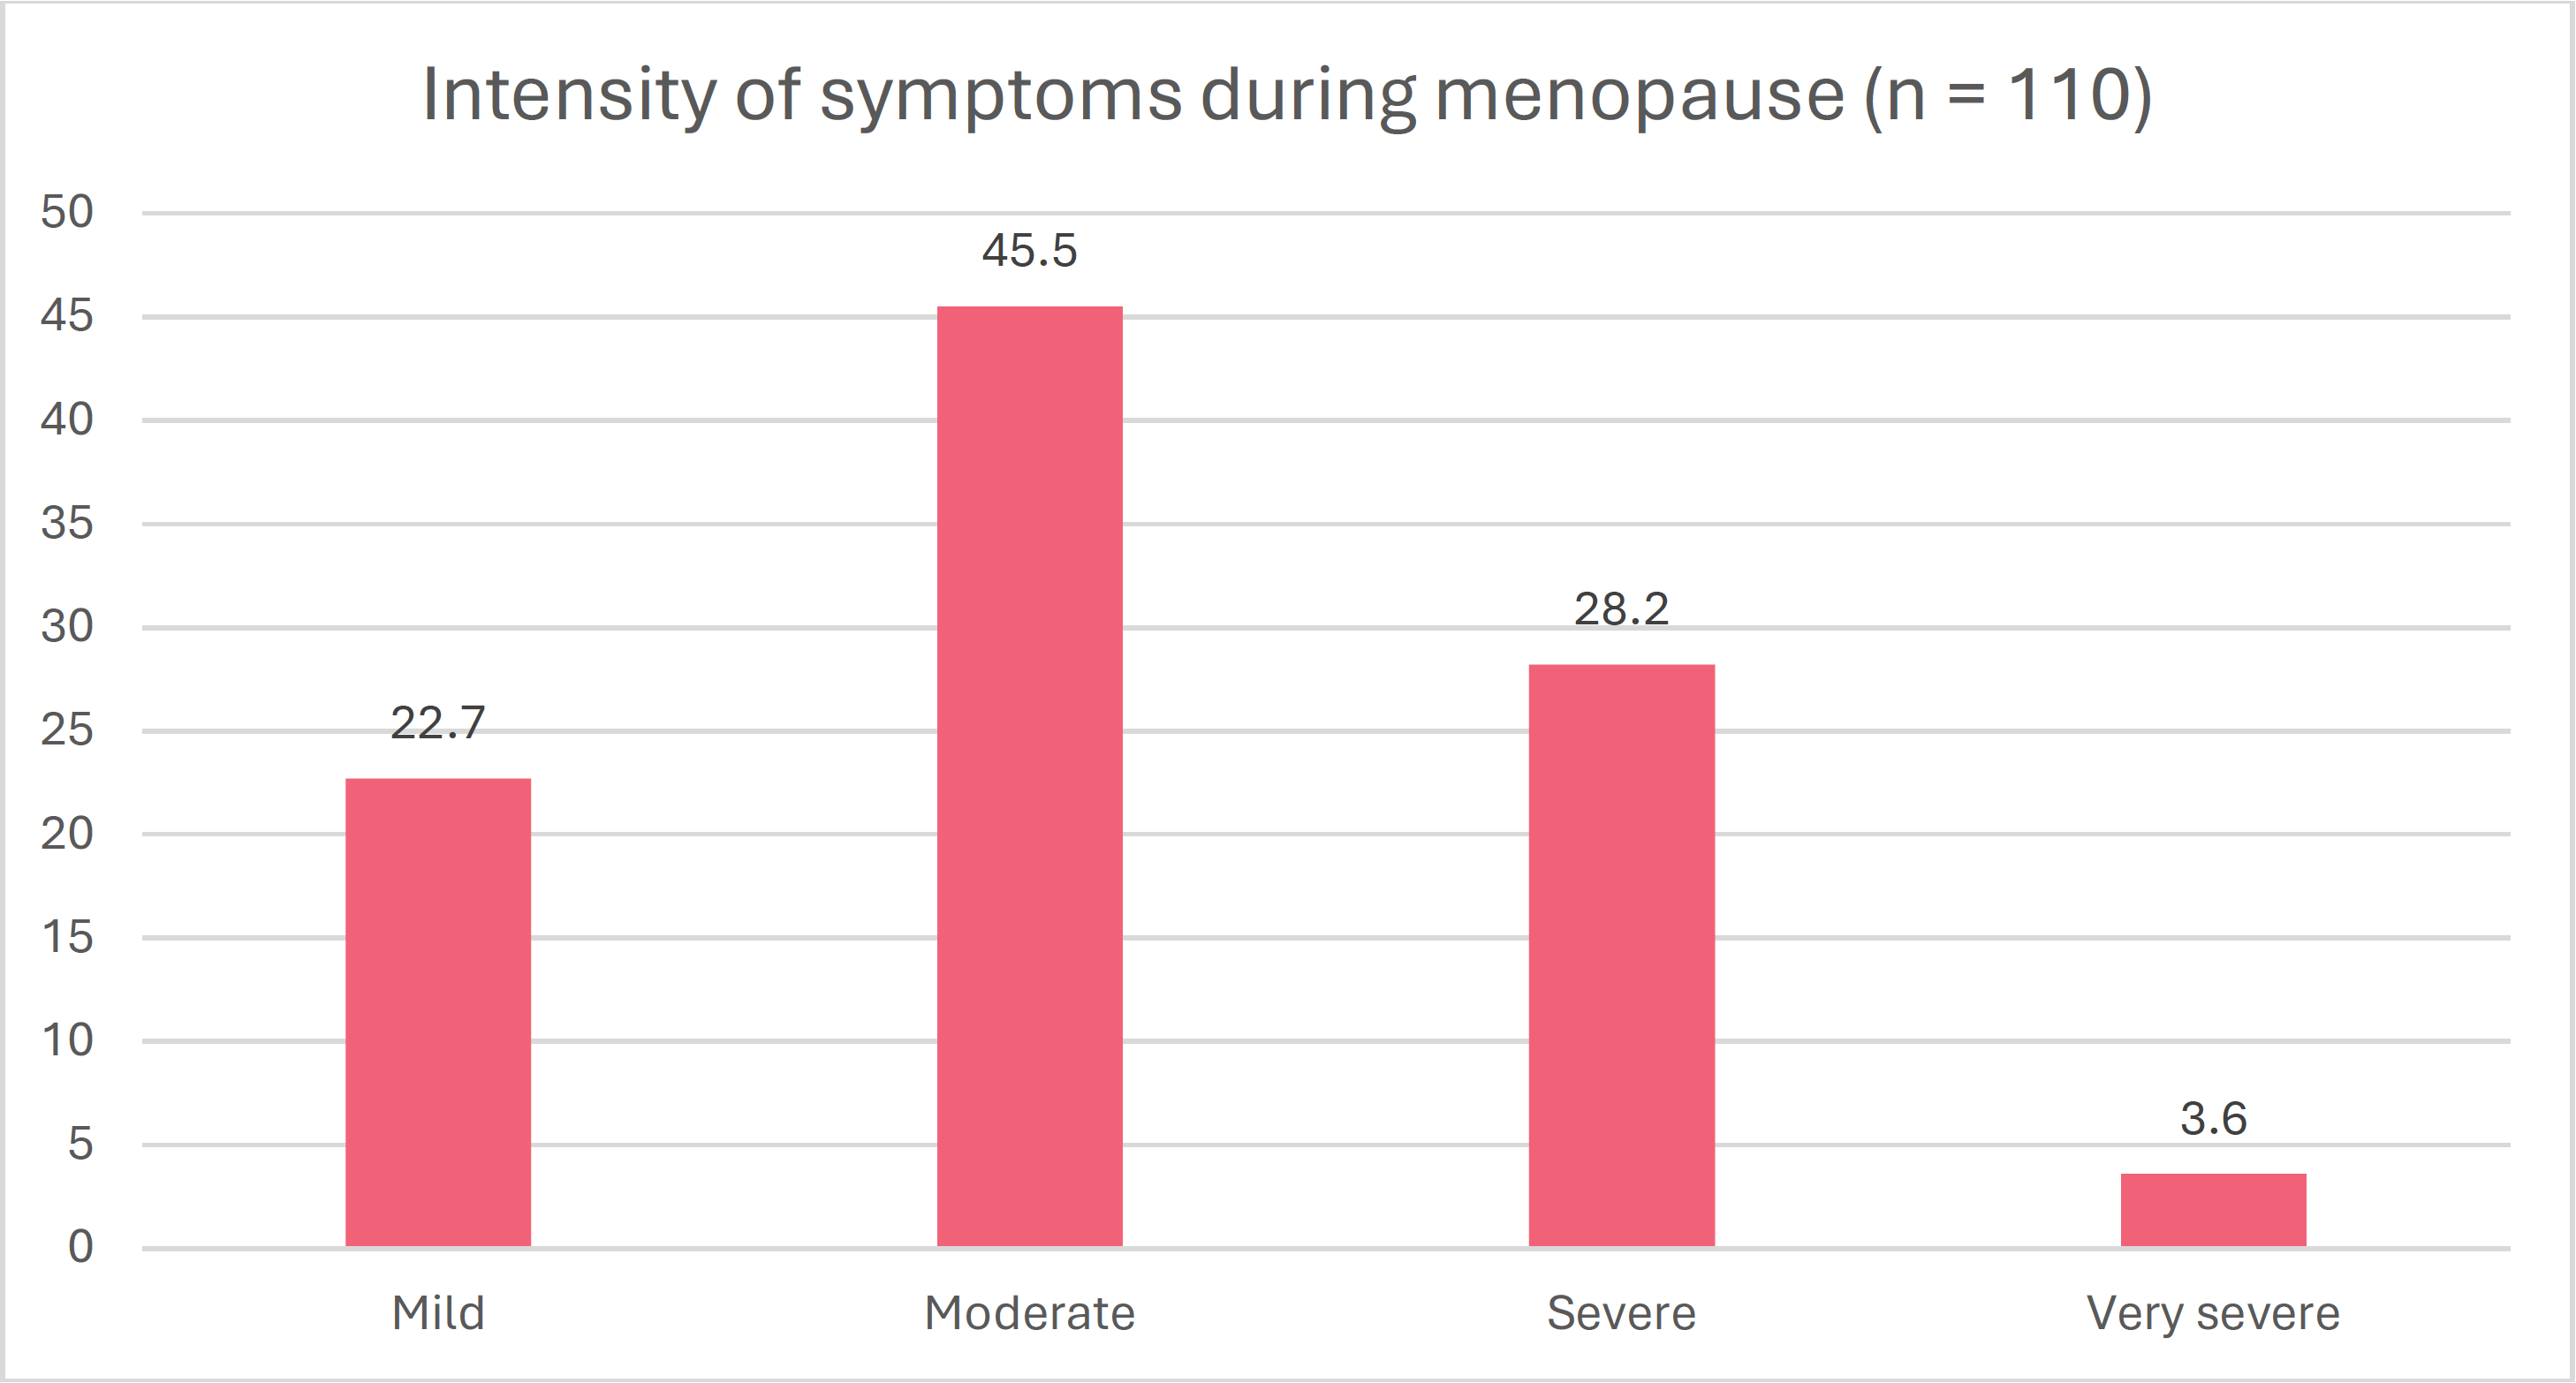
Participants reported that most often, their symptoms were moderate (45.5%; see Figure 3). From a list of 15 possible symptoms, Table 3 shows the symptoms experienced most often in order of most to least experienced across the sample. The three most frequently experienced symptoms were hot flashes (88.9%), feeling tired or lack of energy (86.8%), and difficulty sleeping (82.1%).
Table 3. Reported Symptoms, From Most to Least Experienced
| Order | Symptom |
|---|---|
| 1 | Hot flashes/sweating at night (88.9%) |
| 2 | Feeling tired or lack of energy (86.8%) |
| 3 | Difficulty sleeping (82.1%) |
| 4 | Irritability (74.1%) |
| 5 | Vaginal dryness (73.6%) |
| 6 | Loss of interest in sex (71.7%) |
| 7 | Feeling tense or nervous (68.3%) |
| 8 | Difficulty in concentrating (64.7%) |
| 9 | Memory problems (62.8%) |
| 10 | Muscle and joint pain (57.7%) |
| 11 | Feeling unhappy or depressed (53.9%) |
| 12 | Heart beating quickly or strongly (52.4%) |
| 13 | Anxiety or panic attacks (49.0%) |
| 14 | Urinary symptoms (37.1%) |
| 15 | Feeling dizzy or faint (31.1%) |
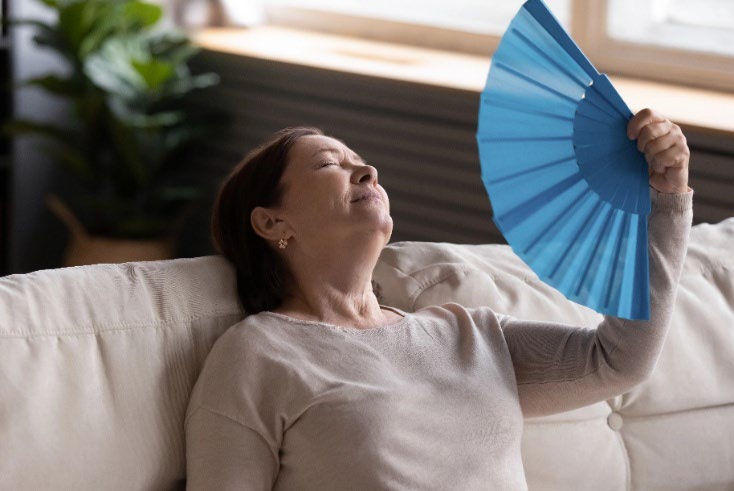
Figure 3. Intensity of Participants’ Reported Symptoms (%)
What supports and methods were used to manage symptoms?
Participants were asked to identify the information they looked for or discussed with others. The most frequent topics included symptoms and basics of perimenopause/menopause and hormone replacement therapy. Top methods used to alleviate symptoms were a combination of lifestyle and medical interventions (Table 4).
Table 4. Information Sought and Most Frequent Methods Used to Alleviate Perimenopause/Menopause Symptoms
| Order/Rank | Information sought | Mitigation methods most used |
|---|---|---|
| 1 | Symptoms of perimenopause/menopause (87) | Exercise (63) |
| 2 | Hormone replacement therapy (72) | Hormone replacement therapy (61) |
| 3 | Basics on perimenopause/menopause (71) | Nutritional changes (35) |
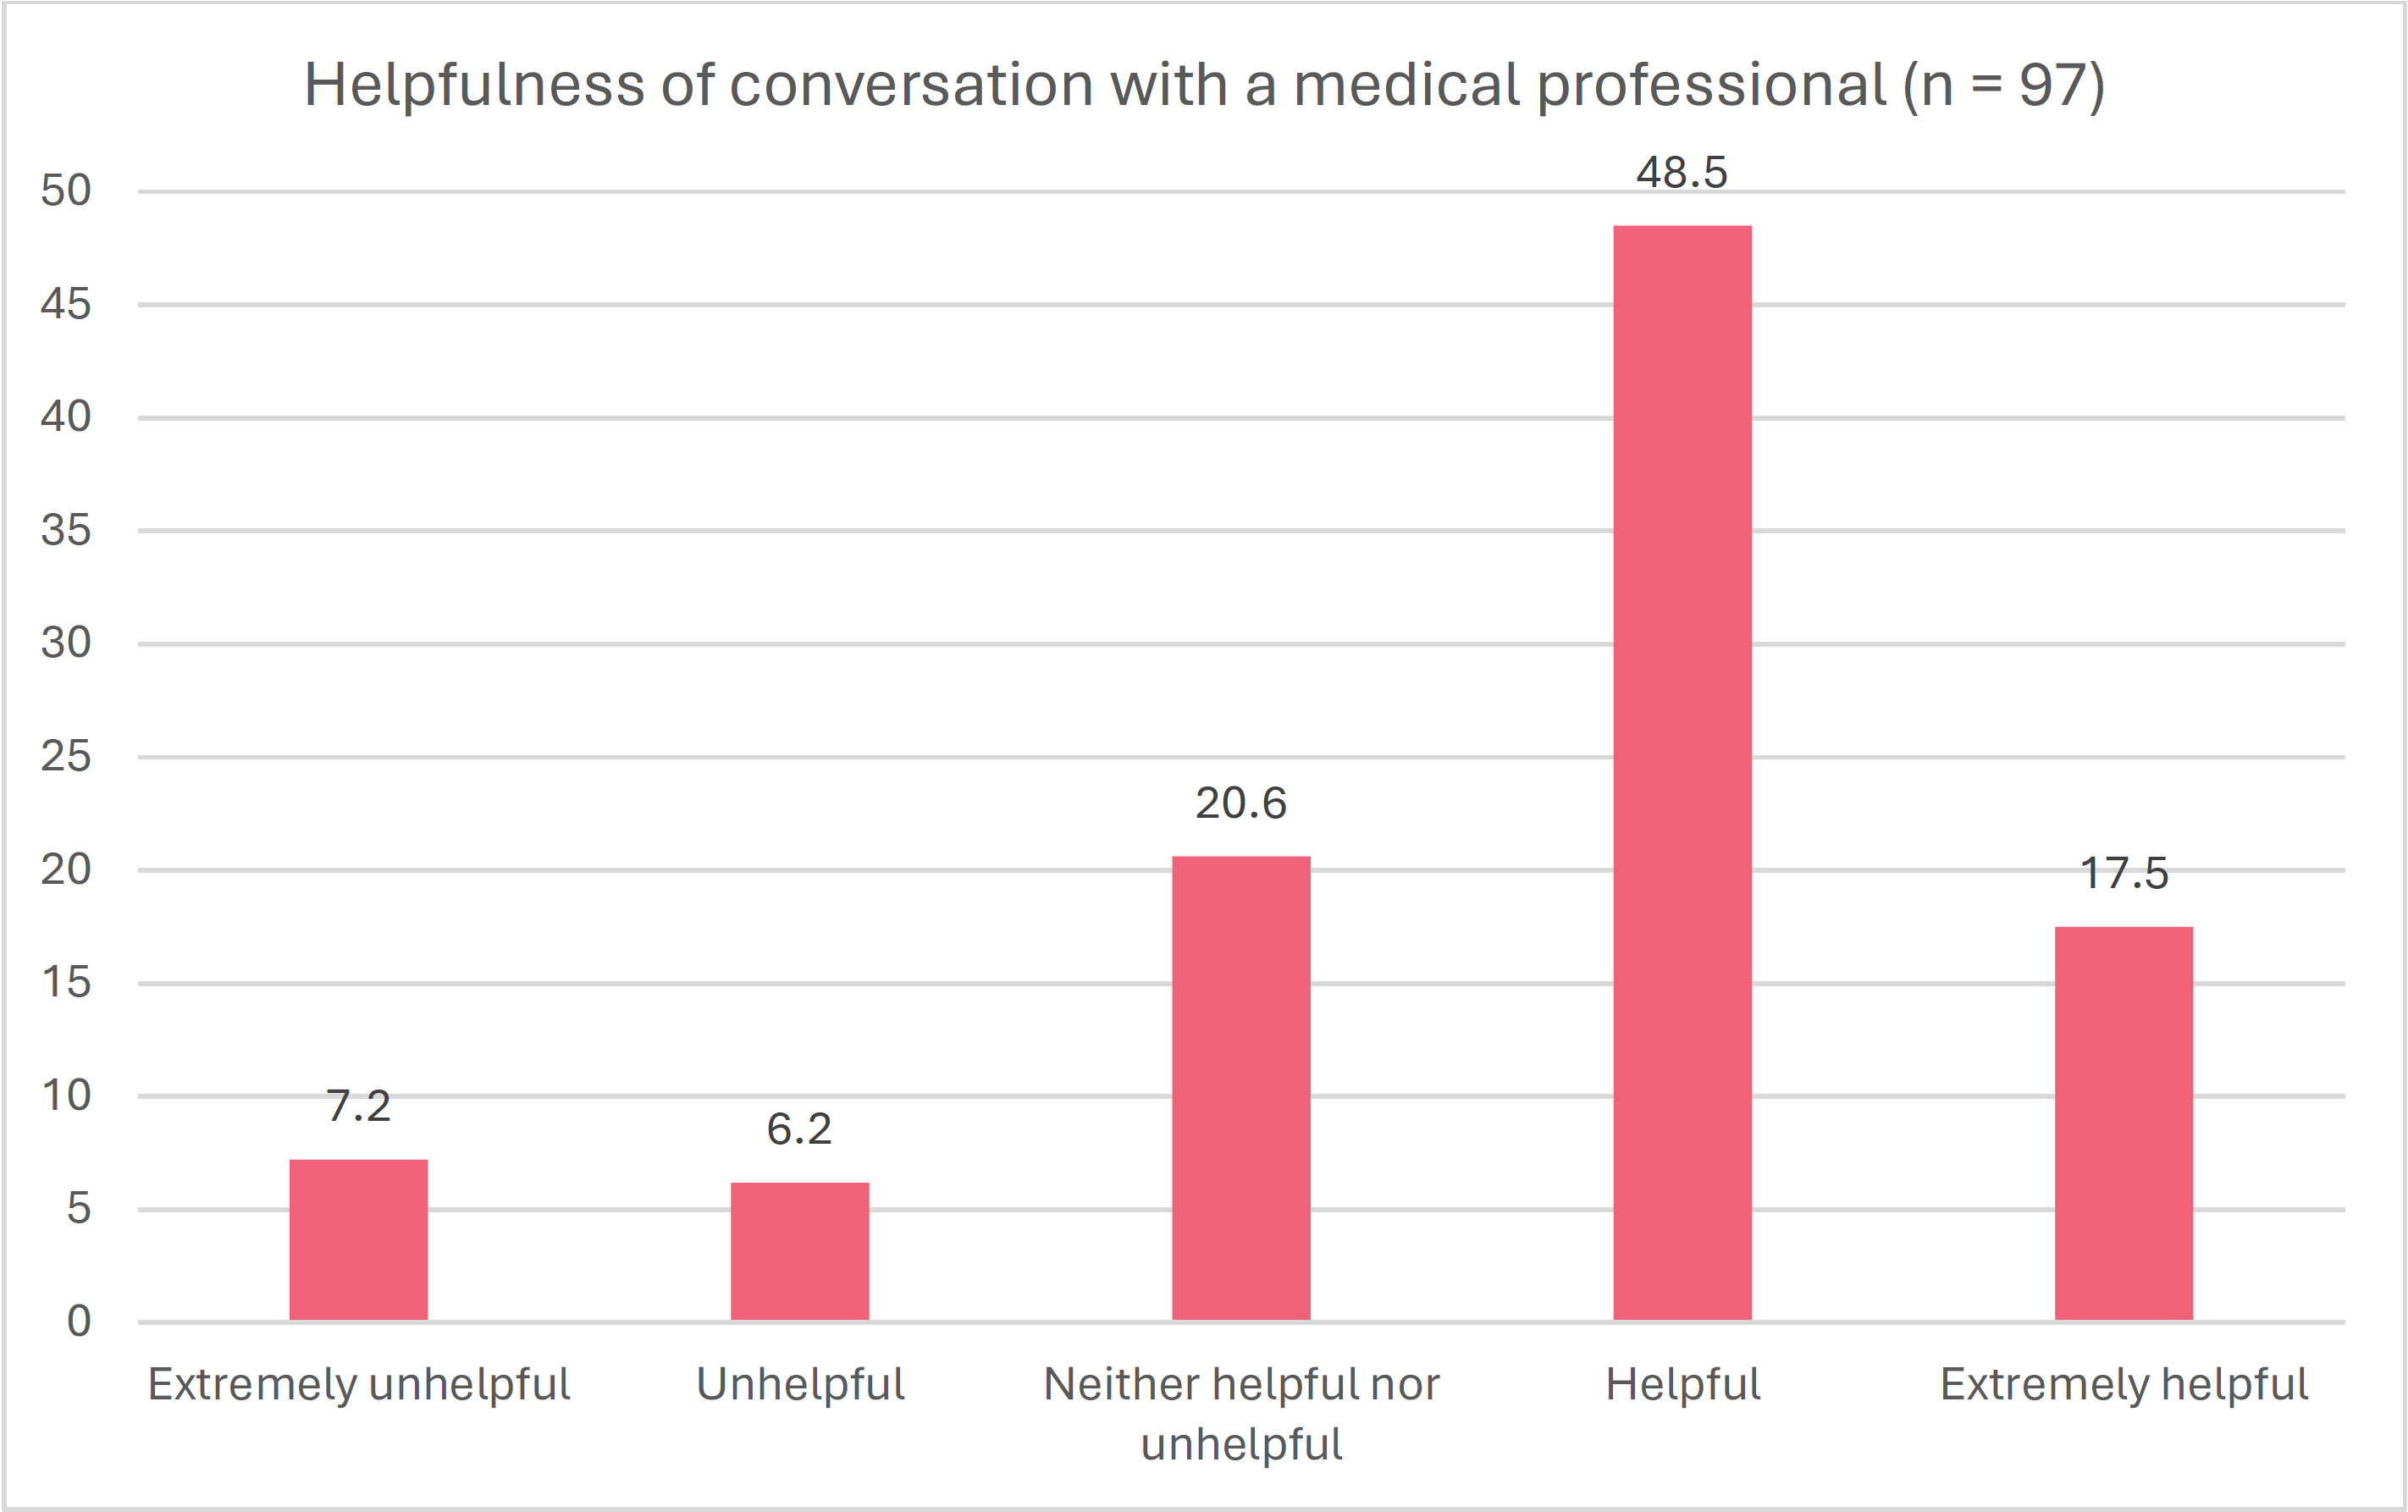
A majority of participants (85.1%) reported seeking out a medical or health professional about perimenopause or menopause. Responses most often (48.25%) found the conversations helpful (see Figure 4), and in a follow-up conversation, 54.2% said that a medical professional fully answered their questions.
Figure 4. Participant-Reported Medical Professional Helpfulness (%)
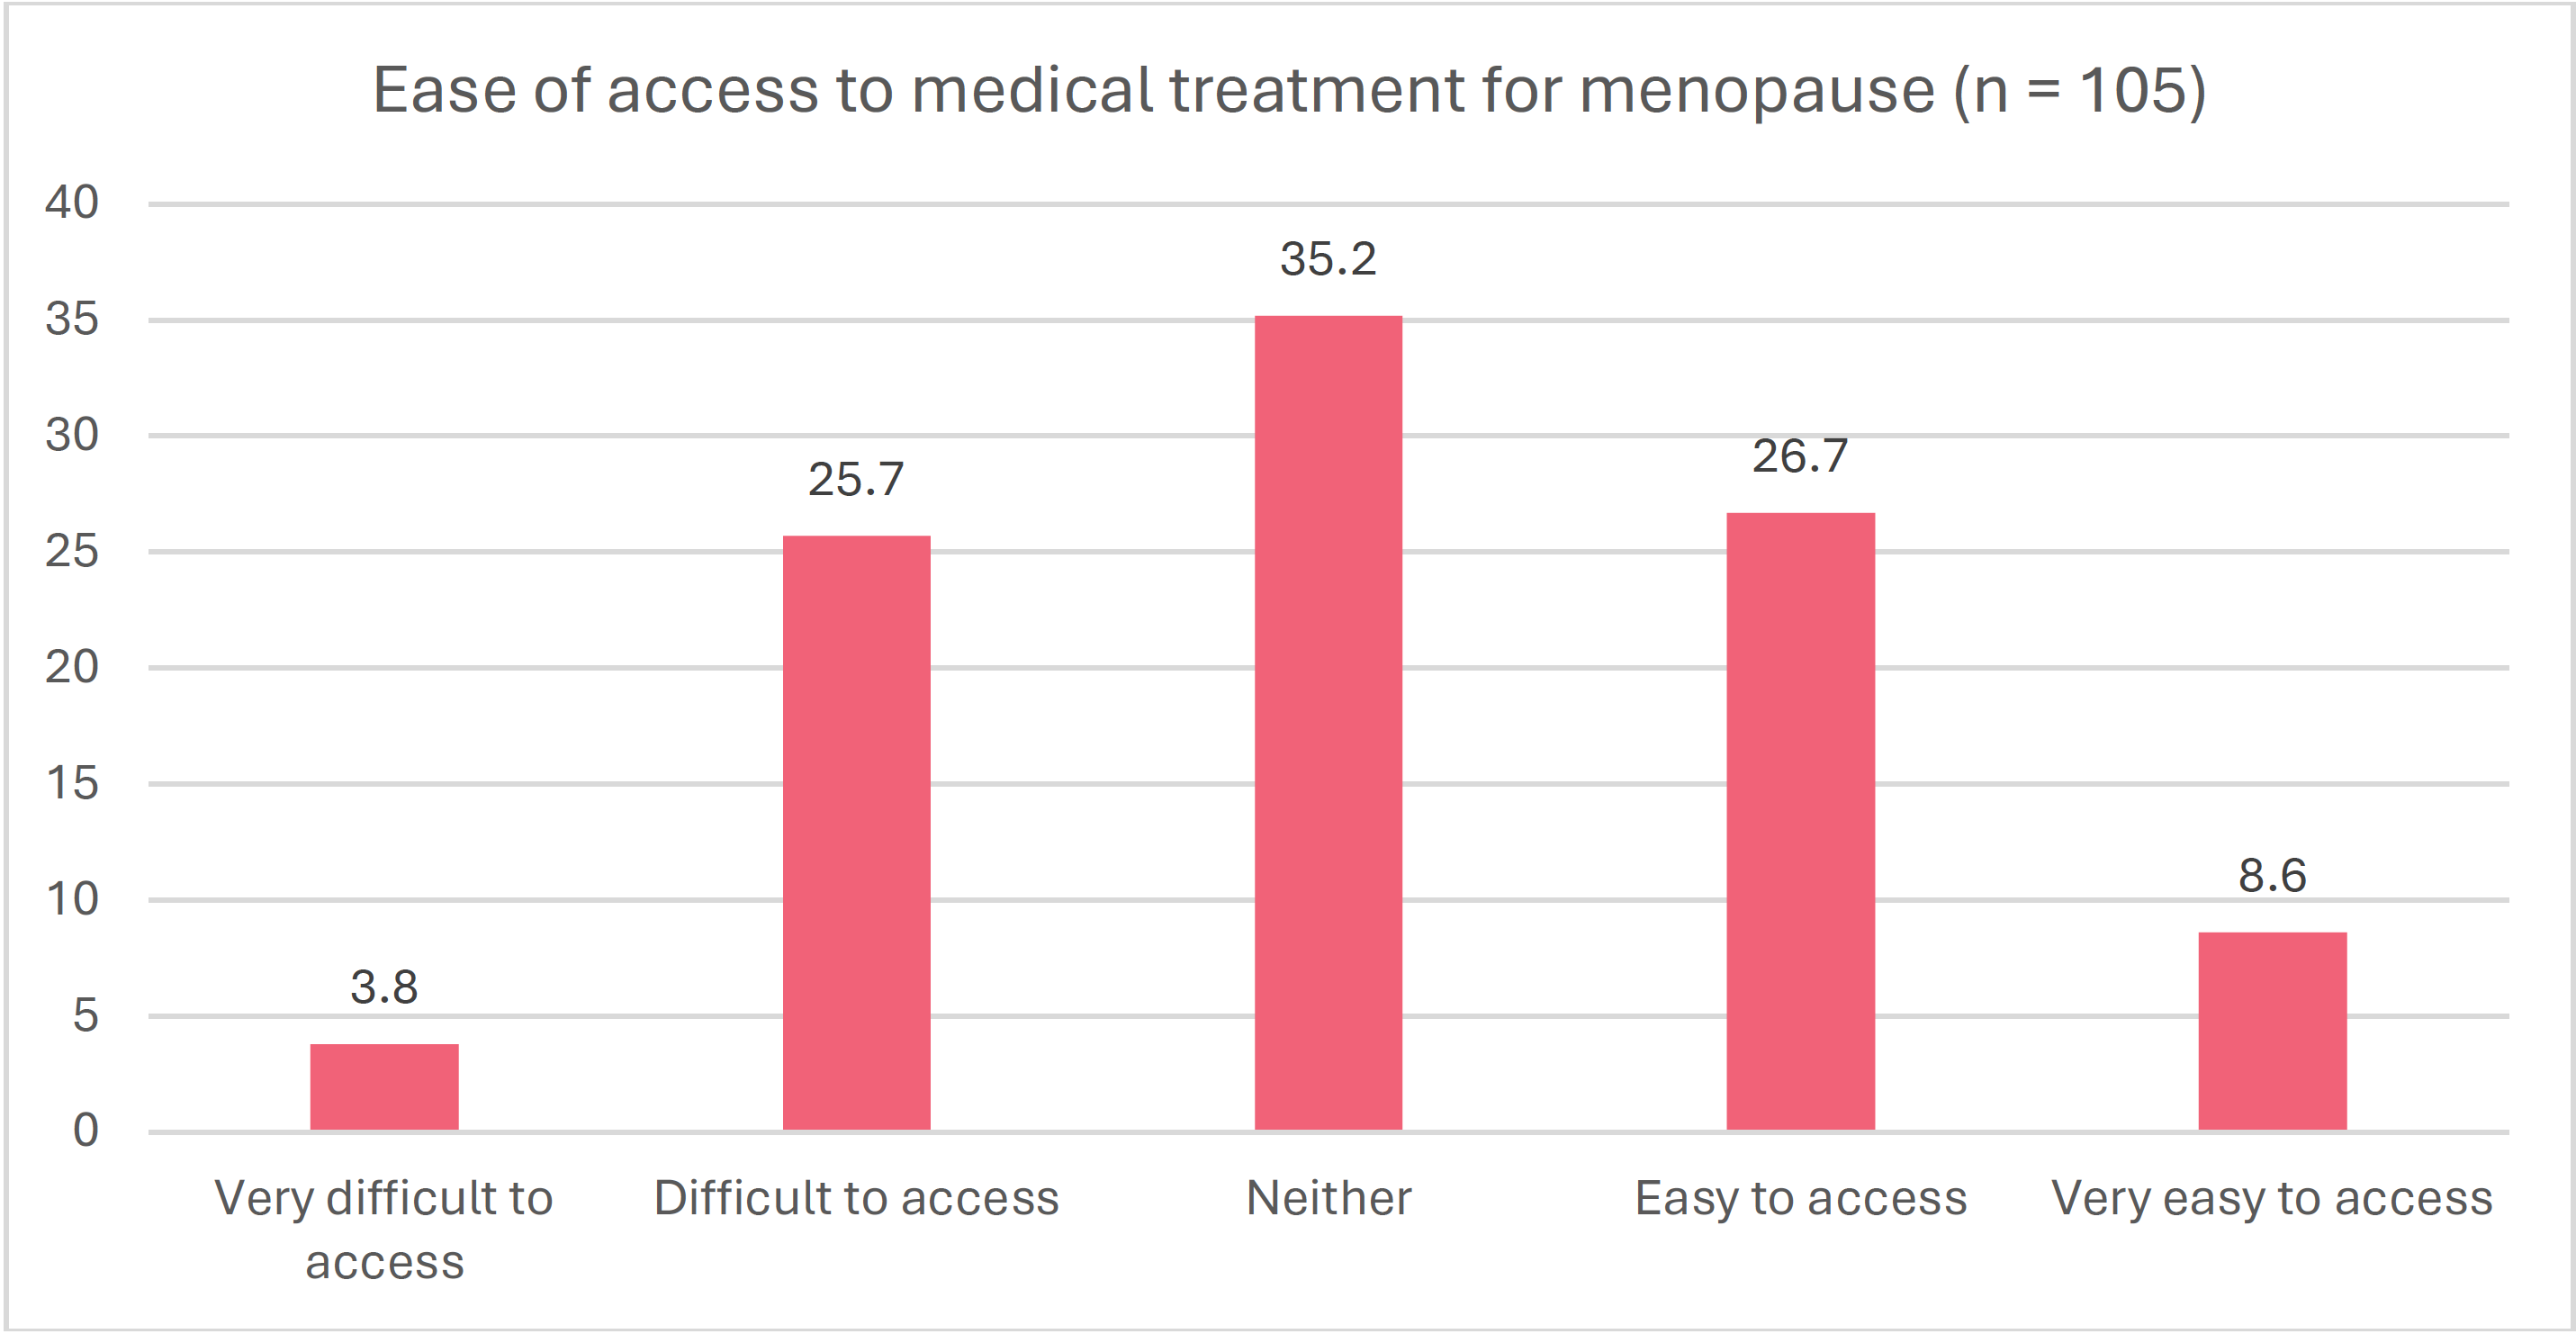
Participants most often reported that medical treatment and support for perimenopause/menopause were neither difficult nor easy to access (35.2%). As Figure 5 shows, responses varied greatly, suggesting participants’ accessibility greatly differed.
Figure 5. Reported Ease of Access to Medical Treatment for Perimenopause/Menopause
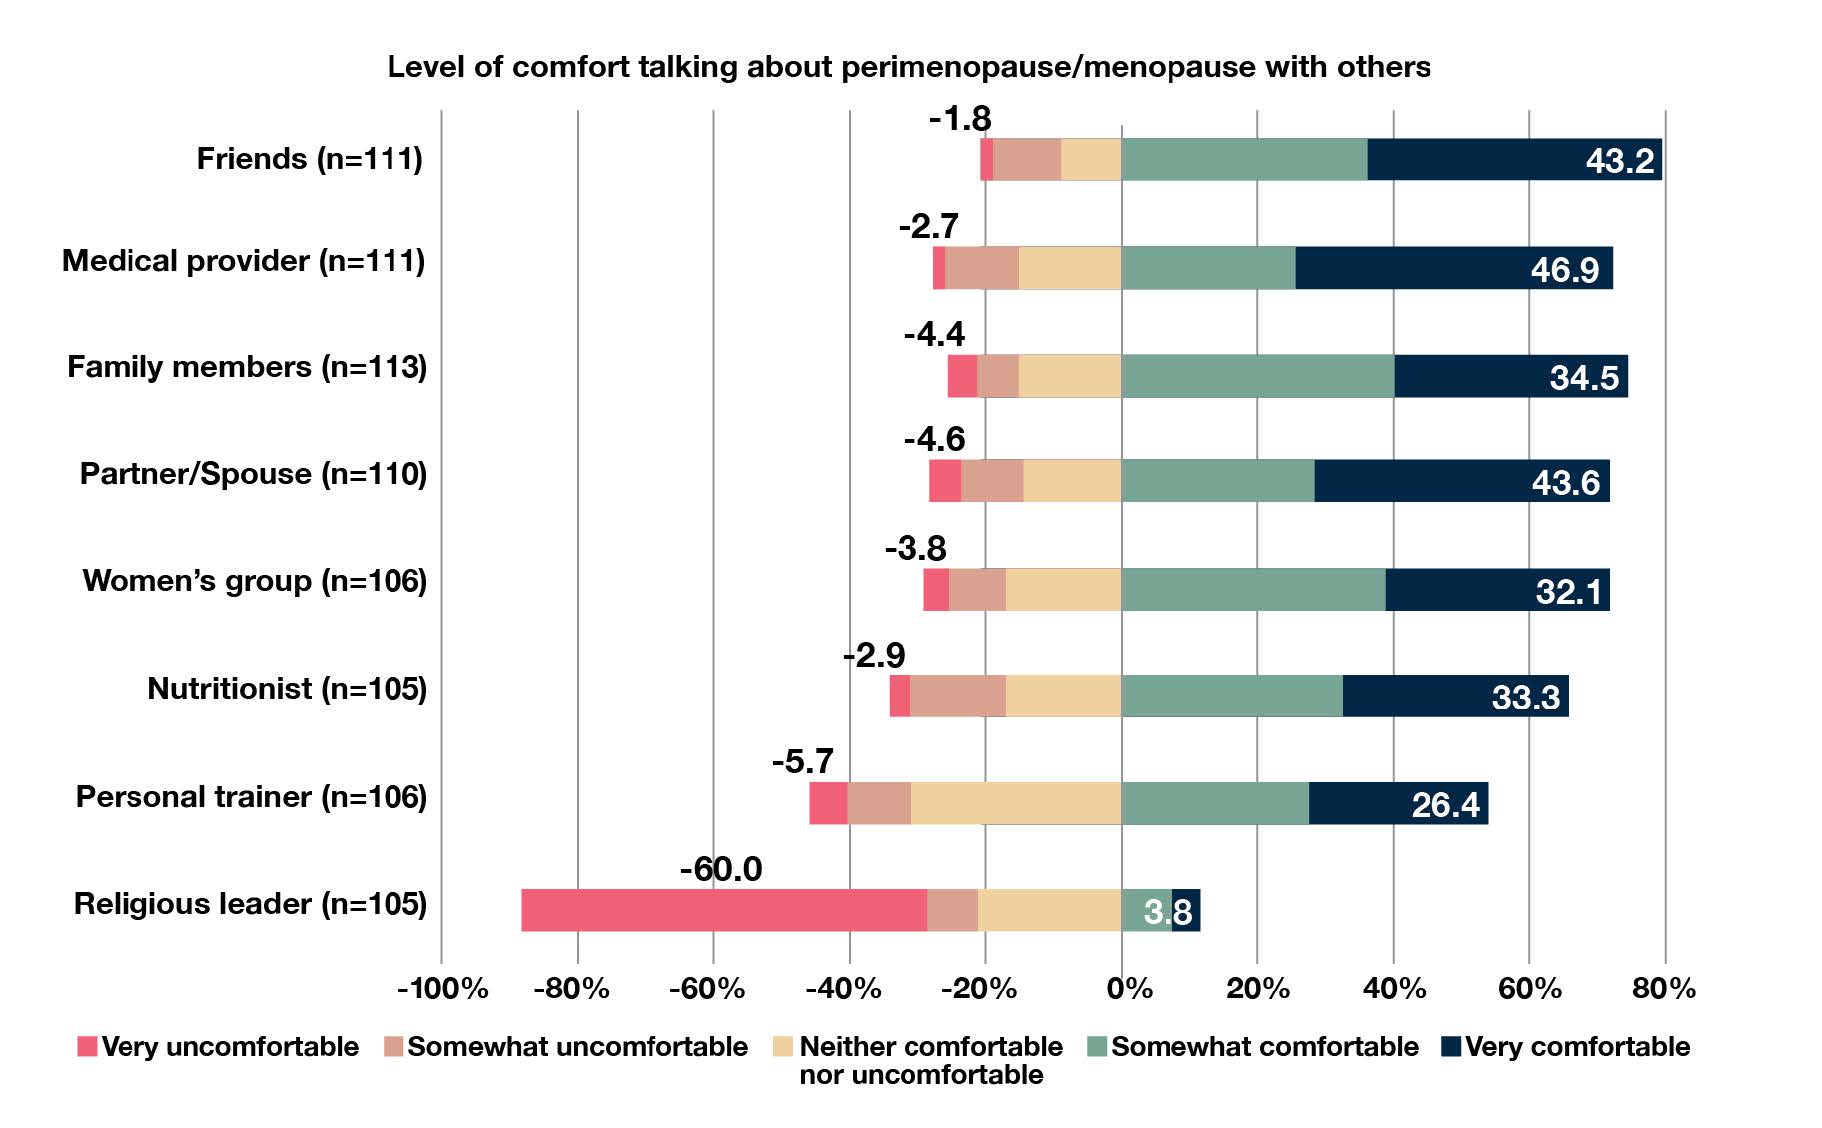
Finally, when asked who the participants were most comfortable talking to about perimenopause/menopause, they reported medical providers were the most comfortable source of support. Figure 6 shows that participants were most comfortable talking with medical providers, friends, and family members.
Figure 6. Supports Participants Felt Most Comfortable With (dark blue) to Discuss Perimenopause/Menopause (%)
Acknowledgments
The authors gratefully acknowledge the following contributors from USU Extension:
- Emma Parkhurst
- Naomi Brower
- Andrea Schmutz
- Stephanie Carlson
- Sadie Wilde
- Elizabeth Davis
The authors of this content used ChatGPT to improve writing clarity and flow. The tool was not used to identify sources, generate ideas, or interpret findings. Authors reviewed and edited the content provided by the AI tool, and they take full responsibility for the content.
References
July 2026
Utah State University Extension
Authors
Cris Meier, Moth Huenemann, Cara Murray, and Ashley Yaugher

Cris Meier
Community Resource and Economic Development Specialist
Social Work

Cara Murray
Professional Practice Extension Assistant Professor | Health and Wellness | 4-H | Uintah County Director
Home and Community
Ashley Yaugher
Professional Practice Extension Associate Professor | Health and Wellness | HEART Initiative | Carbon & Emery Counties
Home and Community Department
Related Research