Predicting Current and Future Alfalfa Hay Prices in Seven Western States
Alfalfa hay is the dominant crop in several western states, yet market price reporting is almost nonexistent in some states. While alfalfa is one of the top-valued crops in Arizona, Nevada, and Utah, the U.S. Department of Agriculture (USDA) Agricultural Marketing Service (AMS) does not provide a weekly Direct Hay Market Report for these states. Even in California, Idaho, Oregon, and Washington, where a weekly market report is provided, prices may be unreported due to a lack of sales. This can result in long periods where either no price is reported or the reported price remains unchanged. For example, the monthly USDA National Agricultural Statistics Service (NASS) Agricultural Prices Report lists the same price for 3, 4, and even 5 months on multiple occasions in the last 10 years for these seven western states.
There is no futures market for alfalfa hay, and with no or limited price reporting of alfalfa sales, producers may not know what current hay prices are in their area, and knowing what prices may be in the future is even a greater unknown. This fact sheet has three objectives: (1) Compare alfalfa hay prices across the seven western states; (2) Determine what observable factors influence alfalfa hay prices; and (3) Introduce a simple, user-friendly, web-based alfalfa hay pricing tool that can be used for current price information and price forecasts up to 9 months into the future.
Hay Prices Across the Seven Western States
Monthly alfalfa prices for the last 10 years, 2013–2022, for each of the seven western states of Arizona, California, Idaho, Nevada, Oregon, Utah, and Washington, were obtained from the USDA-NASS Agricultural Prices reports and are plotted in Figure 1. It appears that prices, in the long run, respond to the same general supply and demand forces; prices all seem to be relatively higher or lower in the same time periods. However, in shorter month-to-month time periods, one state’s hay prices may move higher while another state’s hay prices may move lower. Statistically, Utah alfalfa hay prices are most closely correlated with Oregon and Washington alfalfa hay prices (Table 1). This implies that if Oregon or Washington hay prices move higher/lower, Utah hay prices would also be expected to move higher/lower. Over the 10-year period of analysis, Utah hay prices were $14 per ton lower than Washington hay prices. However, the two states' alfalfa hay prices have been statistically equal in the last 3 years (Table 1).
While Utah doesn’t have a weekly hay market report provided by USDA-AMS, Idaho, Oregon, and Washington all do: Hay reports. By observing these reports, Utah producers should have a better idea of Utah hay prices.
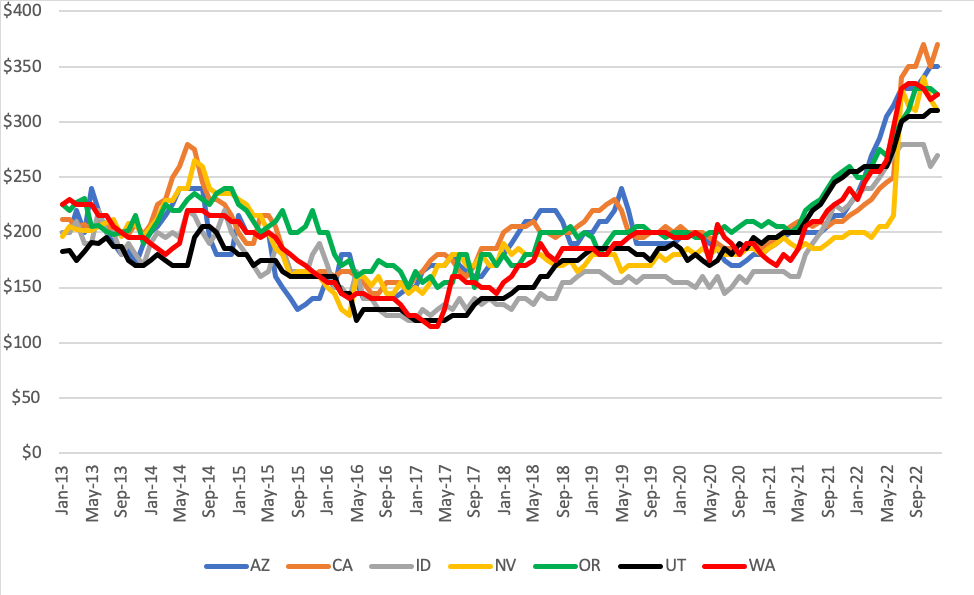
Table 1.
Average Alfalfa Hay Prices Across Seven Western States ($/ton) and Utah Hay Price Correlation With the Other Western State’s Hay Prices
| Years or correlation | AZ | CA | ID | NV | OR | UT | WA |
|---|---|---|---|---|---|---|---|
| 2013–22 | $199.83 | $206.32 | $177.42 | $194.89 | $210.65 | $183.41 | $197.86 |
| 2020–22 | $231.53 | $230.69 | $202.22 | $211.53 | $240.14 | $228.33 | $228.81 |
| UT correlation | 0.84 | 0.81 | 0.89 | 0.74 | 0.94 | 1.00 | 0.93 |
Factors Influencing Alfalfa Hay Prices
Oftentimes, commodity prices are related to one another and may move in similar or opposite directions. If one can understand these price relationships and if these prices are readily observable, then by following these other prices, a producer can better understand the likely direction of alfalfa hay prices in their area.
In the Western U.S., most alfalfa hay is fed to dairy cows, beef cattle, and calves. Generally, it is the case that higher milk prices and higher cattle prices tend to support higher hay prices. Corn is the dominant feed grain in the U.S.; other feed sources often follow corn prices. So, when corn prices are higher, hay prices may also be higher, and when corn prices are lower, then hay prices may also be lower.
Utah and other western states have exported more alfalfa hay in the last several years. The amount of hay exported for Utah has varied between 10% and 20% of production. Increased exports should also support higher hay prices.
The USDA also reports the amount of hay on hand at the beginning of the new hay marketing year (the hay market year is May 1 to April 30). This is known as the Crop Production Report, often referred to the May 1 Stocks Report. If there were a larger stock of hay on hand on May 1, we would typically expect to see lower hay prices, and if May 1 stocks were lower, we would expect higher hay prices.
Two regression models estimate the impact of the abovementioned factors on alfalfa prices: an annual model and a monthly model.
Annual Model
The annual model results are displayed in Table 2. This model explained 94% of the annual alfalfa hay price variability from 1992–2021 for the average price of the seven western states. This model is better at explaining why alfalfa hay prices moved higher or lower than it is at predicting how alfalfa hay prices will change in the future. While you can observe price changes in Corn, Milk, and Feeder Cattle futures, export data is often unavailable for 3 to 4 months after the exports happened, and May 1 stocks are only reported once per year. For example, you may observe Corn futures prices are $1 per bushel higher than the prior year and expect alfalfa hay prices to be about $12 per ton higher. However, if you later learn that alfalfa hay exports were down by 600,000 metric tons for the year, then that would be expected to decrease hay prices by about $6 per ton. So, on the net, perhaps hay prices would only be about $6 per ton higher.
Table 2.
Change in 7-State Average Annual Alfalfa Hay Price ($/ton) Explained by a Unit Change in Each Variable for 1992–2021
| Variable | Unit Change | $/Ton alfalfa |
|---|---|---|
| 7-State May stocks | 100,000-ton increase | -$1.67 |
| Alfalfa hay exports | 100,000 metric ton increase | +$1.08 |
| Corn futures | $1/bushel increase | +$12.38 |
| Class III Milk futures | $1/cwt. increase | +$3.04 |
| Feeder Cattle futures | $1/cwt. increase | +$0.43 |
Note.Corn Futures, Class III Milk Futures, and Feeder Cattle Futures are all traded on the CME Group exchange.
Monthly Model
The monthly model results are displayed in Table 3. The model explained 73% percent of the variability in the seven-state average monthly hay prices for 2013 to 2022. Compared to the annual model, Corn futures prices had a slightly more significant impact on alfalfa hay prices, and Milk and Feeder Cattle futures prices had a slightly smaller impact on hay prices. Exports were not included in this model.
Table 3.
The Change in 7-State Average Monthly Alfalfa Hay Price ($/ton) Explained by a Unit Change in Each Variable for 2013–2022
| Variable | Unit Change | $/Ton alfalfa |
|---|---|---|
| 7-State May stocks | 100,000-ton increase | -$2.84 |
| Corn futures | $1/bushel increase | +$16.49 |
| Class III Milk futures | $1/cwt. increase | +$1.80 |
| Feeder Cattle futures | $1/cwt. increase | +$0.37 |
Forecasting Alfalfa Hay Prices
Explaining current or past prices is one thing, but what about predicting or forecasting future prices? Alfalfa hay prices tend to be quite sticky; the price may not change for 2, 3, or even 4 months. During some periods of the year, these static prices result from very little hay being sold. One forecast method, naïve forecasting, uses the last period’s price to forecast the next period’s price. More sophisticated forecast models typically forecast prices more accurately than naïve forecasting. However, if you are only interested in forecasting alfalfa hay prices 1 month into the future, naïve forecasting is best; in other words, the best predictor of next month’s alfalfa hay price is this month’s alfalfa hay price.
Example
If it is currently June, and Corn futures for December were $0.50/bushel higher than in June, and Milk futures for December were $2.00/cwt. higher than in June, and Feeder Cattle futures for December were $3.00/cwt. lower than in June, then using the 16.49, 1.80, and 0.37 parameters coming from Table 3, we would expect the alfalfa hay price to be about $11 per ton higher in December than in June:
$0.50 * 16.49 + $2 * 1.80 -$3.00 * 0.37 = $10.74
Often, we are interested in knowing alfalfa hay prices for several months into the future. When this is the case, using the current month’s hay price to predict prices 6 or 9 months into the future is inaccurate. However, a more accurate forecast can be made with a slight adjustment to the monthly model used to explain monthly prices for the last 10 years. Corn, Class III Milk, and Feeder Cattle futures contracts are listed for several months into the future: CME Group Delayed Quotes.
By observing prices on those more distant contracts compared to the nearby contracts, one can see what market participants expect to happen to those prices over time. Since we have estimated how those prices impact alfalfa hay prices, we can also predict how alfalfa hay prices might change over that same time period (see example box).
Online Hay Forecasting Tool
Utah State University (USU) Extension provides the online Alfalfa Hay Pricing Tool. It can also be accessed at Farm Analysis Decision Support Tools. Figure 2 displays a screenshot of the tool. The Alfalfa Hay Pricing Tool uses historical data to estimate the relationship between the Utah alfalfa hay price and the seven western states' May 1 Hay stocks, the Corn futures, the Feeder Cattle futures, and the Class III Milk futures, which are all traded on the CME Group exchange. The current alfalfa price is estimated and forecasted for the next 9 months.
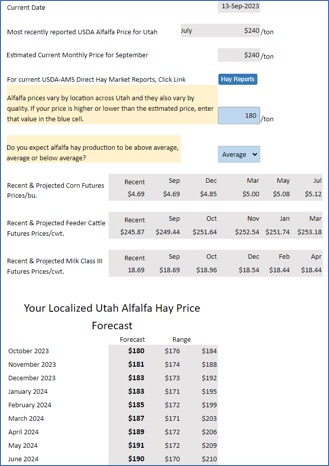
Because of the delay (usually about 2 months) in USDA-NASS reporting monthly hay prices, the initial alfalfa hay price value may not reflect current hay price values. Furthermore, USDA-NASS reports one average price for all of Utah. This price is not reflective of all hay qualities, nor does it consider regional price differences. Therefore, users can enter a hay price more reflective of their area and the quality of hay they sell. This is done in the first highlighted blue entry cell of Figure 2.
May 1 Hay stocks only change once yearly, but Corn, Feeder Cattle, and Class III Milk futures change daily throughout the year. Each time you access the tool, the latest 2 weeks of futures prices will be used to forecast hay prices. Depending upon the time of year, the user can also adjust expectations for the size of the May 1 Hay stocks, the size of the anticipated alfalfa hay production, or the size of the anticipated December 1 Hay stocks: see the second blue highlighted cell in Figure 2. The model forecasts are altered based on the user-entered data.
The 9 months of forecasted prices are based on the user-entered data and the historical relationship between alfalfa hay prices and Corn, Feeder Cattle, and Milk futures prices, as well as the most recent May 1 Hay Stocks Report. The range provided for each monthly forecast is based on the historical accuracy of the model over the past 10 years.
Summary
We analyzed alfalfa hay prices in the seven western states (Arizona, California, Idaho, Nevada, Oregon, Utah, and Washington). We found that the prices in each of these states are highly correlated. Utah alfalfa hay prices are most correlated with Oregon and Washington in terms of price movement. Utah prices tend to be lower than prices in Oregon and Washington. May 1 hay stocks, alfalfa hay exports, and corn, feeder cattle, and milk prices were all found to influence annual hay prices. Corn, feeder cattle, and milk prices impact alfalfa prices every month.
A web-based forecasting tool was developed using these historical price relationships. While no forecasts or forecasting tool will provide perfect forecasts, this fact sheet and the associated Alfalfa Hay Pricing Tool provide hay producers and users with additional insight into the likely direction of alfalfa hay prices over the next several months.
Disclaimer
The tool was primarily developed to forecast Utah alfalfa hay prices. However, so long as users in other western states localize the current hay price to their area and hay quality, the model should work equally well to forecast prices in those states. As market conditions and price relationships do change, the authors are not responsible for the profits made or lost by making marketing decisions based on this information and the Alfalfa Hay Pricing Tool.
References
-
Livestock Market Information Center. (2022). Prices and production [Spreadsheets]. https://www.lmic.info
-
United States Department of Agricultural-National Agricultural Statistic Service (USDA-NASS). (2013–2022). Agricultural prices [Reports]. https://usda.library.cornell.edu/concern/publications/c821gj76b?locale=en
Published November 2023
Utah State University Extension
Peer-Reviewed Fact Sheet
Authors
Dillon M. Feuz and Ryan Larsen
Related Research
a


