Utah Air Quality: PM2.5
What is PM2.5?
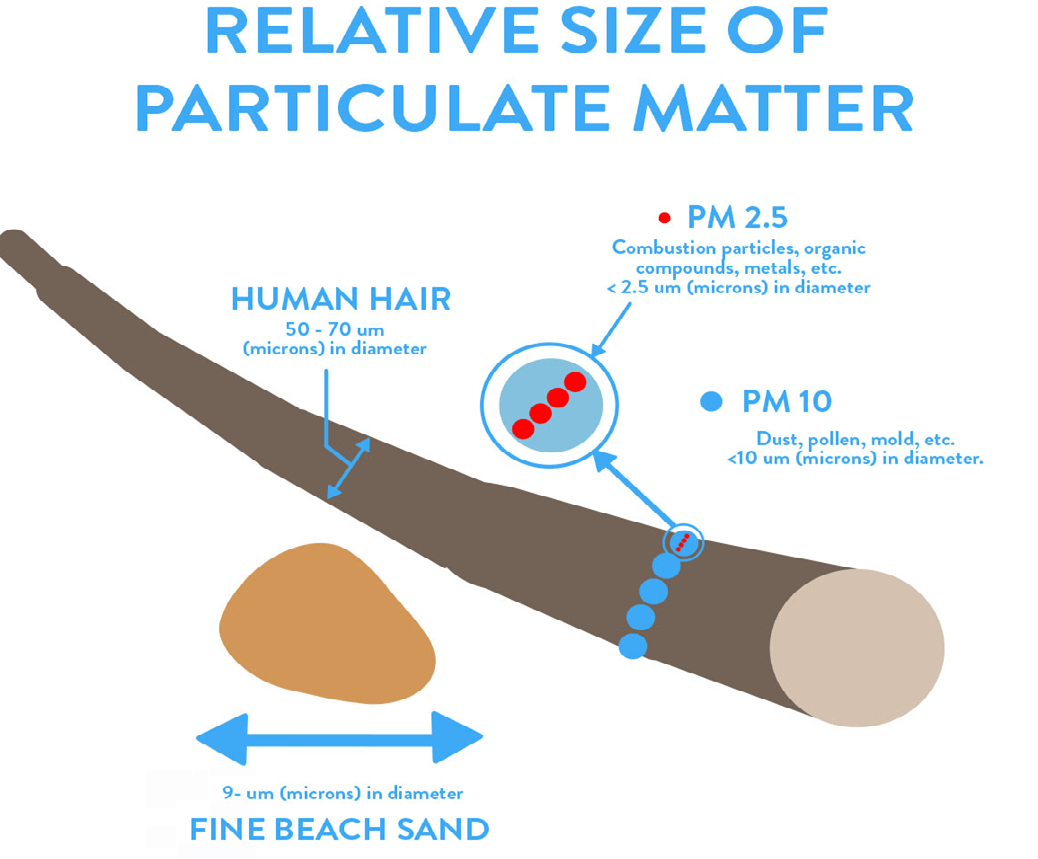
Particulate matter two-point-five (PM2.5) is a tiny suspended particle of air pollution that can penetrate deeply into our lungs and potentially enter the bloodstream. The 2.5 unit means that the particles are smaller than 2.5 micrometers (a micrometer is one millionth of a meter). In Cache Valley and along the Wasatch Front, these tiny particles form and accumulate to unhealthy levels when air is trapped in the bottom of the valley during cold winter days.
Why does northern Utah have such high levels of PM2.5 in the Winter?
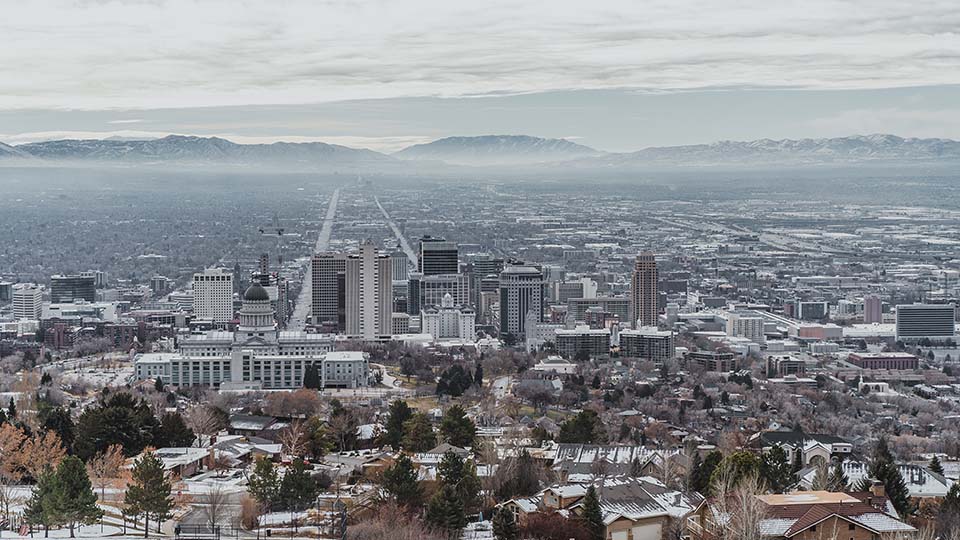
The majority of Utah’s population lives along “the Wasatch Front.” This consists of a chain of cities and towns along the Wasatch mountain range, from approximately Nephi in the south and Brigham City to the north. Along the Wasatch Front, the rapidly growing population is surrounded by mountains directly to the east, and to the west, which create a bowl-like setting.
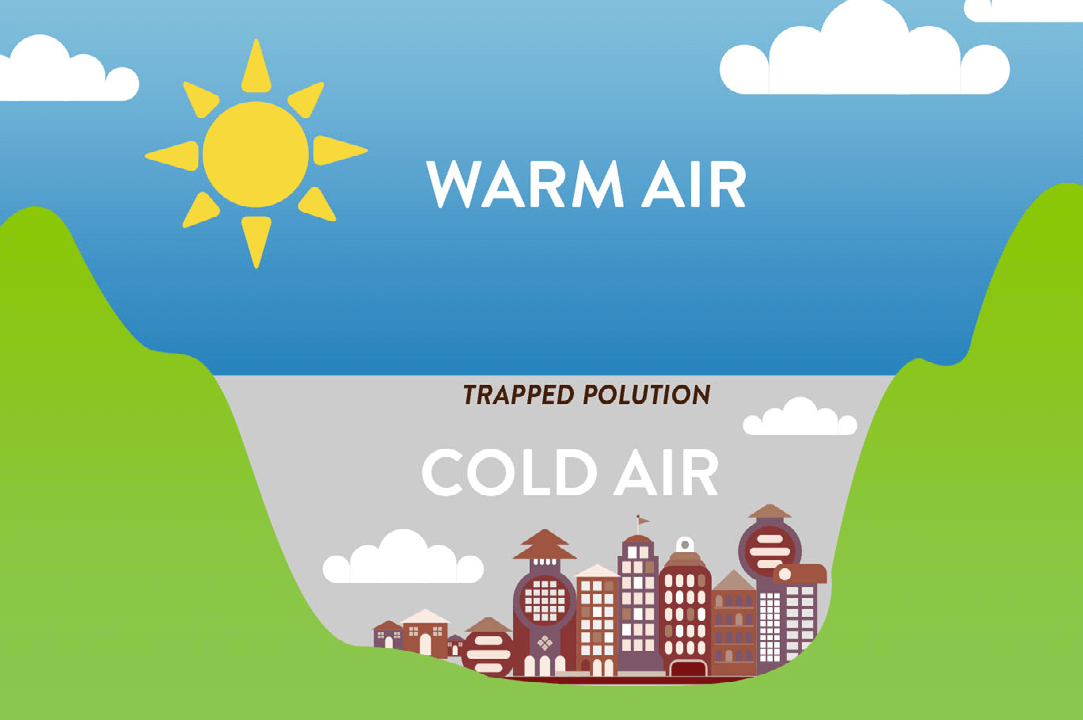
This bowl structure, especially during the winter, results in enhanced inversions where warm air sits above the populated valleys, and cold air gets trapped below. Until a storm and associated wind disturbance comes through, many in Utah “swim in their own soup.” Meaning that we breathe in the ever growing concentration of pollutants we emit as they are all trapped and transformed within our immediate surroundings. Cache Valley, Utah/Idaho, has similar PM2.5 inversion episodes due to a growing population within an even more restrictive bowl-like geography. In fact, consistent violation of the 24-hour average U.S. EPA National Ambient Air Quality Standards for PM2.5 resulted in Cache Valley’s and the Wasatch Front’s designation of non-attainment as identified by the Clean Air Act. Over the last 15 years, on average Cache Valley has exceed the EPA’s standard 17 days per year (low 0 days; high 40 days) and exceeded health impact limit (yellow days) an average of 51 days per year.
What this means for Utah’s Health & Economy
| Air Quality Index (AQI) | PM 2.5 | Ozone |
|---|---|---|
| Good | 0 - 12.0 µg/m³ | 0 - 0.059 ppm |
| Moderate | 12.1 - 35.4 µg/m³ | 0.06 - 0.075 ppm |
| Unhealthy for Sensitive Groups | 35.5 - 55.4 µg/m³ | 0.076 - 0.095 ppm |
| Unhealthy | 55.5 - 150.4 µg/m³ | 0.096 - 0.115 ppm |
| Very Unhealthy | 150.5 - 250.4 µg/m³ | 0.116 - 0.374 ppm |
| Hazardous | Above 250.5 µg/m³ | Above 0.375 ppm |
| Based on a 24-hour average. | Based on an 8-hour average. |
Breathing PM2.5 is associated with multiple serious health effects. Studies associate PM2.5 exposure with all-cause mortality1 , stroke2 , cancer3 , cardiopulmonary and cardiovascular disease1,4,5, asthma6, pneumonia, hypertensive disease, cardiac arrest, ischemic heart disease1,7, chronic obstructive pulmonary disease8 , Alzheimer’s disease9,10,11,12, and autism13. PM2.5 is also associated with increased hospital admissions for cardiovascular and respiratory diseases14. Consistent and coherent health effects observed in these and other studies have led to the consensus of a causal link between particulate pollution and heightened morbidity and mortality15.
There appears to be no discernible threshold effect to the adverse health effects associated with PM2.5. Short-term (hours) exposure to PM2.5 can trigger heart attacks; and long-term chronic exposure (years) has been shown to decrease life expectancy15. In one study, increases of 10 micrograms per cubic meter of air (µg/m3 ) above “clean air” values (5 to 10 µg/m3 ) are associated with up to a 1% rise in cardiovascular death15.
Studies in Utah are consistent with those in other locations. Researchers at Brigham Young University associated PM exposure with early mortality16 from a variety of cardiovascular and other diseases17. Each incremental PM2.5 rise of 10 µg/m3 was associated with a 13.1% increase in hospital admissions due to heart failure18. Also, University of Utah and Brigham Young University researchers recently reported that the risk of “serious” heart attacks increase by 15% for every increase of 10µg above 25 µg per cubic liter of air19.
In addition to the myriad health effects, Utah’s business community is increasingly concerned as air pollution can reduce our ability to attract new companies, jobs, and quality employees and their families20. For example, in 2012, a state economic development officer testified before a Utah legislative task force about how representatives from a foreign company cut short a Utah site visit upon experiencing a “red air alert” pollution day. “These folks were shocked, literally shocked,” he explained, “They basically said ‘we’re going to conclude our visit early because we’re just not interested in being in a place that has this kind of issue.’”21.
Sources of PM2.5 in Our Atmosphere
Northern Utah’s PM2.5 particles can come from a variety of sources and it is important to understand the magnitude of each of these contributions if remediation programs are to be effective. Some particles or particle components are directly emitted from a variety of sources; these are called “primary particles”. These are emitted from sources such as diesel engines, wood smoke, road dust, soil erosion, incomplete combustion and similar physical processes.
PM2.5 particles can also be formed in the atmosphere through chemical reactions of different gas-phase components. These are called “secondary particles”. The most common forms of secondary PM2.5 are ammonium sulfate ([NH4 ]2SO4 ) and ammonium nitrate (NH4 NO3 ). Secondary particles are formed when oxides of sulfur (SOx ) or oxides of nitrogen (NOx) combine with gas-phase ammonia (NH3 ). On highly polluted days in Northern Utah, NH4 NO3 makes up the bulk of the PM2.5 material, approaching 90% of the total mass. An additional confounding factor is that the formation of ammonium nitrate particles is greatly increased in cold temperatures.
Therefore, control of the region’s PM2.5 requires an understanding of the sources and strengths of the precursor compounds NOx, NH3 , and volatile organic compounds (VOCs). In the local area, NOx emissions are dominated (≈75%) by the mobile (automobile) sectors, the NH3 is emitted primarily from the agricultural sector, and the VOC emissions are split roughly equally between the mobile and industrial/residential sectors. While not obvious to the ultimate formation product (NH3 NO3 ), VOC’s are important because their atmospheric oxidation drives the reactions of the NOx to form nitric acid (HNO3 ) which is the actual species which combines with NH3 to form the particulate NH4 NO3 22,23,24. In the northern Utah wintertime atmosphere, studies have shown an excess amount of NH3 is present; therefore, the most effective control strategies should include emission limits of NOx and/or VOCs.
What You Can Do
We experience an average of 30 inversion days a year in our Utah mountain valleys. Given that vehicle emissions are a major contributor to PM2.5, decisions we all make regarding transportation can have a large impact for everyone in Utah. Here are some tips to help improve our air:
Be Idle Free
The first easy step to take would be to turn your engine off when you park. Recent studies at USU and Weber State have shown that all VOC and most NOx emissions are minimized when shutting off your engine as opposed to idling, even for time periods as short as five minutes. Utah has a statewide initiative to reduce idling, called “Turn your Key, Be Idle Free,” that many cities have adopted including Logan. More information about this initiative can be found on the Utah Clean Cities website (http://utahcleancities.org/idlefree-utah).
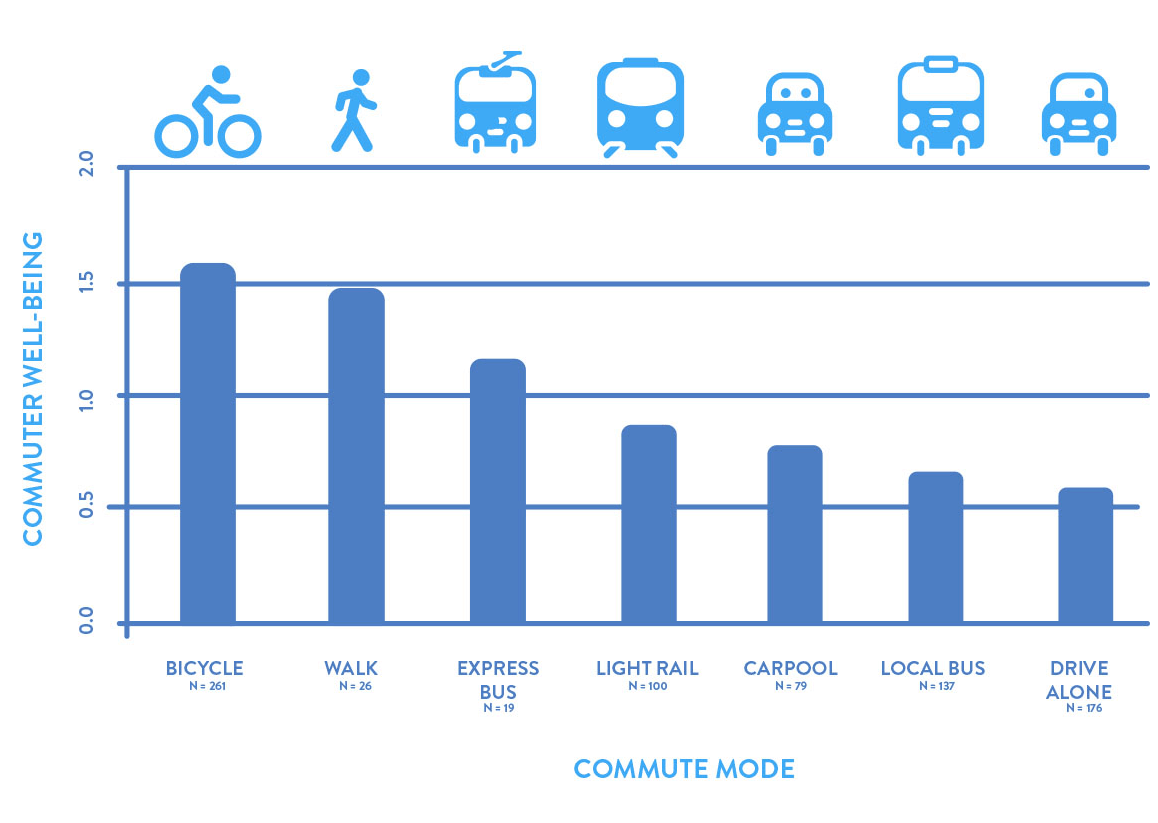
Bike or Walk
Biking or walking as your form of transportation has been associated with myriad of health benefits, including increased happiness and mental clarity. Find out more about switching to biking as your mode of transportation, here http://extension.usu.edu/files/publications/factsheet/ Sustainability_2012n-12pr.pdf.
Trip Chain
Trip chaining involves mapping your route and tasks in a way that stacks as many functions into one outing as possible, while also minimizing the distance traveled on your route.
Carpool
Carpooling is a fun way to catch up with friends/colleagues, while also saving costs on gas money and stress single-driver commuting
Bus
Riding the bus is a great way to help reduce emissions. You can legally text and ride, and in Logan, Utah, the transit system is free!
More
Avoid driving a diesel vehicle on polluted air days. Also, observe Utah Law and do not burn wood stoves on polluted air days.
Your Local Air Quality
If you are interested learning more about your local air quality, the US Environmental Protection agency recently released an Environmental Justice Screening and Mapping Tool (https://www.epa.gov/ejscreen) that allows you to search for your current local PM2.5 levels under the “Map Data” tab. Also, you can sign up to receive air quality alerts from the Utah Department of Air Quality, to know in advance when the air will be unhealthy so you can plan your travel and outdoor time accordingly (just send the blank email to Subscribe-deqChoose_Clean_Air@list.utah.gov and you will be added to the list). The EPA’s AIRNOW website and the Division of Air Quality’s webpage both also offer smart phone apps.
References
- Pope, III C.A., Burnett, R.T., Thun, M.J., Calle, E.E., Krewski, D., et al. (2002). Lung cancer, cardiopulmonary mortality, and long-term exposure to fine particulate air pollution. JAMA, 287: 1132-1141.
- Hong, Y.C., Lee, J.T., Kim, H., & Kwon, H.J. (2002). Air pollution: A new risk factor in ischemic stroke mortality. Stroke 33: 2165-2169.
- Dominici, F., McDermott, A., Daniels, M., Zeger, S.L., & Samet, J.M. (2005). Revised analysis of the National Morbidity, Mortality, and Air Pollution Study: Mortality among residents of 90 cities. Journal of Toxicology and Environmental Health, 68: 1071-1092.
- Delfino, R., Sioutas, C., & Malik, S. (2005). Potential role of ultrafine particles in associations between airborne particle mass and cardiovascular health. Environmental Health Perspectives, 113(8): 934-946.
- Krewski, D. & Rainham, D. (2007). Ambient air pollution and population health: Overview. Journal of Toxicology and Environmental Health, 70: 275-283.
- Halonen, J.I., Lanki, T., Yli-Tuomi, T, Tiittanen, P., Kulmala, M, et al. (2009). Particulate air pollution and acute cardiorespiratory hospital admissions and mortality among the elderly. Epidemiology, 20: 143-153.
- Johnson, P.R., & Graham, J.J. (2005). Fine particulate matter national ambient air quality standards: Public health impact on populations in the northeastern United States. Environmental Health Perspective, 113: 934-946.
- Gan, W.Q., FitzGerald, J.M., Carlsten, C., Sadatsafavi, M., Brauer, M.(2013). Associations of ambient air pollution with chronic obstructive pulmonary disease hospitalization and mortality. American Journal of Respiratory and Critical Care Medicine, 187: 721-727.
- Calderon-Garciduenas, L., Franco-Lira, M., Mora-Tiscareno, A., Medina-Cortina, H., Torres-Jardon, R., et al. (2013). Early Alzheimer’s and Parkinson’s disease pathology in urban children: Friend versus Foe responses – it is time to face the evidence. BioMed Research International, 2013: 161687.
- Calderon-Garciduenas, L., Reed, W., Maronpot, R.R., Henriquez-Roldan, C., Delgado-Chavez, R., et al. (2004). Brain inflammation and Alzheimer’s-like pathology in individuals exposed to severe air pollution. Toxicologic Pathology, 32: 650-658.
- Ranft, U., Schikowski, T., Sugiri, D., Krutmann, J., Kramer, U. (2009). Long-term exposure to traffic-related particulate matter impairs cognitive function in the elderly. Environmental research, 109(8): 1004-1011.
- Moulton, P.V. & Yang, W. (2012). Air pollution, oxidative stress, and Alzheimer’s disease. Journal of Environmental and Public Health, 2012: 472751.
- Becerra, T.A., Wilhelm, M., Olsen, J., Cockburn, M., & Ritz, B. (2013). Ambient air pollution and autism in Los Angeles county, California. Environmental Health Perspectives, 121(3): 380-386.
- Dominici, F., Peng, R.D., Bell, M.L., Pham, L., McDermott, A., et al. (2006). Fine particulate air pollution and hospital admission for cardiovascular and respiratory diseases. The Journal of the American Medical Association (JAMA) 295: 1127-1134.
- Pope III, C.A., Hill, R.W., & Villegas, G.M. (1999). Particulate Air Pollution and Daily Mortality on Utah’s Wasatch Front. Environmental Health Perspectives 107: 567-573.
- Brook, R.D., Rajagopalan, S., Pope, III C.A., Brook, J.R., Bhatnagar, A., et al. (2010) Particulate Matter Air Pollution and Cardiovascular Disease. An Update to the Scientific Statement From the American Heart Association. Circulation.
- Pope III C.A. & Dockery, D.W. (2006). Health effects of fine particulate air pollution: Lines that connect. Journal of Air Waste Management Association, 56: 709-742.
- Pope III, C.A., Renlund, D.G., Kfoury, A.G., May H.T., & Horne, B.D. (2008). Relation of heart failure hospitalization to exposure to fine particulate air pollution. American Journal of Cardiology, 102: 1230-1234.
- Salt Lake Tribune. (November 9, 2015). New Utah research: Bad air can literally cause a heart attack. Retrieved from: http://www.sltrib.com/home/3146743-155/new-utah-research-bad-air-can.
- O’Donoghue, A.J. Groups chase air pollution to keep businesses, people on Wasatch Front. Deseret News [online]. May 20, 2015. http://www.deseretnews.com/article/865629118/Groups-chase-air-pollution-to-keep-businesses-people-on-Wasatch-Front.html.
- Fays, J. Link between clean air and healthy Utah business environment explored. Salt Lake Tribune [online]. September 21, 2012. http://archive.sltrib.com/article.php?id=23200667&itype=storyID.
- Edgerton, E.S., Hartsell, B.E., Saylor, R.D., Jansen, J.J., Hansen, D.A., et al. (2006). The Southeastern Aerosol Research and Characterization Study, part 3: continuous measurements of fine particulate matter mass and composition. Journal of Air Waste Management Association, 56: 1325-1341.
- Malek, E., Davis, T., Martin, R.S., Silva, P.J. (2006). Meteorological and environmental aspects of one of the worst national air pollution episodes (January, 2004) in Logan, Cache Valley, Utah, USA. Atmospheric Research 79: 108-122.
- Watterson, T.L., Sorensen, J., Martin, R., & Coulombe, R.A., Jr.(2007). Effects of PM2.5 collected from Cache Valley Utah on genes associated with the inflammatory response in human lung cells. Journal of Toxicology and Environmental Health, 70: 1731-1744.
January 2016
Utah State University Extension
Peer-reviewed fact sheet
Authors
Randy Martin, Roger Coulombe, & Roslynn Brain
Departments of Civil and Environmental Engineering, Veterinary Sciences, and Environment & Society

Roslynn McCann
Sustainable Communities Specialist
Environment and Society Dept