Meat-Wise Eating Habits
Worldwide Meat Consumption
Whether from a cow, pig, bird, fish, or other domestic or game animal, meat is universally enjoyed as part of the cultural culinary experience. It is also an excellent source of protein, which is important for a healthy body. Given the potentially positive impact our purchasing choices can have, such as generating economic development in local communities and providing economic security to local producers (Jensen, 2010), this fact sheet provides a set of quick facts and action tools to make educated choices concerning one major purchasing choice for many: meat.
Basic Meat Differences
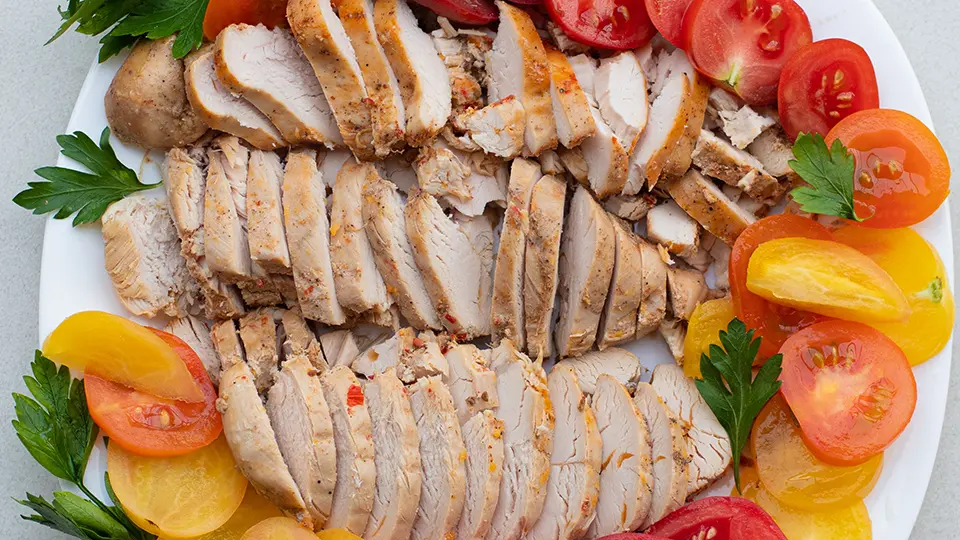
Although definitions of red and white meat vary, it is generally accepted that the meat of livestock (including cattle, bison and lamb) is classified as red, and the meat of fish, chickens, and turkeys are classified as white. Pork, known as “the other white meat,” is classified by the USDA as red meat (USDA, 2011). This is because pork contains more myoglobin than chicken or fish, and the amount of myoglobin in animal muscles determines whether it is classified as red or white meat. Myoglobin is a protein that contributes to red pigmentation and to higher iron content (USDA, 2011). Many types of game meat are considered either white, dark and/or red depending on the animal.
The Carbon Footprint of Meat
What is a carbon footprint? Although definitions vary, it is commonly accepted as the associated total amount of carbon dioxide (CO2 ) and methane (CH4 ) emissions involved in our daily lifestyles and consumption choices. When we think of our carbon footprint, we often associate driving less or recycling as the top ways to reduce it. However, our dietary choices can have a major impact on our individual environmental impact. Below are some examples of how:
- According to a nationwide life-cycle greenhouse gas emissions analysis based on the average U.S. household’s food expenditures, “shifting less than one day per week’s worth of calories from red meat and dairy products to chicken, fish, eggs, or a vegetablebased diet achieves more greenhouse gas reduction than buying all locally sourced food” (Weber & Matthews, 2008, p. 3508). This is because a large portion of our carbon footprint is not from CO2 greenhouse gases generally stemming from transportation, but on the production side of the food we consume, including Nitrous oxide (N2 0) emissions mainly from nitrogen fertilizer application, other solid management techniques and manure management, and from methane (CH4 ) emissions due mainly from enteric fermentation in ruminants (cattle, sheep, and goats) and manure (Weber & Matthews, 2008).
- The Food and Agriculture Organization of the United Nations reports that the livestock sector contributes 18% (7.1 billion tons CO2 ) of global greenhouse gas emissions, which is higher than the transportation sector (FAO, 2006). As mentioned in the report, the livestock sector produces 65% of human-related nitrous oxide, which has 296 times the global warming potential of CO2 . Compared to other ozone depleting substances, nitrous oxide emission has been identified as the single most important ozone-depleting emission and it is expected to remain the largest throughout the 21st century (Ravishankara, Daniel & Portmann, 2009). Livestock also accounts for 37% of all human-induced methane (23 times as warming as CO2 ) produced primarily by ruminant digestion, and 64% of ammonia (FAO, 2006). Lastly, the FAO (2006) reports that livestock is the largest anthropogenic user of global land, using almost 30% of the earth’s entire land surface. However, it should be noted that a large portion of the earth’s land is either arid or semiarid, where ruminants are well adapted to use these lands to feed the people that live in there.
- Over 9 billion livestock are maintained for meat consumption in the U.S. (Pimentel & Pimentel, 2003). This population, on average, outweighs our nation’s human population by approximately 5 times and the grain it consumes could feed 840 million people on a plant-based diet (Pimentel & Pimentel, 2003). Most of these grains, however, are not suitable for human consumption and a transition of the types of grains produced would be necessary.
- Although direct consumption of water by U.S. livestock consists of only 2% of the total water used in agriculture, “each year, a total of 253 million t grain are fed to US livestock, requiring a total of about 25 × 1013L water. Worldwide grain production specifically for livestock requires nearly three times the amount of grain that is fed to US livestock and three times the amount of water used in the United States to produce grain feed” (Pimentel et al., 2004, p. 913).
- Fish are the main source of protein for a large part of the world, both to humans and other species. However, numerous species, such as Atlantic bluefin tuna, have been over-harvested, impacting their populations. Many of these species are on the brink of commercial extinction, which threatens not only ocean ecosystems but also the lifestyles and health of millions of people who depend on fish for food. In addition to over-harvesting, higher mercury content in fish has raised public concern due to health risks such as cardiovascular disease and neurologic outcomes (Mozaffarian & Rimm, 2006). Higher mercury levels in fish is caused by natural sources (volcanoes) and human sources (coalfired power plants, gold mining, chlorine production, etc.) (Mozaffarian & Rimm, 2006).
- cardiovascular disease and neurologic outcomes (Mozaffarian & Rimm, 2006). Higher mercury levels in fish is caused by natural sources (volcanoes) and human sources (coalfired power plants, gold mining, chlorine production, etc.) (Mozaffarian & Rimm, 2006).
Reducing our Footprint

If you are interested in lowering your carbon footprint when it comes to meat, below are some easy options that could be taken:
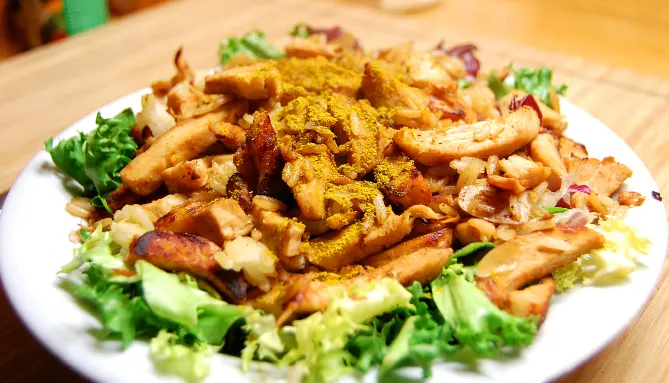
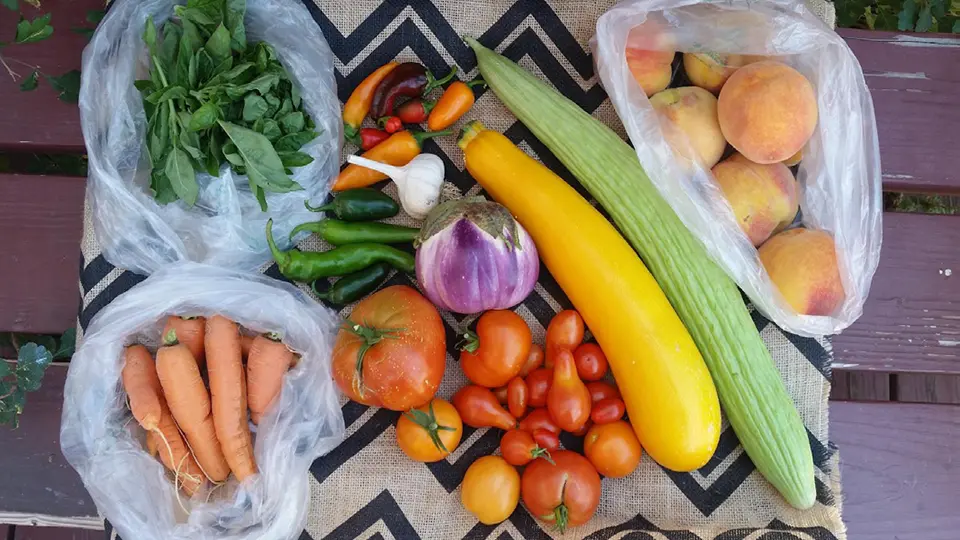
- Incorporate more vegetables and white meats into your diet.
- Support locally produced meat. This lessens the CO2 emissions that would otherwise have been made to transport the meat across the country. Some added bonuses: Buying local meat helps to invigorate the local economy and you can ask your local butcher in-depth questions such as whether the meat you’re purchasing is growth hormone-free, how the animal was raised (grass-fed, animal welfare, etc.), how the animal was slaughtered, and which farm the meat came from.
- When eating fish, choose species that are sustainably farmed, caught from populations that aren’t declining, and, if information is available, that are low in mercury. The Monterey Bay Aquarium’s Seafood Watch program (2011) has excellent, free, pocket-sized guides (as well as an app for smartphones) that show what fish to eat, what fish to avoid, and good alternative species available for both sushi restaurants and traditional markets.
Sources
- FAO. (2006). Livestock’s long shadow: Environmental issues and options. Retrieved from: https://www.fao.org/3/a0701e/a0701e00.htm
- Jensen, J. (2010). Local and regional food systems for rural futures: Rural futures lab foundation paper no. 1. Rural Policy Research Institute (RUPRI) Rural Futures Lab. 1, 1-27
- Mozaffarian, D. & Rimm, E.B. (2006). Fish intake, contaminants, and human health: Evaluating the risks and benefits. The Journal of the American Medical Association 296(15).
- Pimentel, D., Berger, B., Filiberto, D., et al. (2004). Water resources: Agricultural and environmental issues. BioScience, 54(10)., 909-918.
- Pimentel, D. & Pimentel, M. (2003). Sustainability of meatbased and plant-based diets and the environment. American Society for Clinical Nutrition, 78(3), 660S-663S.
- Ravishankara, A.R., Daniel, J.S. & Portman, R.W. (2009). Nitrous oxide (N2 0): The dominant ozone-depleting substance emitted in the 21st century. Science, 326(5949), 123-125.
- Seafood Watch. (2011). Central US Sustainable Seafood Guide. Retrieved from the Monterey Bay Aquarium website: www.seafoodwatch.org
- USDA. (2011). Meat preparation: Fresh pork from farm to table. Retrieved from USDA Food Safety and Inspection Service fact sheets: http://www.fsis.usda.gov/factsheets/Pork_From_Farm_to_Table/index.asp
- Weber, C.L. & Matthews, H.S. (2008). Food-miles and the relative climate impacts of food choices in the United States. Environmental Science & Technology, 42(10), pp. 3508-3513.
December 2012
Utah State University Extension
Peer-reviewed fact sheet
Authors
Jenna Haycock, Kelly Anderson & Roslynn Brain
Department of Environment & Society

Roslynn McCann
Sustainable Communities Specialist
Environment and Society Dept
Related Research

2023 Moab Grown Impacts at a Glance
Moab Grown partners local farmers and producers with our community chefs and retail outlets. This one-page document highlights Moab Grown’s 2023 impacts.
Air Quality and Agriculture
Air pollution comes from many sources including power plants, factories, cars, trucks, volcanoes, and windblown dust. Air pollutants are regulated by the Environmental Protection Agency (EPA) as part of our national ambient air quality standards (NAAQS).
An Examination of the Implementation of Environmentally Sustainable Practices In the Utah Ski Industry: A Qualitative Study
This qualitative research study was designed to examine the current level of implementation of environmentally sustainable practices at Utah’s ski resort areas and also ascertain future plans.
Backyard Beekeeping
With proper care, management, and harvesting, backyard beekeeping can provide health, economic, and environmental benefits.
Backyard Composting in Utah
The benefits of using compost as a soil amendment include increasing soil tilth, fertility, water holding capacity, aeration, and drainage.
Beef Production & Consumption: Sustainable Alternatives
Beef is part of American culture, so is there a way to make wiser choices when it comes to purchasing beef? The short answer is, yes!
Best Management Practices Monitoring Guide for Stream Systems
Best Management Practices Monitoring Guide for Stream Systems provides guidance on establishing a water quality monitoring program that will demonstrate the effectiveness of Best Management Practices (BMPs) to reduce nonpoint source pollution in stream sy
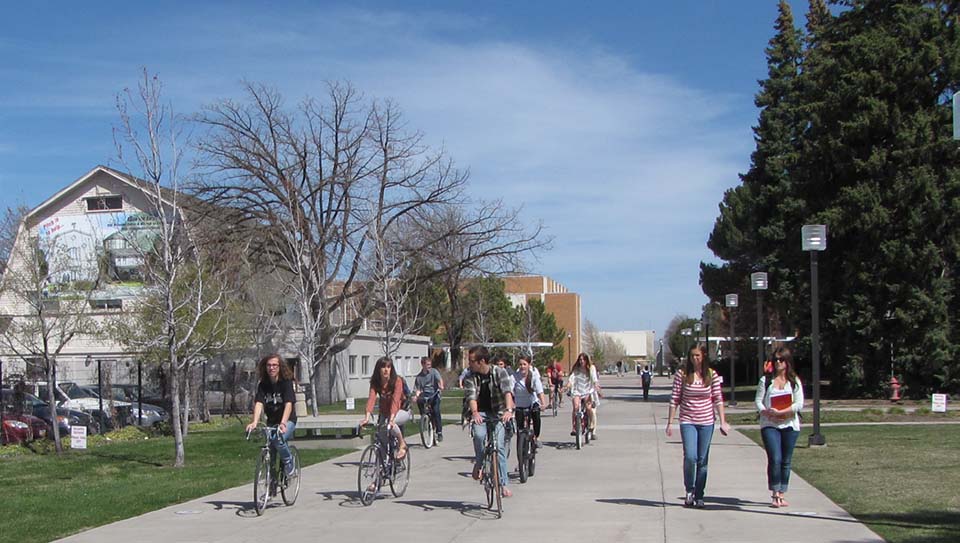
Biking as an Alternative Mode of Transportation
Now is a great time to take advantage of the shifting focus away from vehicle commuting and delve into a healthier and cheaper mode of transportation: Cycling.
Brownfields Federal Programs Guide - EPA
As the U.S. Environmental Protection Agency’s (EPA) Brownfields Program celebrates its 20th anniversary in 2015, it is a good time to reflect on some of the factors that contribute to successful brownfields efforts at the federal, state, and local levels.
Business Sustainability: Moving from Thought to Action
This brief guide will help your businesses develop a sustainability goal, understand the behavior changes necessary to meet your goal, provide successful techniques to achieve those behavior changes, and outline the implementation of a successful plan to
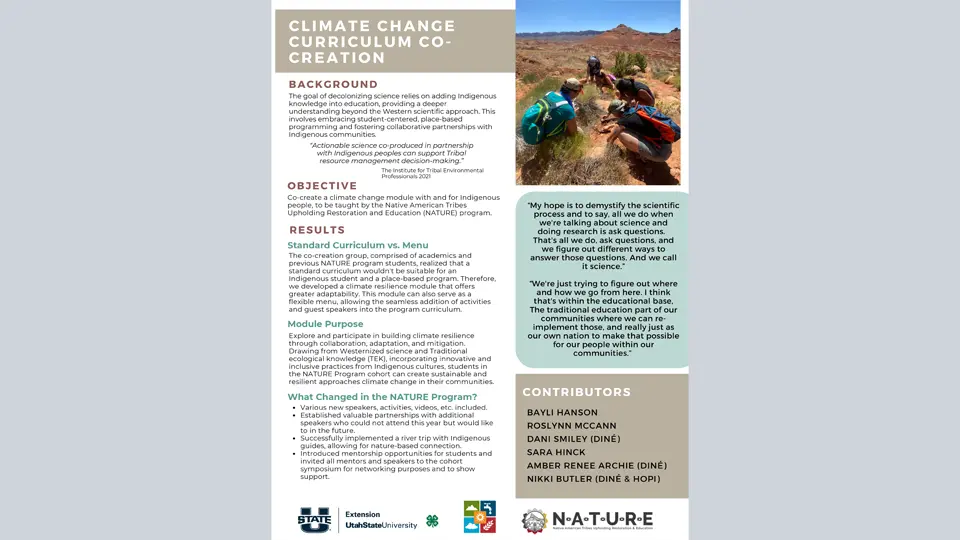
Climate Change Curriculum Co-Creation
Actionable science co-produced in partnership with Indigenous peoples can support Tribal resource management decision-making.
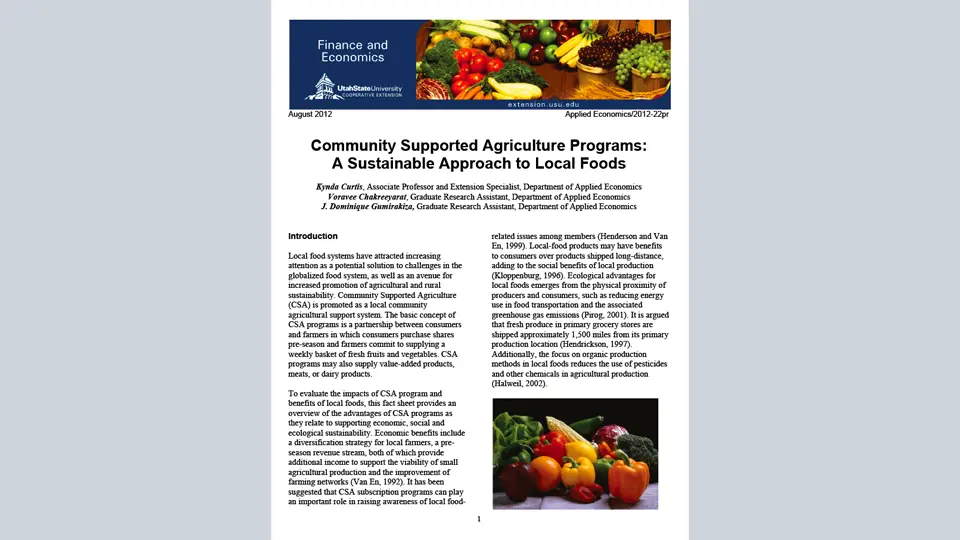
Community Supported Agriculture Programs: A Sustainable Approach to Local Foods
To evaluate the impacts of CSA program and benefits of local foods, this fact sheet provides an overview of the advantages of CSA programs as they relate to supporting economic, social and ecological sustainability.
Community Supported Agriculture: Accepting SNAP Payments
The U.S. Department of Agriculture’s Food and Nutrition Service (USDA FNS) authorizes businesses to accept SNAP benefits, including direct marketing farmers and nonprofit food buying cooperatives operating a CSA.
Community Supported Agriculture: Crop Planning
This fact sheet will help you learn more about the components of an effective crop plan and how to use one in your CSA operation.
Community Supported Agriculture: Definition, Benefits, Barriers, and Resources for Growers
Community Supported Agriculture (CSA) provides a direct connection between local community members and growers, generally through purchasing a weekly “share” of locally grown goods provided by the grower throughout a time frame.
Community Supported Agriculture: Legal Concerns
As with all businesses, Community Supported Agriculture (CSA) growers may experience legal concerns. This fact sheet will walk growers through certain steps that may be taken to minimize the liability of your CSA operation and manage possible risks.
Community Supported Agriculture: Marketing & Outreach Strategies to Encourage Membership
When you market your community supported agriculture (CSA) operation, you should consider the best communication tools to delivering information to potential and current shareholders, engaging your shareholders, and getting feedback.
Community Supported Agriculture: Participating in a Share
CSA members are offered fresh, locally grown goods and an opportunity to support local farms and farmers by investing in a CSA share from a local grower.
Community Supported Agriculture: Pricing
This information can help you through the financial process by explaining how to develop a budget, how to price your CSA share with different pricing strategies, and payment policy.
Community Supported Agriculture: Starting and Managing Your Operation
Starting a Community Supported Agriculture (CSA) operation requires planning and consideration. The method and process of your CSA operation must be determined, as well as how to properly record and finance the operation.

Cost Free Landscape Water Conservation Ideas
In most landscapes, large amounts of water can be saved without changing the landscape at all. Saving water in an existing landscape usually begins with maintenance.
Create Farm Fresh Food Curriculum
This packet includes all the information you need to successfully implement, and evaluate Create Farm Fresh Food classes.

Creating Landscapes for Wildlife: A Guide for Backyards in Utah
By "landscaping for wildlife," we can design a residential yard which attracts and supports native birds, mammals, reptiles and amphibians.

Designing Your Home for Maximum Natural Lighting
There are many benefits to having more natural light in your home. The most obvious of these are the savings you can achieve with a reduced utility bill.

Easy Steps to Reduce Your Energy Bill
Ideas on how to reduce your energy consumption using new technologies and conservation practices.
Encouraging SNAP Shopper Participation at Utah Farmers Markets
This guide’s steps were compiled during background research for advertising acceptance of SNAP benefits using Electronic Benefits Transfer (EBT) cards and the Double Up Food Bucks (Double Up) program offered at farmers markets throughout Utah.
Farmers’ Market Consumer Preferences & Premium Pricing for Organically Grown & Local Fresh Produce
This publication examines Utah farmers’ market consumer preferences for organically grown and local fresh produce and their willingness to pay premiums for labeled products by production method and origin.
Freestores: What, Why & How
A viable alternative to disposing of unwanted possessions in the trash is to donate them to a freestore to be used by others. If one does not already exist in your area, consider implementing one for the benefit of the community.
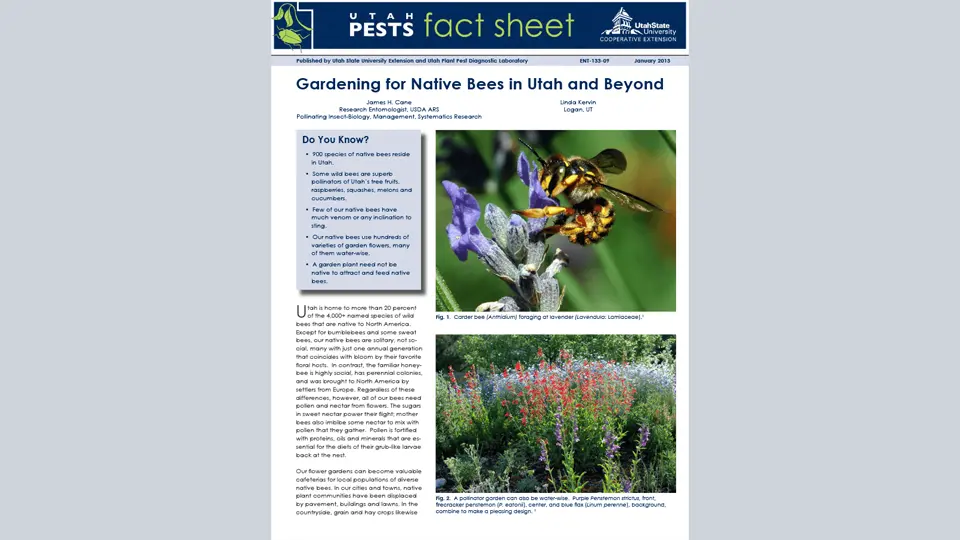
Gardening for Native Bees in Utah and Beyond
Utah is home to more than 20 percent of the 4,000+ named species of wild bees that are native to North America.
Graywater Systems
Why irrigate only with treated drinking water when you can supplement your irrigation needs through an effective graywater system?
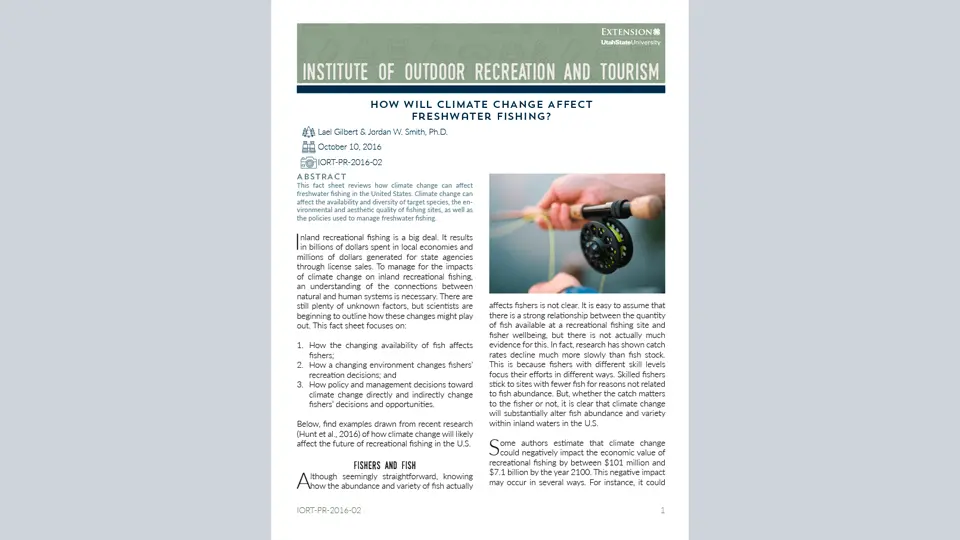
How Will Climate Change Affect Freshwater Fishing?
This fact sheet reviews how climate change can affect freshwater fishing in the United States. Climate change can affect the availability and diversity of target species, the environmental and aesthetic quality of fishing sites, as well as the policies us
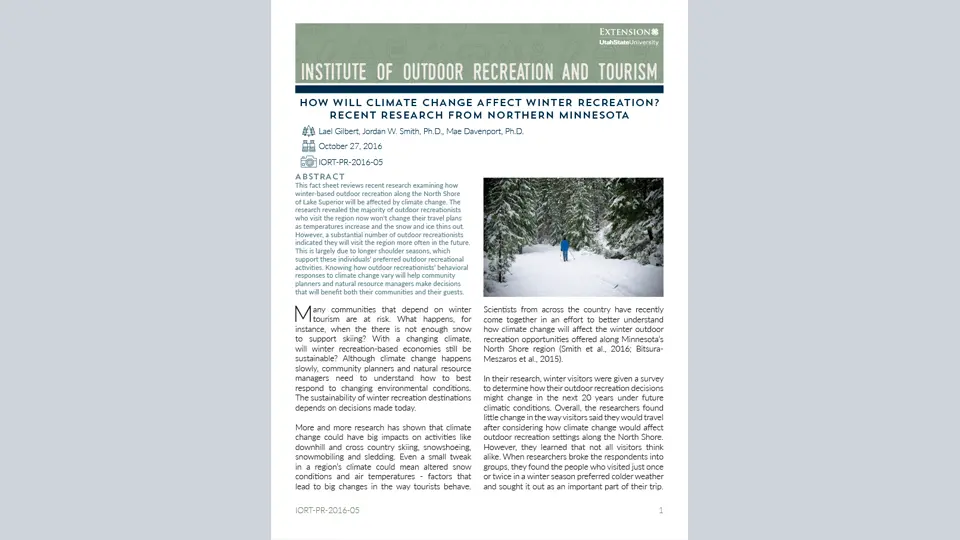
How Will Climate Change Affect Winter Recreation?
This fact sheet reviews recent research examining how winter-based outdoor recreation along the North Shore of Lake Superior will be affected by climate change.
Meat-Wise Eating Habits
This fact sheet provides a set of quick facts and action tools to make educated choices concerning one major purchasing choice for many: meat.
Moab Local Food Guide 2024
Those growing and producing food within a 100 mile radius from Moab have been included in this guide to help YOU make locally sourced purchasing decisions!
National Extension Climate Initiative: Value, Accomplishments, Needs
The National Extension Climate Initiative (NECI) serves as an anchor for Extension professionals, researchers, and partners to collaborate on climate-related issues, share resources, discuss barriers and opportunities for advancing climate change progra
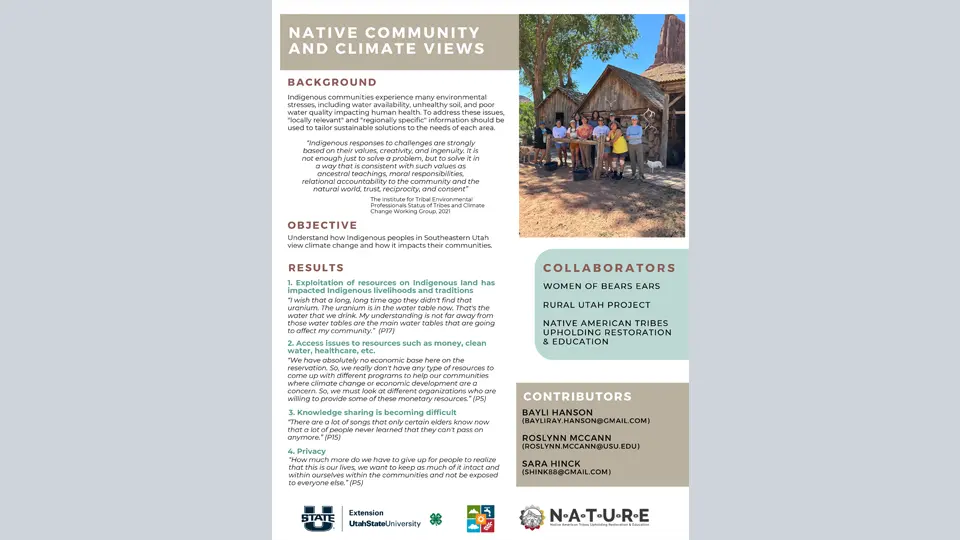
Native Community and Climate Views
Indigenous responses to challenges are strongly based on their values, creativity, and ingenuity. It is not enough just to solve a problem, but to solve it in a way that is consistent with such values as ancestral teachings, moral responsibilities, r
Permaculture
Permaculture is a design concept for sustainable, food producing landscapes mimicking the diversity and resilience of natural ecosystems
Practicing Environmental Etiquette in Utah’s Deserts
As popular as Utah’s deserts are, they are also very diverse and fragile, and can be highly affected by those that want to spend time there.
Rangeland Carbon Sequestration
Rangelands can be managed to increase soil carbon storage through more equitable distribution of grazing pressure over time and space to reduce forage plant defoliation and increase carbon inputs from standing plants to soils. The overall ability of range
Recycling in Utah: Green Waste for Compost
The goal of providing recycling related information is to help individuals and businesses make informed decisions about recycling. This fact sheet will focus on green waste recycling for compost.
Recycling in Utah: Paper
The goal of providing recycling related information is to help individuals and businesses make informed decisions about recycling. This fact sheet will focus on paper recycling.
Reducing the Risk of Birds Colliding into Windows: A Practical Guide for Homes and Businesses
Every year in the United States alone, it is estimated that as a many as 599 million birds are killed because they fly into a glass window; some researchers estimate the number may be as high as 988 million. This is approximately 10 percent of the bird po
Regeneration of Aspen Stands in Southern Utah
This fact sheet describes research conducted at Utah State University that identified factors to improve the success of regenerating aspen in southern Utah.
Reuse: Creating a Next Life for Common Items
If you are looking for ways to save money and add creative flair to your daily life, reusing everyday items you are likely to throw away could be the answer!
Reusing Potentially Contaminated Landscapes: Growing Gardens in Urban Soils - EPA
This fact sheet provides communities and individuals with general urban gardening information about: Common contaminants that can be found in urban soil. Ways to identify contaminants and reduce exposure. Improving soils and growing plants in mildly conta
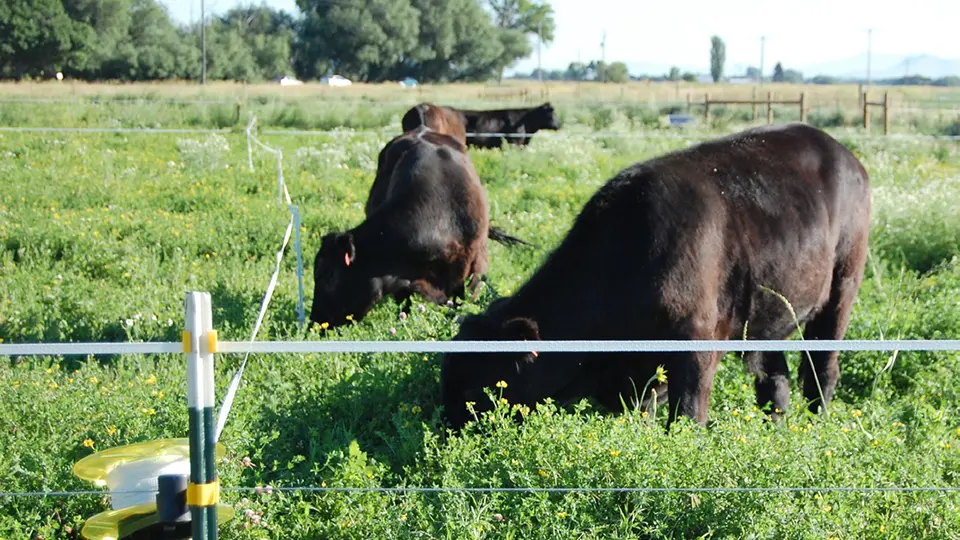
Rocky Mountain Trefoil Beef
Researchers at Utah State University are exploring the use of tannin-containing legumes as a method for finishing cattle to address environmental and efficiency concerns associated with the most common current beef production systems.