Utah Livestock Producer: Preferred Drought Management Strategies
Introduction
Utah is the third driest state in the United States, with 65% of the state experiencing abnormally dry conditions from 2000 to 2019 (NIDIS, 2020). In 2018 and 2019, 38% of the state experienced severe drought (NIDIS, 2020). Agricultural production is critical to the Utah economy, contributing just over 2% of gross domestic product (GDP) annually (BEA, 2019). Livestock production plays a vital role in Utah’s economy as livestock sales generate $1,278 million annually, representing 70% of all Utah agricultural sales (USDA NASS, 2017). However, agricultural production puts great demands on water resources as agriculture consumes 80% of all water in the United States (USDA ERS, 2019). Hence, agricultural adaption to drought will be critical to maintaining food and feed production and supporting the Utah economy and its rural communities, as rural areas are often severely impacted by persistent drought (Lal et al., 2012; Howitt et al., 2017).
A study by Drugova, Curtis, and Ward (2021) examined agricultural producer preferences for drought management strategies and how their preferences shift in response to varying drought levels and crop or grazing efficiency losses. Study data were collected through choice experiments1 conducted in Utah at producer meetings and online in 2019 for fresh produce growers, hay and forage growers, and livestock producers.
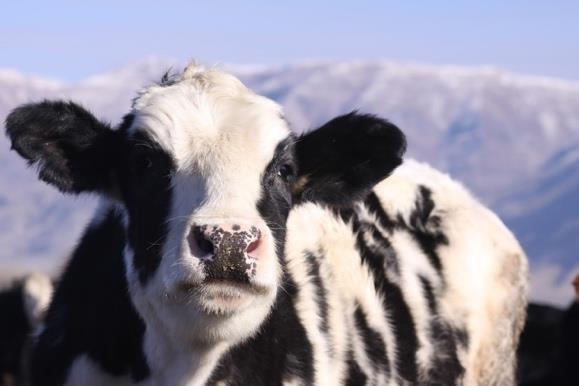
This fact sheet, the second in a series of three, examines livestock producer preferred drought management strategies and how producer preferences change depending on drought severity and expected grazing efficiency. Severe drought in livestock production leads to decreases in feed availability, range or hay quality, and overall lower quality beef (Holupchinski et al., n.d.). Hence, drought increases production costs and producer dependence on imported feed. Thus, extended drought poses a threat to agricultural productivity and the economies of rural and tribal areas in Utah.
1Choice experiments are used to evaluate the decision process and value an individual places on a good, service, or situation/policy with specific characteristics. Field choice experiments normally have from 20–80 participants with an average size of 50 (Hensher, Rose, & Green, 2005).
Producer Characteristics
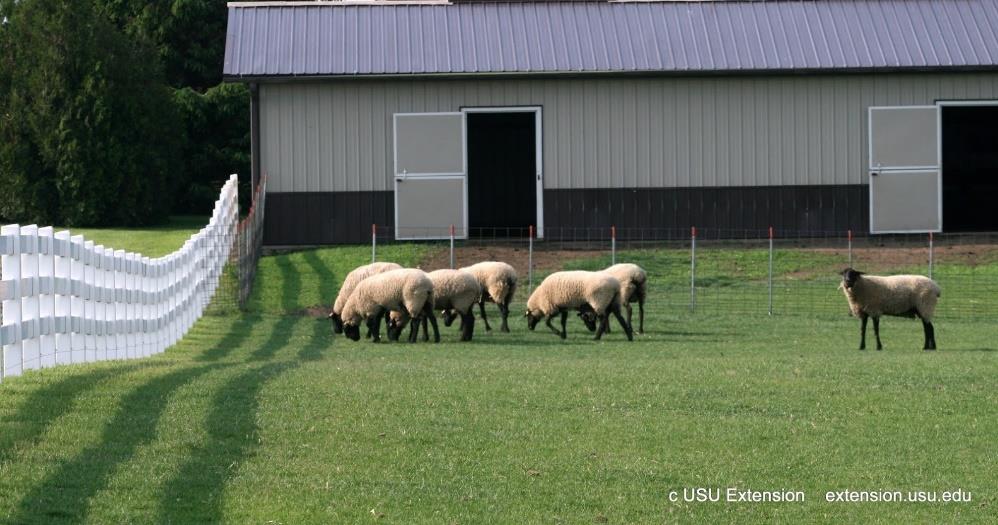
Sixty-four livestock producers participated in the study, but only 48 completed all necessary choice sets, and thus, were included in the final sample. The majority manage 51–200 animals (56%), are primarily cow/calf operations (82%), and sell their animals directly to consumers, at auctions, etc. (58%). Also, 74% use conventional production methods (defined as no organic, grass-fed, etc.), and 67% selected feed quantity as the largest issue resulting from drought. Just over one-third (38%) considered grazing efficiency reductions of 40–59% significant, while 33% were more sensitive to grazing efficiency losses, considering losses under 40% significant. Of the 26 reporting their county of residence, 11 were located in southern Utah and the remainder in central/northern Utah. Table 1 provides an overview of producer characteristics.
Table 1 - Characteristics of Study Livestock Producers
| Characteristic | Category | Count | % share |
|---|---|---|---|
| Primary operator gender | Male | 34 | 81% |
| Female | 8 | 19% | |
| Primary sales outlet | Direct | 25 | 58% |
| Direct & wholesale | 15 | 35% | |
| Other | 3 | 7% | |
| Animals managed (number) | <51 | 5 | 19% |
| 51–200 | 15 | 56% | |
| 201–400 | 6 | 22% | |
| 401–700 | 0 | 0% | |
| >700 | 1 | 4% | |
| Primary livestock type | Cow/calf | 37 | 82% |
| Feeder cattle | 2 | 4% | |
| Sheep/lamb | 3 | 7% | |
| Other | 3 | 7% | |
| Production methods used* | Conventional | 34 | 74% |
| Organic | 3 | 7% | |
| Grass-fed | 18 | 39% | |
| Natural | 12 | 26% | |
| Hormone-free | 10 | 22% | |
| Largest issue resulting from drought | Feed quantity | 18 | 67% |
| Feed quality | 1 | 4% | |
| Summer range degradation | 4 | 15% | |
| Need to haul water | 1 | 4% | |
| Other | 3 | 11% | |
| What is a large reduction in grazing efficiency to you? | 80–99% | 1 | 4% |
| 60–79% | 6 | 25% | |
| 40–59% | 9 | 38% | |
| 20–39% | 6 | 25% | |
| <20% | 2 | 8% | |
| Number of respondents | - | 48 | 100% |
Note. Sum of responses per characteristic may not add up to 48 (not all questions were completed).
* Producers may use multiple production methods
Preferred Strategies
Livestock producers were asked to select their most preferred drought management strategy from a list of options, assuming a drought causing large grazing efficiency losses but not specifying a specific loss amount. The results (Table 2, panel A) show that most livestock producers (50%) preferred to purchase feed or lease additional grazing area, followed by reducing the herd (38% of livestock producers). The remaining options were favored by very few producers, as only 8% preferred changing livestock type and 4% preferred transitioning out of livestock production.
Producers were then asked which one of the four drought management strategies they would adopt, assuming a drought causing large grazing efficiency reductions but specifying the expected loss in grazing efficiency (varying at 20%, 40%, 60%, and 80%). As shown (Table 2, panel B), producers preferred to purchase feed or lease additional grazing area. They are most likely to choose this strategy, regardless of whether information about grazing efficiency losses is provided or not (ranked first in both cases). The odds of producers choosing to reduce the herd are 56% smaller, although not statistically significant. However, producers are significantly less likely to adopt the remaining two strategies: transition out of livestock production (96% less likely than the most preferred strategy) and change livestock type (98% less likely). In summary, the rank of the four strategies changes slightly when information about grazing efficiency losses is provided but does not change producer preferences for the strategies overall.
Table 2 - Producer Preferences for Drought Management Strategies
| Strategy3 | A. No grazing efficiency information provided | B. Grazing efficiency information provided | ||
|---|---|---|---|---|
| Rank | % of respondents1 | Rank | Odds of choosing strategy2 | |
| Purchase feed/lease additional grazing area. | 1 | 50% | 1 | Baseline |
| Reduce the herd. | 2 | 38% | 2 | -56% |
| Change livestock type. | 3 | 8% | 4 | -98%** |
| Transition out of livestock production. | 4 | 4% | 3 | -96%** |
Notes. ** denote significance at 5% level.
1Percentages represent the share of respondents who selected a given strategy as most preferred.
2Odds of choosing a strategy relative to the most preferred (#1) strategy. For example, the odds of producers choosing to change livestock type are 98% smaller than the odds of purchasing additional feed. A 0% would indicate that the odds of choosing a given strategy are the same as the odds of choosing the base strategy.
3While other strategies exist, such as sending livestock out of state, including only these primary strategies kept the experiment within recommended lengths.
Producer preferences for drought management strategies may differ across producer subgroups. Table 3 reports the probability (percentage) of selecting a given strategy relative to purchasing feed/leasing additional grazing area, the most preferred strategy, assuming no grazing efficiency reduction. Statistically significant changes in odds are highlighted in bold.
Table 3 - Preferences for Drought Management Strategies by Producer Subgroups
| Characteristic | Category | Reduce the herd | Transition out of livestock | Change livestock type |
|---|---|---|---|---|
| Gender | Male | -57% | -96% | -97% |
| Female | +32% | -70% | -94% | |
| Primary sales outlet | Direct | -32% | -92% | -98% |
| Others | -65% | -95% | -96% | |
| Animals managed (number) | <51 | +256% | -100% | -68% |
| 51–200 | -38% | -86% | -96% | |
| >200 | -95% | -100% | -100% | |
| Primary livestock type | Other than cattle | -20% | -100% | -85% |
| Cattle | -55% | -93% | -98% | |
| Production methods used | Only conventional | -69% | -91% | -99% |
| Differentiated | -43% | -100% | -98% | |
| Large reduction in grazing efficiency | 0–39% | -39% | -100% | -76% |
| 40–59% | -29% | -89% | -100% | |
| 60–99% | -36% | -86% | -100% |
Note. Bold font indicates that the percentage change in the odds of selecting given strategy relative to the base (most preferred) strategy is significant within the producer subgroup.
 Generally, purchasing feed/leasing additional grazing area (base strategy) and herd reduction, both relatively less complicated solutions, are similarly preferred and more likely chosen over the other two strategies across the subgroups, with some exceptions. Producers not using direct sales methods, managing more than 200 animals, and using only conventional production methods are 65%, 95%, and 69% less likely to choose herd reduction compared to the base strategy. On the other hand, women producers, those utilizing wholesale marketing, managing 51–200 animals, using only conventional production methods, and those considering 60–99% grazing efficiency reduction significant, are not less likely to choose transitioning out of livestock production compared to the base strategy. Also, producers managing 50 animals or less, primarily raising livestock other than cattle, and considering grazing efficiency reductions of 0–39% significant are not less likely to choose changing livestock type compared to the base strategy.
Those managing more than 200 animals differ most from the other subgroups as they prefer almost exclusively the base strategy and are 95–100% less likely to select other strategies. Finally, producers were asked under what conditions they would sell their herd off completely. The primary reason given was no or minimal pasture/forage, followed by no water/irrigation, a multi-year drought, and high feed costs. Approximately 12% would not sell their herd under any circumstances.
Conclusions
Drought conditions would have to be very serious and long-term for livestock producers in Utah to transition out of livestock production. They are more likely to purchase feed or lease additional pasture and reduce the herd than change livestock type or transition out of livestock production. Also, livestock producers are not considerably sensitive to grazing efficiency losses or drought severity as it didn’t impact their preferences among strategies. However, we do find some differences in preferences for the strategies across producer subgroups. Policies to improve uptake of drought management strategies should target producer-preferred options as they are more likely to be successful. As study results presented here only represent a small number of producers, future studies to inform policy are warranted.
References
- Bureau of Economic Analysis [BEA]. (2019). Annual GDP by state – real GDP in chained dollars. Retrieved February 2, 2021, from https://apps.bea.gov/iTable/iTable.cfm?reqid=70&step=1&acrdn=1
- Drugova, T., Curtis, K., & Ward, R. (2021). Producer preferences for drought management strategies in the arid West [Working paper]. Utah State University Applied Economics. https://extension.usu.edu/apec/files/ProducerPreferencesforDroughtManagementStrategiesintheAridWest.pdf
- Hensher, D. A., Rose, J. M., & Greene, W. H. (2005). Applied choice analysis: A primer. Cambridge University Press.
- Holupchinski, E., Alvarez-Berrios, N., Gould, W., & Fain, J. (n.d.) Drought impacts to livestock. USGS Climate Adaptation Science Center. https://www.usgs.gov/ecosystems/climate-adaptation-science-centers/drought-impacts-livestock-us-caribbean
- Howitt, R., MacEwan, D., Medellín-Azuara, J., Lund, J., & Sumner, D. (2017). Economic analysis of the 2015 drought for California agriculture. University of California, Davis, Center for Watershed Sciences.
- Lal, R., Delgado, J.A., Gulliford, J., Nielsen, D., Rice, C.W., & Van Pelt, R.S. (2012). Adapting agriculture to drought and extreme events. Journal of Soil and Water Conservation 67(6),162A–166A.
- National Integrated Drought Information System [NIDIS]. (2020). Drought in Utah. https://www.drought.gov/drought/states/utah
- United States Department of Agriculture Economic Research Service [USDA ERS]. (2019). Irrigation & water use. https://www.ers.usda.gov/topics/farm-practices-management/irrigation-water-use/
- United States Department of Agriculture National Agricultural Statistics Service [USDA NASS]. (2017). Census of agriculture, Utah state profile. https://www.nass.usda.gov/Publications/AgCensus/2017/Online_Resources/County_Profiles/Utah/cp99049.pdf
Date Published: April 2021
Authors
Kynda Curtis, Professor and Extension Specialist, Department of Applied Economics; Tatiana Drugova, Postdoctoral Fellow, Department of Applied Economics; Ruby Ward, Professor and Extension Specialist, Department of Applied Economics

Kynda Curtis
Food Systems Specialist
APEC Dept

Ruby Ward
Agricultural Entrepreneurship Specialist
APEC Dept
Related Research
Drought-Tolerant Options for Southwest Agriculture: Ornamentals, Herbs, and Cosmetics
This fact sheet is the third in a series of three that provide an overview of drought-tolerant crops, grasses, and native plants, which may assist in maintaining agricultural production for food, feed, and cosmetics and sustain grasslands and rangelands i
Drought-Tolerant Options for Southwest Agriculture: Grasses, Grains, and Legumes
This fact sheet is the first in a series of three that provide an overview of drought-tolerant crops, grasses, and native plants, which may assist in maintaining agricultural production for food and feed and sustain grasslands and rangelands in the arid S
Drought-Tolerant Options for Southwest Agriculture: Edible Produce
This fact sheet is the second in a series of three that provide an overview of drought-tolerant crops, grasses, and native plants, which may assist in maintaining agricultural production for food and feed and sustain grasslands and rangelands in the arid
Impacts of Drought on Tribal Economies in Arizona
The objective of this fact sheet is to illustrate the economic impacts of drought on agriculture and reservation economies in Arizona. Arizona is the fourth driest state in the United States, with an average yearly precipitation of 11.24 inches, and 78% o
Impacts of Drought on Tribal Economies in Nevada
The objective of this fact sheet is to illustrate the economic impacts of drought on agriculture and reservation economies in Nevada. Nevada is the driest state in the United States, with an average yearly precipitation of 9.96 inches, and 71% of the stat
Impacts of Drought on Tribal Economies in New Mexico
This fact sheet will illustrate the potential economic impacts of drought on agriculture and reservation economies in New Mexico. New Mexico is the fifth driest state in the United States, with average yearly precipitation of 13.38 inches, and 69% of the
Economic Impacts of Drought in Utah: Uintah and Ouray Reservation
The objective of this fact sheet is to illustrate the economic impacts of drought on agriculture and the economy of the Uintah and Ouray Reservation in Utah. Utah is the second driest state in the United States, with average yearly precipitation of 13.34
Utah Fresh Produce Grower Preferred Drought Management Strategies
This fact sheet, the first in a series of three, examines the preferred drought management strategies of fresh produce growers and how their preferences change depending on drought severity and expected yields. Severe drought in fresh produce production c
Utah Hay and Forage Grower: Preferred Drought Management Strategies
This fact sheet, the third in a series of three, examines the preferred drought management strategies of hay and forage growers and how their preferences change depending on drought severity and expected yields. Severe drought in forage production causes
Utah Livestock Producer Preferred Drought Management Strategies
This fact sheet, the second in a series of three, examines livestock producer preferred drought management strategies and how producer preferences change depending on drought severity and expected grazing efficiency.