Utah Fresh Produce Grower Preferred Drought Management Strategies
Introduction
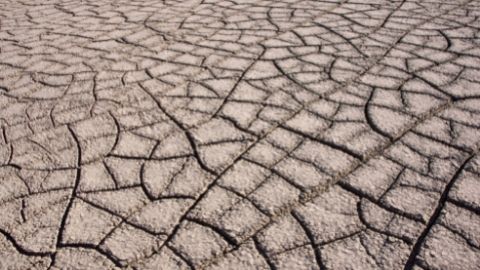
Utah is the third driest state in the United States, with 65% of the state experiencing abnormally dry conditions from 2000 to 2019 (NIDIS, 2020). In 2018 and 2019, 38% of the state experienced severe drought (NIDIS, 2020). Agricultural production is critical to the Utah economy, contributing just over 2% of gross domestic product (GDP) annually (BEA, 2019). Fresh produce production is especially important as fresh produce sales generate $56 million each year (USDA NASS, 2017). However, agricultural production puts great demands on water resources as agriculture consumes 80% of all water in the United States (USDA ERS, 2019). Hence, agricultural adaption to drought will be critical to maintaining food and feed production and supporting the Utah economy and its rural communities, as rural areas are often severely impacted by persistent drought (Lal et al., 2012; Howitt et al., 2017).
A study by Drugova, Curtis, and Ward (2021) examined agricultural producer preferences for drought management strategies and how their preferences shift in response to varying drought levels and crop losses. Study data were collected through choice experiments1 conducted in Utah at producer meetings and online in 2019 for fresh produce growers, hay and forage growers, and livestock producers.
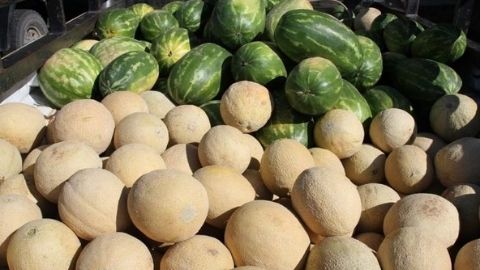
This fact sheet, the first in a series of three, examines the preferred drought management strategies of fresh produce growers and how their preferences change depending on drought severity and expected yields. Severe drought in fresh produce production causes stunted growth resulting in smaller, lower quality produce, as well as increased vulnerability to pests, all of which result in large economic losses (Holupchinski et al., n.d.). Water shortages are also common, with restrictions on use commonly imposed, especially in the late summer months. Hence, extended drought poses a threat to agricultural productivity and the economies of rural and tribal areas in Utah.
1Choice experiments are used to evaluate the decision process and value an individual places on a good, service, or situation/policy with specific characteristics. Field choice experiments normally have from 20–80 participants with an average size of 50 (Hensher, Rose, & Green, 2005).
Grower Characteristics
Twenty-six fresh produce growers participated in the study, but only 20 completed the necessary choice sets, and thus, were included in the final sample. The majority farm on 10 acres of land or less (84%), primarily grow vegetables (85%), sell directly to consumers (70%), and use drip irrigation systems (75%). Also, 80% have used mulch applications, and 55% have used windbreaks and cover crops, which are water-saving technologies (Yost et al., 2019; Stein, 2011). Finally, half of the growers considered crop losses of 40–59% significant, while 40% were more sensitive to crop losses, considering losses under 40% significant. Table 1 provides an overview of grower characteristics.
Table 1 - Characteristics of Study Fresh Produce Growers
| Characteristic | Category | Count | % share |
|---|---|---|---|
| Primary operator gender | Male | 10 | 53% |
| Female | 9 | 47% | |
| Primary sales outlet | Direct | 14 | 70% |
| Direct & wholesale | 5 | 25% | |
| Other | 1 | 5% | |
| Acres farmed | <=10 | 16 | 84% |
| 11–25 | 1 | 5% | |
| 26–100 | 0 | 0% | |
| >100 | 2 | 11% | |
| Primary crop | Vegetables | 17 | 85% |
| Tree fruit | 2 | 10% | |
| Other | 1 | 5% | |
| Primary irrigation system | Flood | 2 | 10% |
| Pivot | 1 | 5% | |
| Drip | 15 | 75% | |
| Other | 2 | 10% | |
| Mulch applications used previously | Yes | 16 | 80% |
| No | 4 | 20% | |
| Wind breaks used previously | Yes | 11 | 55% |
| No | 9 | 45% | |
| Cover crops used previously | Yes | 11 | 55% |
| No | 9 | 45 | |
| What is a large % of crop loss to you? | 60–79% | 2 | 10% |
| 40–59% | 10 | 50% | |
| 20–39% | 6 | 30% | |
| <20% | 2 | 10% | |
| Number of respondents | - | 20 | 100% |
Note: Sum of responses per characteristic may not add up to 20 (not all questions were completed).
Preferred Strategies
 Fresh produce growers were asked to select their most preferred drought management strategy from a list of options, assuming a drought causing large crop losses but not specifying a specific yield or amount of loss for each strategy. The results (Table 2, panel A) show that most fresh produce growers (40%) preferred to adopt a water-saving technology. Transitioning to a more efficient irrigation system and sacrificing lower-value crops were preferred by 25% of the growers, while changing to a drought-resistant crop was most preferred by 10%. None of the growers selected moving out of farming as their most preferred strategy.
Growers were then asked whether or not they would adopt a specific drought management strategy, assuming a drought causing large crop losses but specifying the expected yield or amount of the crop harvested (40%, 60%, and 80% for each strategy) if they adopt the strategy. The three offered strategies were adopting a water-saving technology, switching to a drought-resistant variety, and sacrificing lower-value crops. Grower responses were used to estimate the minimum yield (percentage of normal) growers require in order to adopt a specific strategy and determine their preference among the strategies (Table 2, panel B). Lower values represent higher willingness to adopt a strategy (and higher preference).
Growers are willing to adopt a water-saving technology if they can harvest at least 36% of their crop, making it the most preferred strategy. Growers prefer this strategy, regardless of whether information about crop yield is provided or not (ranked first in both cases). Growers need to harvest at least 53.3% of their crop in order to change to a drought-resistant crop/variety and 56.6% to sacrifice lower-value crops. The rank of these two strategies depends on whether information about crop yields under each strategy was provided (Table 2). In summary, growers may change their preferences for a drought management strategy depending on the resulting yield, which in turn depends on drought severity.
Table 2 - Grower Preferences for Drought Management Strategies
| Strategy3 | A. No crop yield information provided | B. Crop yield information provided | ||
|---|---|---|---|---|
| Rank | % of respondents1 | Rank | Crop harvested2 | |
| Adopt a water-saving technology. | 1 | 40% | 1 | 36.0%** |
| Change to a more water efficient irrigation system. | 2 | 25% | - | - |
| Sacrifice lower-value crops. | 2 | 25% | 3 | 56.6%*** |
| Change to a drought-resistant crop/variety. | 3 | 10% | 2 | 53.3%*** |
| Move out of farming/fallow land. | 4 | 0% | - | - |
Notes. *** and ** denote significance at 1% and 5% level, respectively.
1Percentages represent the share of respondents who selected the given strategy as most preferred.
2Percentages represent required minimum % yield. Lower value indicates a more preferred strategy.
3While other strategies exist, including these primary strategies kept the experiment within recommended lengths.
Grower preferences for the drought management strategies also differ across grower subgroups. Table 3 reports the minimum crop yield percentage required within each grower subgroup for a given strategy. Statistically significant differences between the subgroups are highlighted in bold.
Table 3 - Preferences for Drought Management Strategies by Grower Subgroups
| Characteristic | Category | Adopt a water-saving technology | Switch to a drought-resistant variety | Sacrifice lower-value crops |
|---|---|---|---|---|
| Primary operator gender | Male | 39.1% | 62.3% | 53.6% |
| Female | 34.8% | 39.4% | 58.5% | |
| Primary sales outlet | Direct only | 40.7% | 54.3% | 59.9% |
| Other | 24.7% | 51.2% | 49.4% | |
| Acres farmed | <=10 acres | 37.6% | 48.6% | 57.1% |
| >10 acres | 16.2% | 81.6% | 56.5% | |
| Primary crop | Vegetables | 36.9% | 48.9% | 55.4% |
| Other | 32.4% | 80.9% | 63.4% | |
| Primary irrigation system | Drip | 41.5% | 53.7% | 60.6% |
| Other | 14.5% | 52.1% | 45.2% | |
| Mulch applications used previously | Yes | 38.0% | 48.7% | 57.1% |
| No | 28.9% | 72.5% | 54.8% | |
| Wind breaks used previously | Yes | 31.9% | 46.7% | 51.4% |
| No | 41.0% | 61.4% | 63.3% | |
| Cover crops used previously | Yes | 40.4% | 49.1% | 62.8% |
| No | 30.7% | 58.5% | 48.8% | |
| Large % of crop loss | <40% | 36.1% | 46.7% | 51.4% |
| =>40% | 36.1% | 57.8% | 60.0% |
Note. Bold font indicates that the minimum required percentage yield required to adopt is significantly different between the subgroups within a characteristic.
Growers who primarily use drip irrigation are less willing to adopt a water-saving technology. Switching to a drought-resistant variety is preferred more by women and by those who farm on 10 acres or less, primarily grow vegetables, and previously used mulch applications. Sacrificing lower-value crops is preferred more by those who use irrigation systems other than drip, have used windbreaks before, and have not used cover crops. Finally, fresh produce growers were asked under what conditions they would stop farming. The primary response was no water availability, followed by high water costs and lack of sufficient water. Approximately 13% would not stop farming under any conditions.
Conclusions
 Drought conditions would have to be very serious and long-term for fresh produce growers in Utah to exit farming. They are more likely to adopt water-saving technologies as a drought management strategy than switch to a drought-resistant crop/variety or sacrifice lower-value crops. Also, growers are sensitive to the expected yield and associated drought severity since it influenced their willingness to adopt each strategy. In addition, we find some differences in preferences for the strategies across grower subgroups.
Finally, information about expected yields under each drought management strategy and drought scenario is important to the decision-making process, and thus, growers would benefit greatly from such information. Policies to improve uptake of drought management strategies should target grower-preferred options as they are more likely to be successful. As study results presented here only represent a small number of growers, future studies to inform policy are warranted.
References
- Bureau of Economic Analysis [BEA]. (2019). Annual GDP by state – real GDP in chained dollars. Retrieved February 2, 2021, from https://apps.bea.gov/iTable/iTable.cfm?reqid=70&step=1&acrdn=1
- Drugova, T., Curtis, K., & Ward, R. (2021). Producer preferences for drought management strategies in the arid West [Working paper]. Utah State University Applied Economics. https://extension.usu.edu/apec/files/ProducerPreferencesforDroughtManagementStrategiesintheAridWest.pdf
- Hensher, D. A., Rose, J. M., & Greene, W. H. (2005). Applied choice analysis: A primer. Cambridge University Press.
- Holupchinski, E., Alvarez-Berrios, N., Gould, W., & Fain, J. (n.d.). Drought impacts on crops. USGS Climate Adaptation Science Center. https://www.usgs.gov/ecosystems/climate-adaptation-science-centers/drought-impacts-crops-us-caribbean
- Howitt, R., MacEwan, D., Medellín-Azuara, J., Lund, J., & Sumner, D. (2017). Economic analysis of the 2015 drought for California agriculture. University of California, Davis, Center for Watershed Sciences.
- Lal, R., Delgado, J.A., Gulliford, J., Nielsen, D., Rice, C.W., & Van Pelt, R.S. (2012). Adapting agriculture to drought and extreme events. Journal of Soil and Water Conservation 67(6), 162A–166A.
- National Integrated Drought Information System [NIDIS]. (2020). Drought in Utah. https://www.drought.gov/drought/states/utah
- Stein, L. (2011). Drought management for horticulture crops. Texas A&M University Earth-King Landscaping publication. https://aggie-horticulture.tamu.edu/earthkind/drought/drought-management-for-commercial-horticulture/drought-management-for-horticultural-crops/
- United States Department of Agriculture Economic Research Service [USDA ERS]. (2019). Irrigation & water use. https://www.ers.usda.gov/topics/farm-practices-management/irrigation-water-use/
- United States Department of Agriculture National Agricultural Statistics Service [USDA NASS]. (2017). Census of agriculture, Utah state profile. https://www.nass.usda.gov/Publications/AgCensus/2017/Online_Resources/County_Profiles/Utah/cp99049.pdf
- Yost, M., Sorensen, B., Creech, E., Allen, N., Larsen, R., Ramirez, R., Ransom, C., Reid, C., Gale, J., & Kitchen, B. (2019). Defense against drought. All Current Publications, Paper 1994. Utah State University Extension. https://digitalcommons.usu.edu/extension_curall/1994/
Date Published: April 2021
Authors
Kynda Curtis, Professor and Extension Specialist, Department of Applied Economics; Tatiana Drugova, Postdoctoral Fellow, Department of Applied Economics; Ruby Ward, Professor and Extension Specialist, Department of Applied Economics

Kynda Curtis
Food Systems Specialist
APEC Dept

Ruby Ward
Agricultural Entrepreneurship Specialist
APEC Dept
Related Research
Drought-Tolerant Options for Southwest Agriculture: Ornamentals, Herbs, and Cosmetics
This fact sheet is the third in a series of three that provide an overview of drought-tolerant crops, grasses, and native plants, which may assist in maintaining agricultural production for food, feed, and cosmetics and sustain grasslands and rangelands i
Drought-Tolerant Options for Southwest Agriculture: Grasses, Grains, and Legumes
This fact sheet is the first in a series of three that provide an overview of drought-tolerant crops, grasses, and native plants, which may assist in maintaining agricultural production for food and feed and sustain grasslands and rangelands in the arid S
Drought-Tolerant Options for Southwest Agriculture: Edible Produce
This fact sheet is the second in a series of three that provide an overview of drought-tolerant crops, grasses, and native plants, which may assist in maintaining agricultural production for food and feed and sustain grasslands and rangelands in the arid
Impacts of Drought on Tribal Economies in Arizona
The objective of this fact sheet is to illustrate the economic impacts of drought on agriculture and reservation economies in Arizona. Arizona is the fourth driest state in the United States, with an average yearly precipitation of 11.24 inches, and 78% o
Impacts of Drought on Tribal Economies in Nevada
The objective of this fact sheet is to illustrate the economic impacts of drought on agriculture and reservation economies in Nevada. Nevada is the driest state in the United States, with an average yearly precipitation of 9.96 inches, and 71% of the stat
Impacts of Drought on Tribal Economies in New Mexico
This fact sheet will illustrate the potential economic impacts of drought on agriculture and reservation economies in New Mexico. New Mexico is the fifth driest state in the United States, with average yearly precipitation of 13.38 inches, and 69% of the
Economic Impacts of Drought in Utah: Uintah and Ouray Reservation
The objective of this fact sheet is to illustrate the economic impacts of drought on agriculture and the economy of the Uintah and Ouray Reservation in Utah. Utah is the second driest state in the United States, with average yearly precipitation of 13.34
Utah Fresh Produce Grower Preferred Drought Management Strategies
This fact sheet, the first in a series of three, examines the preferred drought management strategies of fresh produce growers and how their preferences change depending on drought severity and expected yields. Severe drought in fresh produce production c
Utah Hay and Forage Grower: Preferred Drought Management Strategies
This fact sheet, the third in a series of three, examines the preferred drought management strategies of hay and forage growers and how their preferences change depending on drought severity and expected yields. Severe drought in forage production causes
Utah Livestock Producer Preferred Drought Management Strategies
This fact sheet, the second in a series of three, examines livestock producer preferred drought management strategies and how producer preferences change depending on drought severity and expected grazing efficiency.