Targeting Farmers’ Markets in Utah: Understanding Fresh Produce Pricing
Introduction
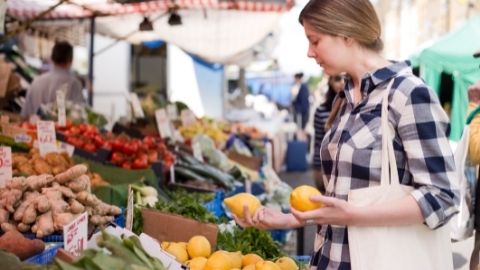
For produce growers, determining the appropriate price for their products at direct markets such as farmers’ markets can be complicated. Prices are influenced by many factors such as customer preferences and market conditions, production method used (organic versus conventional), seasonality, and sales location. A recent study collected fresh produce prices at grocery stores and farmers’ markets across Northern Utah and compared pricing by production method, location, and market type across a 2-year span (Salisbury, 2018). The study found that pricing varied greatly by item, seasonality and location. This fact sheet focuses primarily on farmers’ market price comparisons to assist fresh produce growers in determining which produce varieties have the highest premiums, the range of prices they can expect, and any considerations for production method, seasonality and market location. This information will be useful for growers as they develop production plans and a marketing strategy, including varieties and farmers’ market locations that may be most profitable.
Fresh Produce Prices
Fresh produce prices were collected across a 2-year period, June to October 2016 and June to September 2017. Produce prices were collected at eight farmers’ markets and 14 local and national grocery stores in Utah. The four farmers’ markets in Northern Utah that included in the study were the Cache Valley Gardner’s Market in Logan, the Ogden Farmers’ Market, the USU Botanical Center Farmers’ Market in Kaysville, and the Salt Lake City Downtown Farmers’ Market. Vendors at these markets were randomly selected and only items that were comparable to those available in grocery stores were used. Each pricing observation included the produce item, market name, location, production practice (organic vs. conventional), and normalized price in dollars per pound.
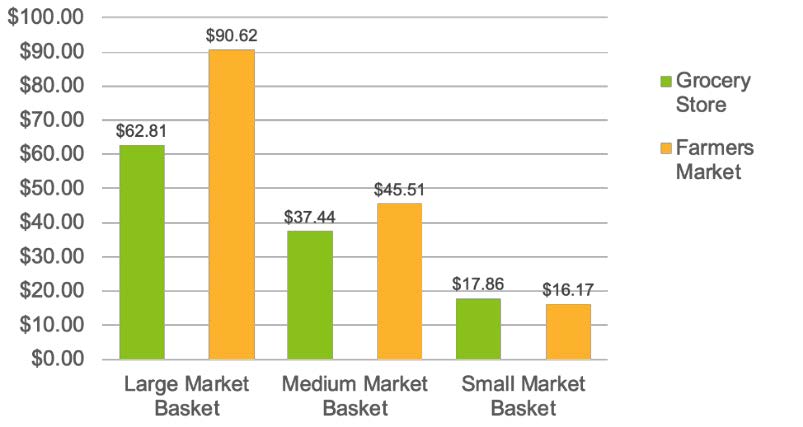
Price comparisons were made between individual produce items, as well as varying-sized baskets (large, medium, and small baskets1) of produce for each market. The market baskets comprised of the most commonly consumed produce items for a four-person household for 1 month. Produce selection for the small basket contained produce items with the most farmers’ markets pricing observations.
1Large Market Basket Contents (18 items): Broccoli, Green Cabbage, Carrots, Sweet Corn, Cucumbers, Garlic, Yellow Onions, Green Bell Peppers, Red Potatoes, Green Beans, Romaine, Spinach, Zucchini, Vine Tomatoes, Raspberries, Strawberries, Cantaloupe, Watermelon. Medium Market Basket Contents (10 items): Carrots, Sweet Corn, Cucumbers, Garlic, Green Bell Peppers, Red Potatoes, Zucchini,
Produce Product Selection
As growers choose which crops to grow and sell, determining which product varieties are most profitable is helpful. They should consider consumer preferences and willingness to pay as well as the input costs associated with different produce items. For example, demand for organic produce continues to rise, but growers incur additional costs to produce and certify these products (FAO, 2019). In the study, only items that were certified organic were classified as such.
Organic versus conventional produce pricing comparisons
Across all farmer’s markets 18 of 30 organic produce items were sold at a premium over their conventionally-grown counterparts. For grocery stores, 29 of 30 organic produce items were more expensive than their conventionally-grown counterparts. Growers should keep in mind although organic-certified products can bring premium pricing, they are only profitable if the additional production costs are offset. Location also plays an important role for organic produce. The Salt Lake City Downtown Farmers’ Market had the largest selection of organic produce, suggesting that there is a higher demand for organics in that location. The market for organic produce is not as strong in other locations in Utah.
As shown in Table 1, 20 of 25 organic items were priced higher at the SL Downtown Farmers’ Market, with broccoli, green beans, red onions, white onions, gold potatoes, and spinach bringing the highest premiums. Conventionally grown carrots, sweet onions, sweet corn, and red potatoes were actually priced higher than their organic counterparts. Hence, these crops don’t provide the premiums that may be needed to cover the additional organic production costs.
Product Specific Pricing Comparisons
In comparing the average price of conventional produce at a farmers’ market and grocery stores, farmers’ market prices were generally higher (19 of 30 produce items) (see Table 2). For the most common or abundant produce at both farmers’ markets and grocery stores, i.e., cucumbers, green beans, corn, and vine tomatoes, there is not much difference between the two. Growers that offer a wide variety of produce at their booth, including unique or specialty varieties, will have a better chance of securing price premiums. For example, growers might consider offering comparable grocery stores prices for items such as cucumbers, zucchini, and bell peppers to attract customers to their booth and then promote sales of premium-priced items such as strawberries, Romaine, garlic, carrots, and spinach.
Table 1: Organic and Conventional Produce Price Comparison: SL Downtown Farmers’ Market
| Produce Item | Conventional ($/lb) | Organic ($/lb) | Produce Item | Conventional ($/lb) | Organic ($/lb) |
|---|---|---|---|---|---|
| Beets | $2.02 | $2.62 | Onions White | $0.95 | $2.60 |
| Broccoli | $2.32 | $6.33 | Onions Yellow | $1.14 | $2.08 |
| Cabbage Green | $0.84 | $2.00 | Potatoes Gold | $1.30 | $2.10 |
| Cabbage Napa | $1.44 | - | Potatoes Red | $2.20 | $2.17 |
| Cabbage Red | $1.08 | $1.50 | Potatoes Russet | $1.00 | $2.18 |
| Cantaloupe | $0.69 | - | Raspberries | $6.94 | - |
| Carrots | $2.02 | $2.07 | Romaine Lettuce | $2.59 | $3.53 |
| Cucumbers English | $1.68 | - | Spinach | $5.00 | $16.00 |
| Cucumbers Normal | $1.37 | $2.13 | Strawberries | $7.56 | $9.38 |
| Garlic | $8.96 | $5.57 | Sweet Corn | $0.50 | $0.49 |
| Green Beans | $2.97 | $4.26 | Tomatoes Cherry | $4.33 | $5.58 |
| Green Bell Pepper | $1.45 | $2.23 | Tomatoes Roma | $1.68 | $2.15 |
| Mixed Greens | $6.95 | $8.00 | Tomatoes Slicing/Vine | $1.85 | $2.53 |
| Onions Red | $1.54 | $3.30 | Watermelon | $0.44 | - |
| Onions Sweet | $1.41 | $1.31 | Zucchini | $1.14 | $2.86 |
Table 2: Average Price Comparison: Conventional Produce at Farmers’ Markets and Grocery Stores in Northern Utah
| Produce Item | Farmers' Market ($/lb) | Grocery Store ($/lb) | Produce Item | Farmers' Market ($/lb) | Grocery Store ($/lb) |
|---|---|---|---|---|---|
| Beets | $1.53 | $1.30 | Onions White | $1.49 | $1.15 |
| Broccoli | $2.84 | $1.49 | Onions Yellow | $1.19 | $0.74 |
| Cabbage Green | $0.92 | $0.71 | Potatoes Gold | $1.29 | $1.04 |
| Cabbage Napa | $1.48 | $1.52 | Potatoes Red | $1.57 | $0.93 |
| Cabbage Red | $0.96 | $1.03 | Potatoes Russet | $0.97 | $0.66 |
| Cantaloupe | $0.78 | $0.54 | Raspberries | $7.38 | $9.56 |
| Carrots | $2.15 | $0.77 | Romaine Lettuce | $4.05 | $1.23 |
| Cucumbers English | $6.94 | $3.77 | Spinach | $5.05 | $1.98 |
| Cucumbers Normal | $1.09 | $1.09 | Strawberries | $5.33 | $2.60 |
| Garlic | $6.94 | $3.77 | Sweet Corn | $0.44 | $0.49 |
| Green Beans | $2.89 | $2.49 | Tomatoes Cherry | $3.82 | $4.94 |
| Green Bell Pepper | $1.50 | $1.71 | Tomatoes Roma | $1.57 | $1.20 |
| Mixed Greens | $6.79 | $6.93 | Tomatoes Slicing/Vine | $1.63 | $1.61 |
| Onions Red | $1.82 | $1.38 | Watermelon | $0.42 | $0.45 |
| Onions Sweet | $1.32 | $1.17 | Zucchini | $0.88 | $1.36 |
Table 3: Conventional Large Basket Fresh Produce Price Comparison for Farmers’ Markets
| Total Consumption (4 person HH/month) | SLC Downtown Farmers' Market | Ogden Farmers' Market | USU Botanical Center Farmers' Market Kaysville | Cache Valley Gardeners' Market Logan | ||
|---|---|---|---|---|---|---|
| Broccoli | 2 head | 2.07 lbs | $6.77 | $5.88 | $3.24 | $6.62 |
| Green Cabbage | 1 head | 2.71 lbs | $2.14 | $2.49 | $2.49 | $2.72 |
| Carrots | 1 bunch | 2.29 lbs | $4.78 | $5.90 | $4.28 | $4.33 |
| Sweet Corn | 4 ear | 3.98 lbs | $1.99 | $1.87 | $1.88 | $1.32 |
| Cucumbers Normal | 2 each | 1.37 lbs | $1.83 | $1.62 | $1.42 | $1.19 |
| Garlic | 2 clove | 0.57 lbs | $4.76 | $4.54 | $2.18 | $3.85 |
| Yellow Onions | 2 each | 4.39 lbs | $5.79 | $5.99 | $4.70 | $5.82 |
| Green Bell Peppers | 5 each | 2.52 lbs | $3.91 | $4.95 | $3.78 | $3.55 |
| Potatoes Red | 3 bag | 9.29 lbs | $18.70 | $14.34 | $10.49 | $11.65 |
| Green Beans | 0.5 lb | 0.53 lbs | $1.49 | $1.55 | $1.24 | $1.51 |
| Romaine | 2 head | 2.42 lbs | $9.81 | $9.81 | $9.81 | $9.81 |
| Spinach | 1 bag | 0.73 lbs | $3.68 | $3.68 | $3.68 | $2.91 |
| Zucchini (Squash) | 1 each | 1.14 lbs | $1.42 | $0.82 | $0.97 | $0.79 |
| Tomatoes Vine/Slicing | 5 each | 5.01 lbs | $8.57 | $8.67 | $6.99 | $7.52 |
| Raspberries | 1 carton | 0.47 lbs | $3.14 | $3.22 | $3.48 | $3.94 |
| Strawberries | 2 carton | 2.16. lbs | $11.50 | $9.00 | $11.50 | $11.50 |
| Cantaloupe | 1 each | 4.35 lbs | $2.91 | $2.61 | $4.51 | $3.37 |
| Watermelon | 1 each | 12.13 lbs | $5.15 | $4.89 | $5.48 | $5.16 |
| Total Price | $98.34 | $91.84 | $82.12 | $87.56 | ||
Farmers’ Market Location Selection
and Farmers’ Markets
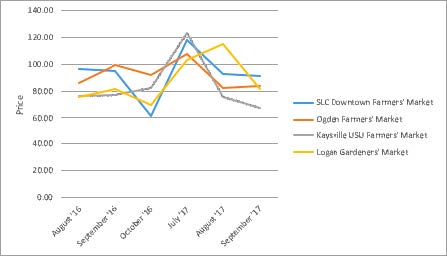
August 2016-September 2017
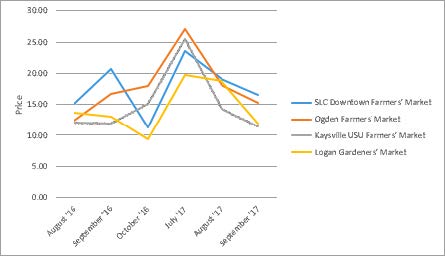
August 2016-September 2017
Location matters, not only because booth fees and travel distance vary depending on farmers’ market location, but because the factors influencing pricing and sales are unique for each market. The grocery stores near farmers’ markets may also influence pricing. Growers will have a difficult time competing against a low-cost grocery store and will have to offer a variety of produce, including discounted items, to attract customers to the farmers’ market. In the study, pricing at farmers’ markets was compared to two grocery stores in the surrounding area. Looking at these results will be helpful to producers in deciding which locations will be the most profitable for their produce items.
The Sale Lake City Downtown farmers’ market was on average the most expensive of the four farmers’ markets compared (see Table 3). Some of the items with the highest premiums included red potatoes, cucumbers normal, zucchini, and broccoli. The Ogden Farmers’ market was the second most expensive of all the locations, but had the highest premiums compared to surrounding grocery stores. This is something that growers should be aware of, as a large basket of conventional produce at the Ogden Farmers’ Market had an 81% premium, or $41 difference, compared to the low-price local grocery store. Logan was the third most expensive farmers’ market and Kaysville the least expensive. In-season fruits, such as raspberries, cantaloupe, and watermelon, were often more expensive at these two markets. Both were competitively priced to their surrounding grocery stores.
For all the farmers’ markets, as basket size decreased, the premiums over the surrounding grocery stores also decreased, as the small basket prices were not only comparable across locations, but nearly equal to surrounding grocery stores. Hence, consumers who purchase a few things as the farmers’ market will find comparable pricing, but larger purchases tend to lead to increased spending at the market. Efforts to increase both the number of products and amount purchased by customers will lead to increased revenues for growers and decreased costs per transaction.
Seasonal Considerations
As shown in Figures 2 and 3, produce pricing can change dramatically across the season. All farmers’ market locations had higher pricing in the early season (July and August). Red potatoes, strawberries and vine tomatoes especially had higher prices during these months. As the season progressed, prices decreased as the abundance of produce items increased. Prices were more stable at grocery stores and did not discount at the end of the season like at the farmers’ market. A potential strategy for growers might be to sell high-priced, early-season produce and then sell late-season local grocery outlets in the fall. Also, growers might consider using season extension methods, such as a hoop house, to plant crops earlier so that products can be sold earlier in the season to take advantage of the higher prices at farmer’s markets in spring and early summer.
For the large market basket, the Ogden market was the most expensive in 2016, but the Logan market was the most expensive in 2017. For the small market basket, the Ogden market and the Salt Lake market were the most expensive, and the Logan market the least expensive. Produce pricing at all markets was lower in 2016 than 2017 on average due to market conditions.
Conclusions
When determining appropriate pricing for fresh produce, a number of factors including location, produce item or variety, production methods, consumer preferences, and seasonality should be taken into consideration. We find that organic produce like berries and tomatoes had high premiums, while more abundant items such as zucchini and corn had small premiums. The SLC downtown farmers’ market had the greatest market for organic products, while the Logan and Kaysville markets were most competitively priced compared to their surrounding grocery stores. There are also seasonal factors, in which farmers’ market produce had the highest prices in early summer but decreased as the season progressed. All these things should be taken into account.
What this fact sheet does not take into consideration is other costs associated with location and growing practice, such as travel, market booth fees, organic certification, etc. It also does not discuss contracts and how to sell to grocery stores. Producers should keep those factors in mind as well when creating their pricing and marketing strategy.
References
- Food and Agriculture Organization of the United Nations (FAO). (2019). “Organic Agriculture.” Online at: http://www.fao.org/organicag/oa-faq/oa-faq5/en/
- Salisbury, K. (2018). “Examining Marketing Channels for Local Produce: Consumer Affordability and Producer Profitability.” Published Thesis, Department of Applied Economics, Utah State University.
This material is based upon work supported by USDA/NIFA under Award Number 2015-49200-24225.
Date Published: May 2019
Authors
Kynda R. Curtis, Professor and Extension Specialist, Department of Applied Economics; Karli Salisbury, Graduate Research Assistant, Department of Applied Economics; Ruby Ward, Professor and Extension Specialist, Department of Applied Economics; Carrie Durward, Associate Professor and Extension Specialist, Department of Nutrition, Dietetics, and Food Science

Kynda Curtis
Food Systems Specialist
APEC Dept

Carrie Durward
Nutrition Specialist
NDFS Dept
Related Research
Consumer Perceptions and Preferences for Utah Fresh and Packaged Fruit
In this fact sheet, we discuss the results of a 2023 study examining Utah consumer perceptions and preferences for Utah fresh and packaged fruit products. Study data were collected online via a Qualtrics survey, and 384 Utah adults completed the survey. U
Fruit Consumption Indicators: Who Consumes More Fruit in Utah?
Given all the potential health benefits of consuming fresh produce, especially fruits, why are Americans not eating enough fruit? Previous studies show that many factors influence fruit consumption, including demographics, socioeconomic status, household
Fruit Production and Opportunities for Growers in Utah
This fact sheet discusses the state of the fruit industry in Utah, its impact on the Utah economy, as well as current challenges the fruit industry faces and opportunities for fruit growers moving forward. These challenges and opportunities underscore the

Target Consumers for Locally Grown Fruit in Utah
This website provides a detailed analysis of the target consumers for locally grown fruits in Utah, emphasizing demographic differences, purchasing patterns, and lifestyle attitudes of those willing to pay premiums for locally sourced produce. It also off

Target Consumers for Organically Grown Fruit in Utah
This website provides an analysis of the target consumers for organically grown fruits in Utah, focusing on demographic characteristics, purchasing behaviors, and attitudes of consumers willing to pay premiums for organic produce. It also offers insights

Utah Consumer Preferences and Willingness to Pay for Specialty Labeled Fruit Products
Understanding consumer attitudes and preferences for specialty labeled foods is a popular area of study. Insights derived from these studies are valuable for producers and marketers to assess whether their products meet consumer needs and which certificat
Utah Fruit Grower Assessment Results Overview
Fruit growers throughout Utah manage operations of varying sizes and sell their fruit products fresh or processed through various direct-to-consumer and wholesale markets. To better understand the fruit products under production and current marketing meth
Farm Shops: A Direct-to-Consumer Extended Season Opportunity
This fact sheet discusses the impact of the expanding food tourism and local food movements on the demand for locally-produced goods, how farms shops can cater to that demand, the advantages and disadvantages of farms shops for both growers and consumers,
Targeting Farmers’ Markets in Utah: Understanding Fresh Produce Pricing
This fact sheet focuses primarily on farmers’ market price comparisons to assist fresh produce growers in determining which produce varieties have the highest premiums, the range of prices they can expect, and any considerations for production method, sea
Estimating Market Size and Price for Fresh Produce Sales
loans. This fact sheet discusses the process and tools available for estimated market size, as well as assessing profitable pricing, along with examples and pricing resources for fresh produce and food products.
Fresh Produce Direct Market Sales Considerations
Due to increased consumer demand for locally produced and organic produce, many consumers are willing to pay a premium for fresh, high-quality, local produce, creating profit opportunities for growers who direct market profits. Also, direct markets allow
What Determines Produce Pricing in Utah?
This fact sheet provides a comparison of fresh produce prices at farmers’ markets and grocery stores in Utah. It also discusses the price impacts for various item characteristics, including variety, market location, seasonality, and production methods (Sa

Target Market Identification and Data Collection Methods
This fact sheet provides information on how to define a target market for a product or service, followed by methods for collecting data on targeted consumer groups.