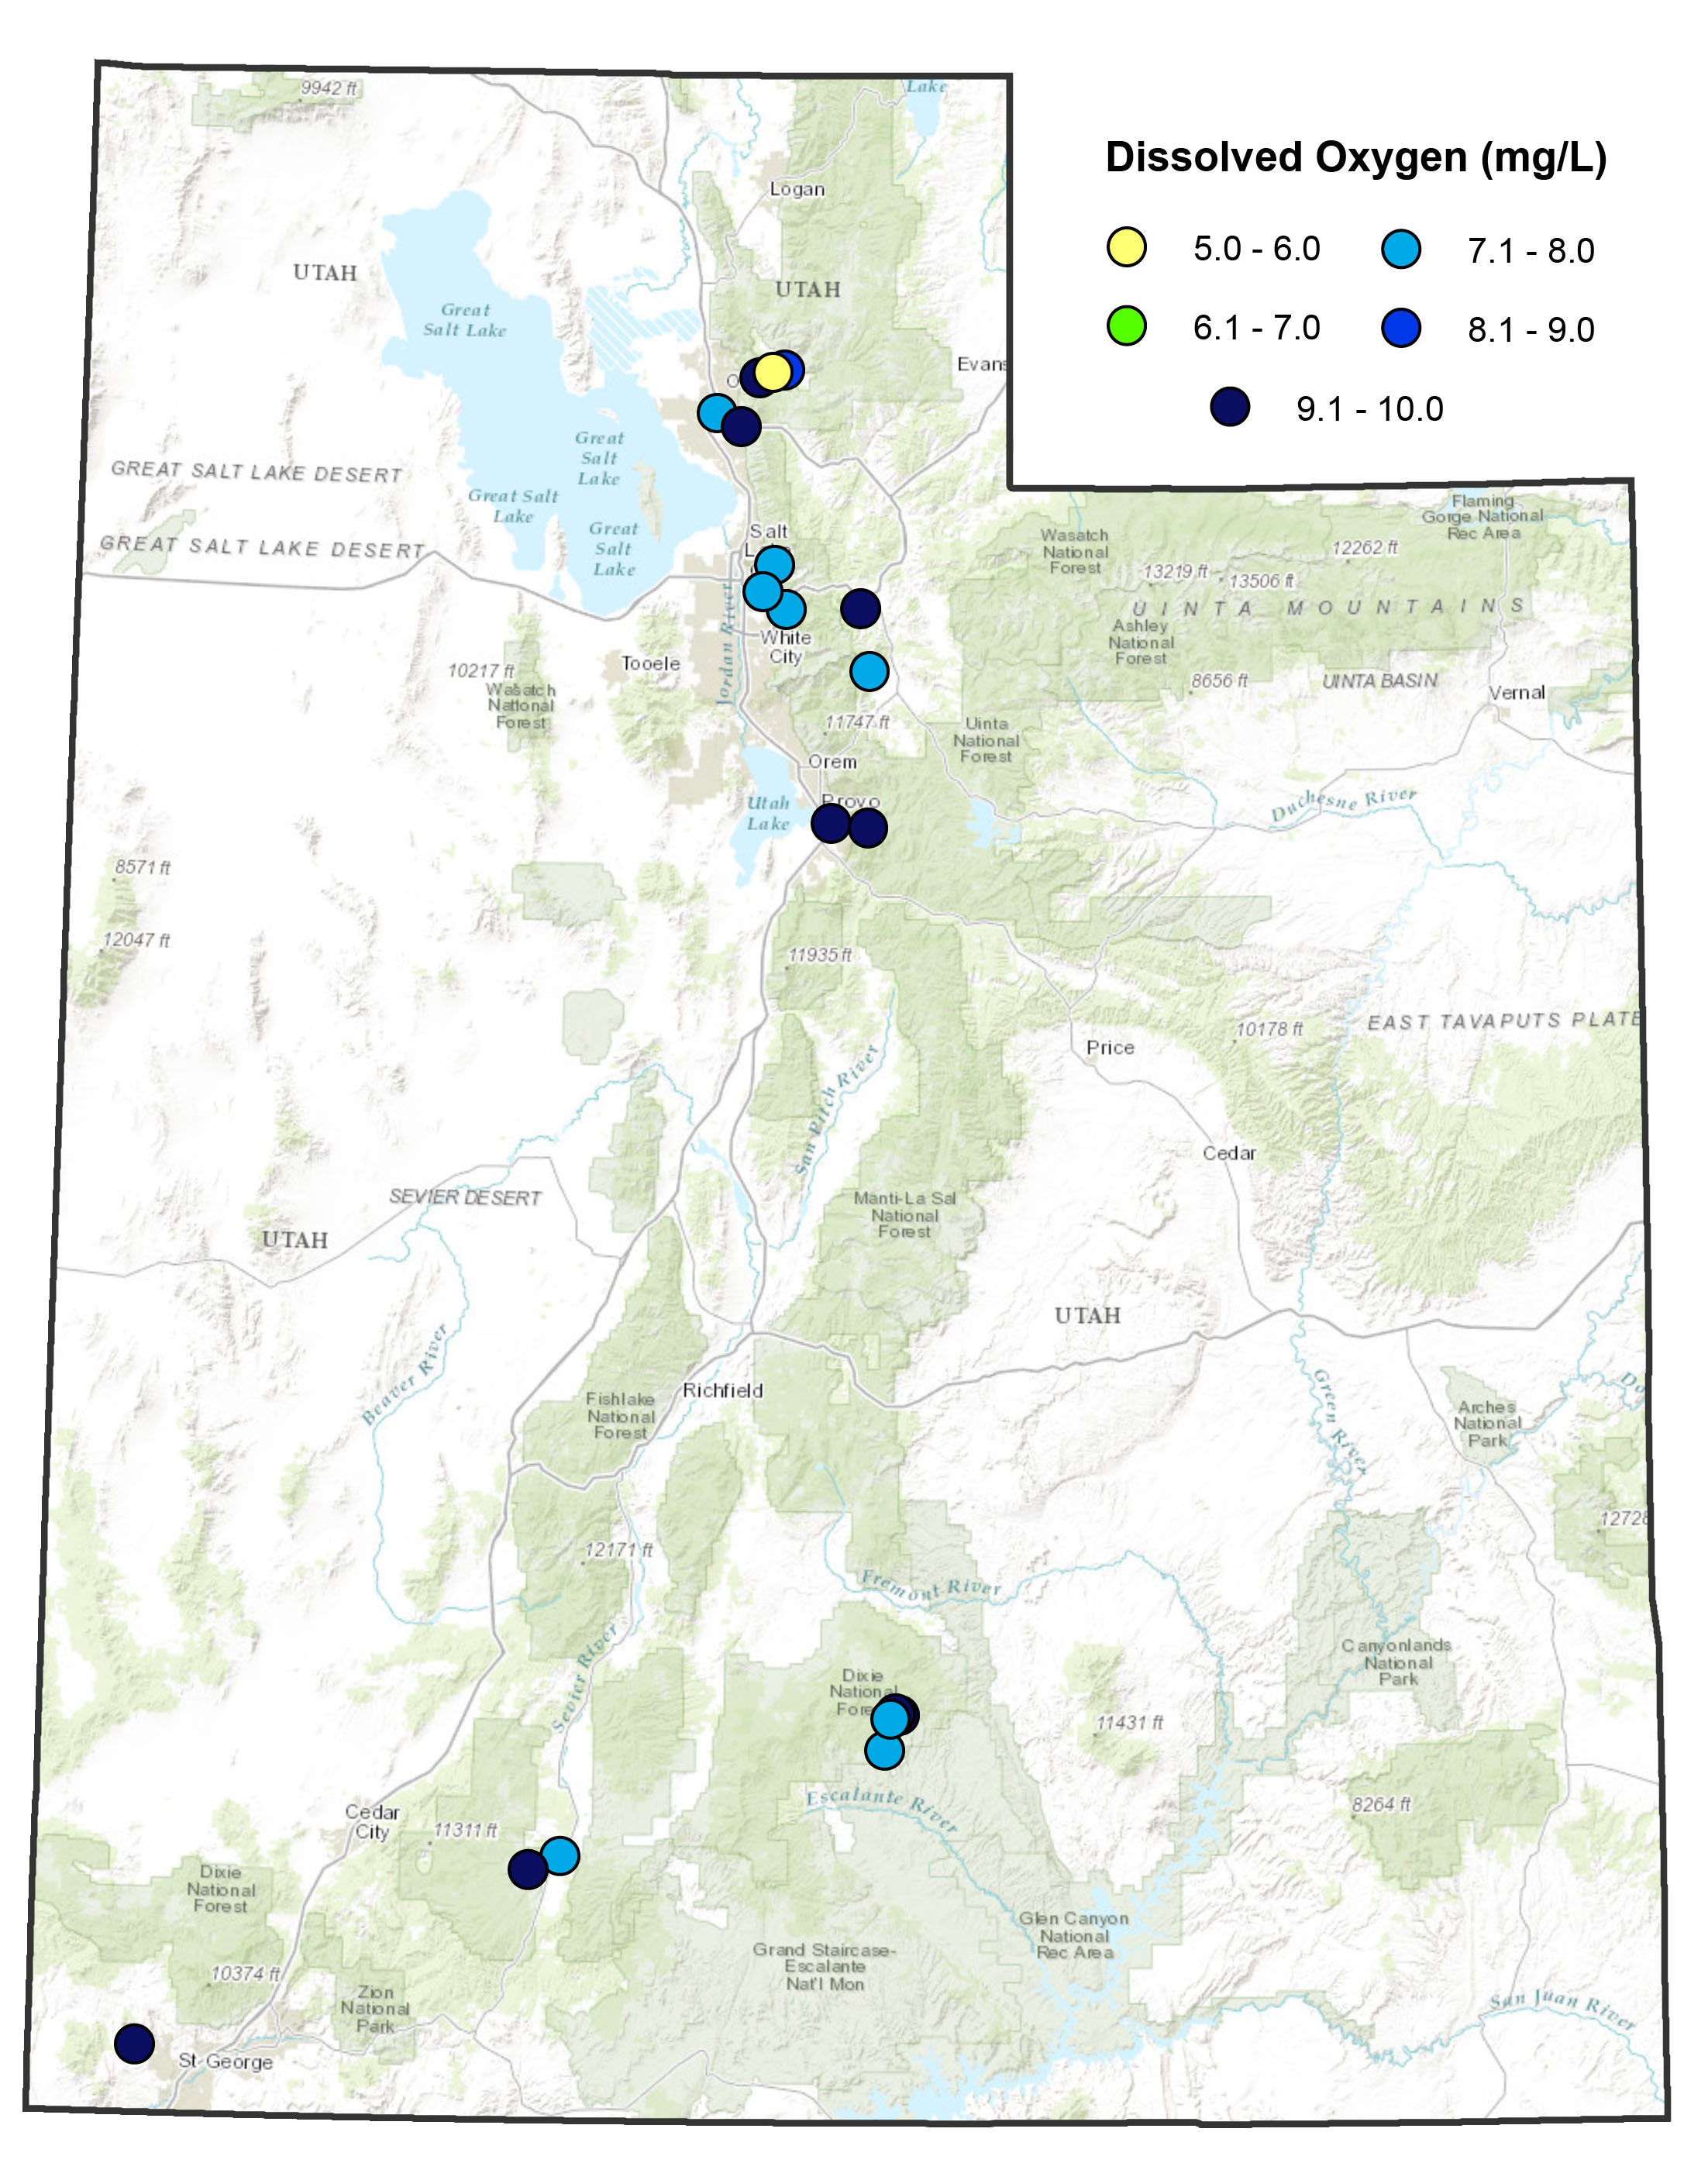
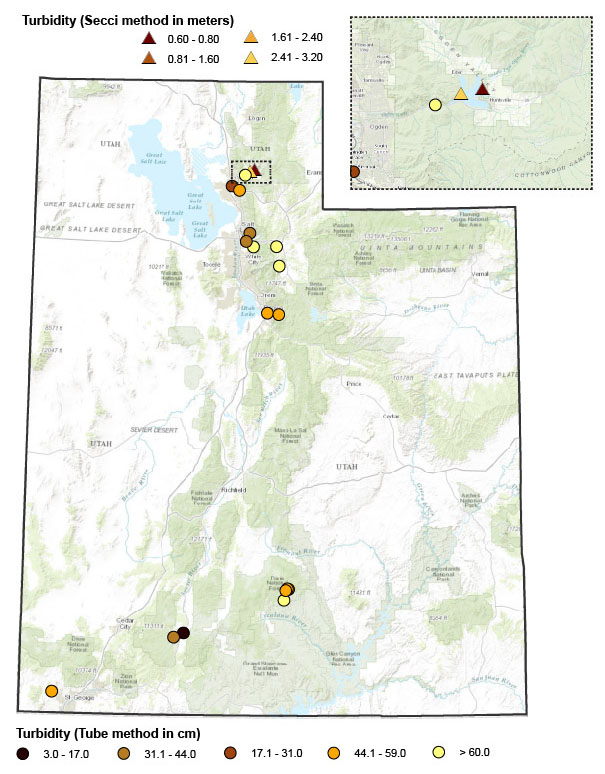
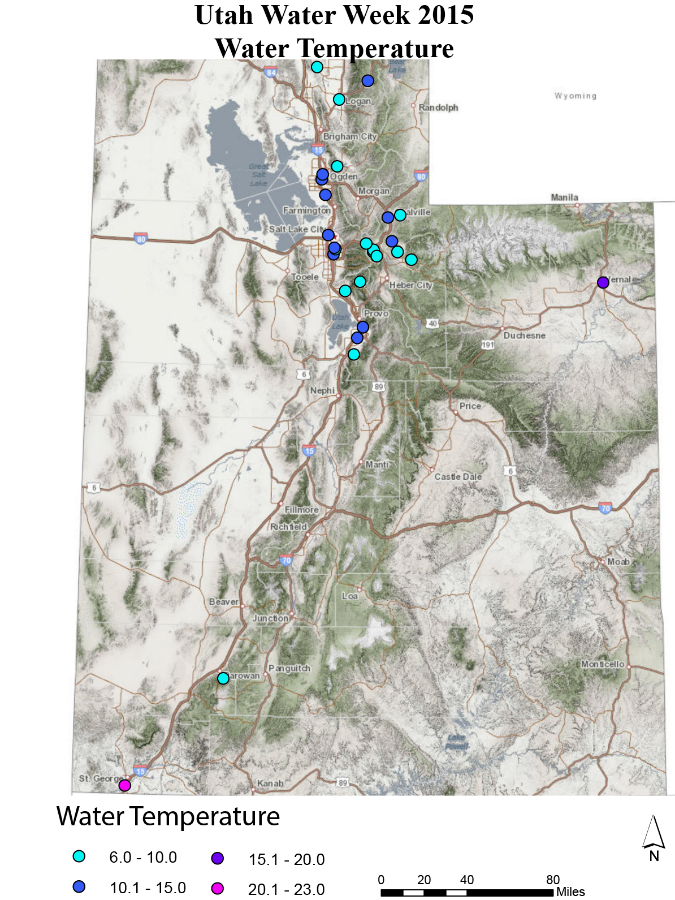
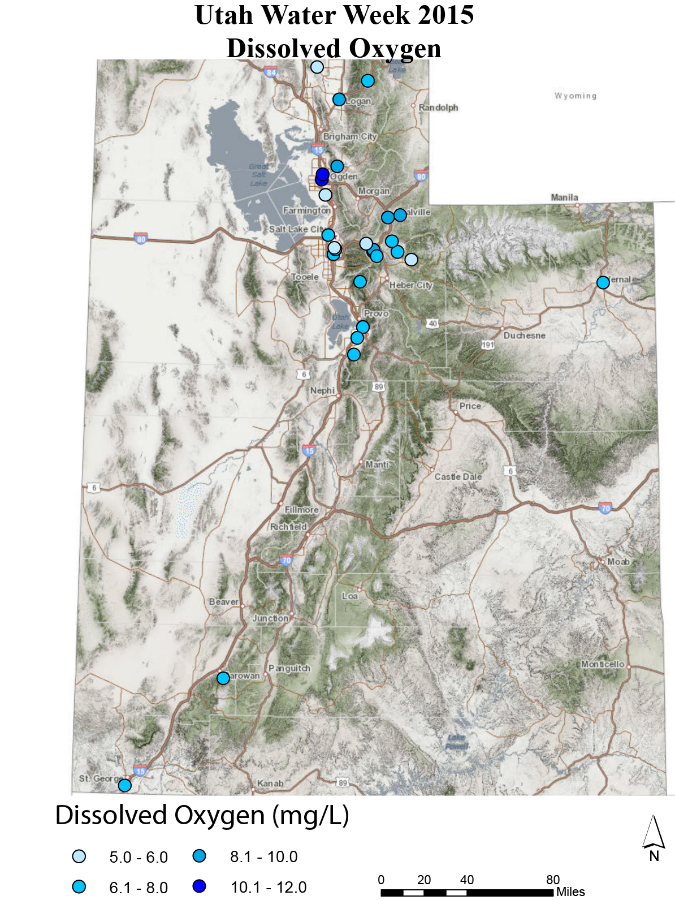
Thank you to all the amazing volunteers who help monitor Utah's beautiful waterbodies during May. Your efforts help provide a "snapshot" of the water quality of our states lakes and streams at the start of the monitoring season.
Each year, volunteers monitor their sites for the following parameters.| Water Temperature | Controls the kinds of organisms that can live in rivers and lakes. Each aquatic species has a preferred temperature range. The water temperature should be a maximum of 20°C for cold waters and 27°C for warm waters to meet the state standards. |
|---|---|
| Dissolved Oxygen | Critical for aquatic life. It is the air that aquatic organisms breathe under water. The DO concentration should be a minimum of 6.5 mg/L for cold waters and 5.5 mg/L for warm waters to meet the state standards. |
| pH | Determines what nutrients and heavy metals are present in our water. It also determines how many nutrients can be taken up by aquatic life. A healthy pH range in Utah is 6.5 - 9. |
| Turbidity | Measure of how clear the water is. When the measurement is a large number, that means the body of water is extremely clear. When the measurement is a small number, that means the water is very cloudy. |
2024 Results
Fast Facts:
Number of monitoring events/sites: 45
Total hours sampled by all volunteers: 47 hours
Total miles driven: 645.5 miles
Warmest air temperature sampled: 30ºC (86ºF)
Coldest air temperature sampled: 2ºC (35.6ºF)
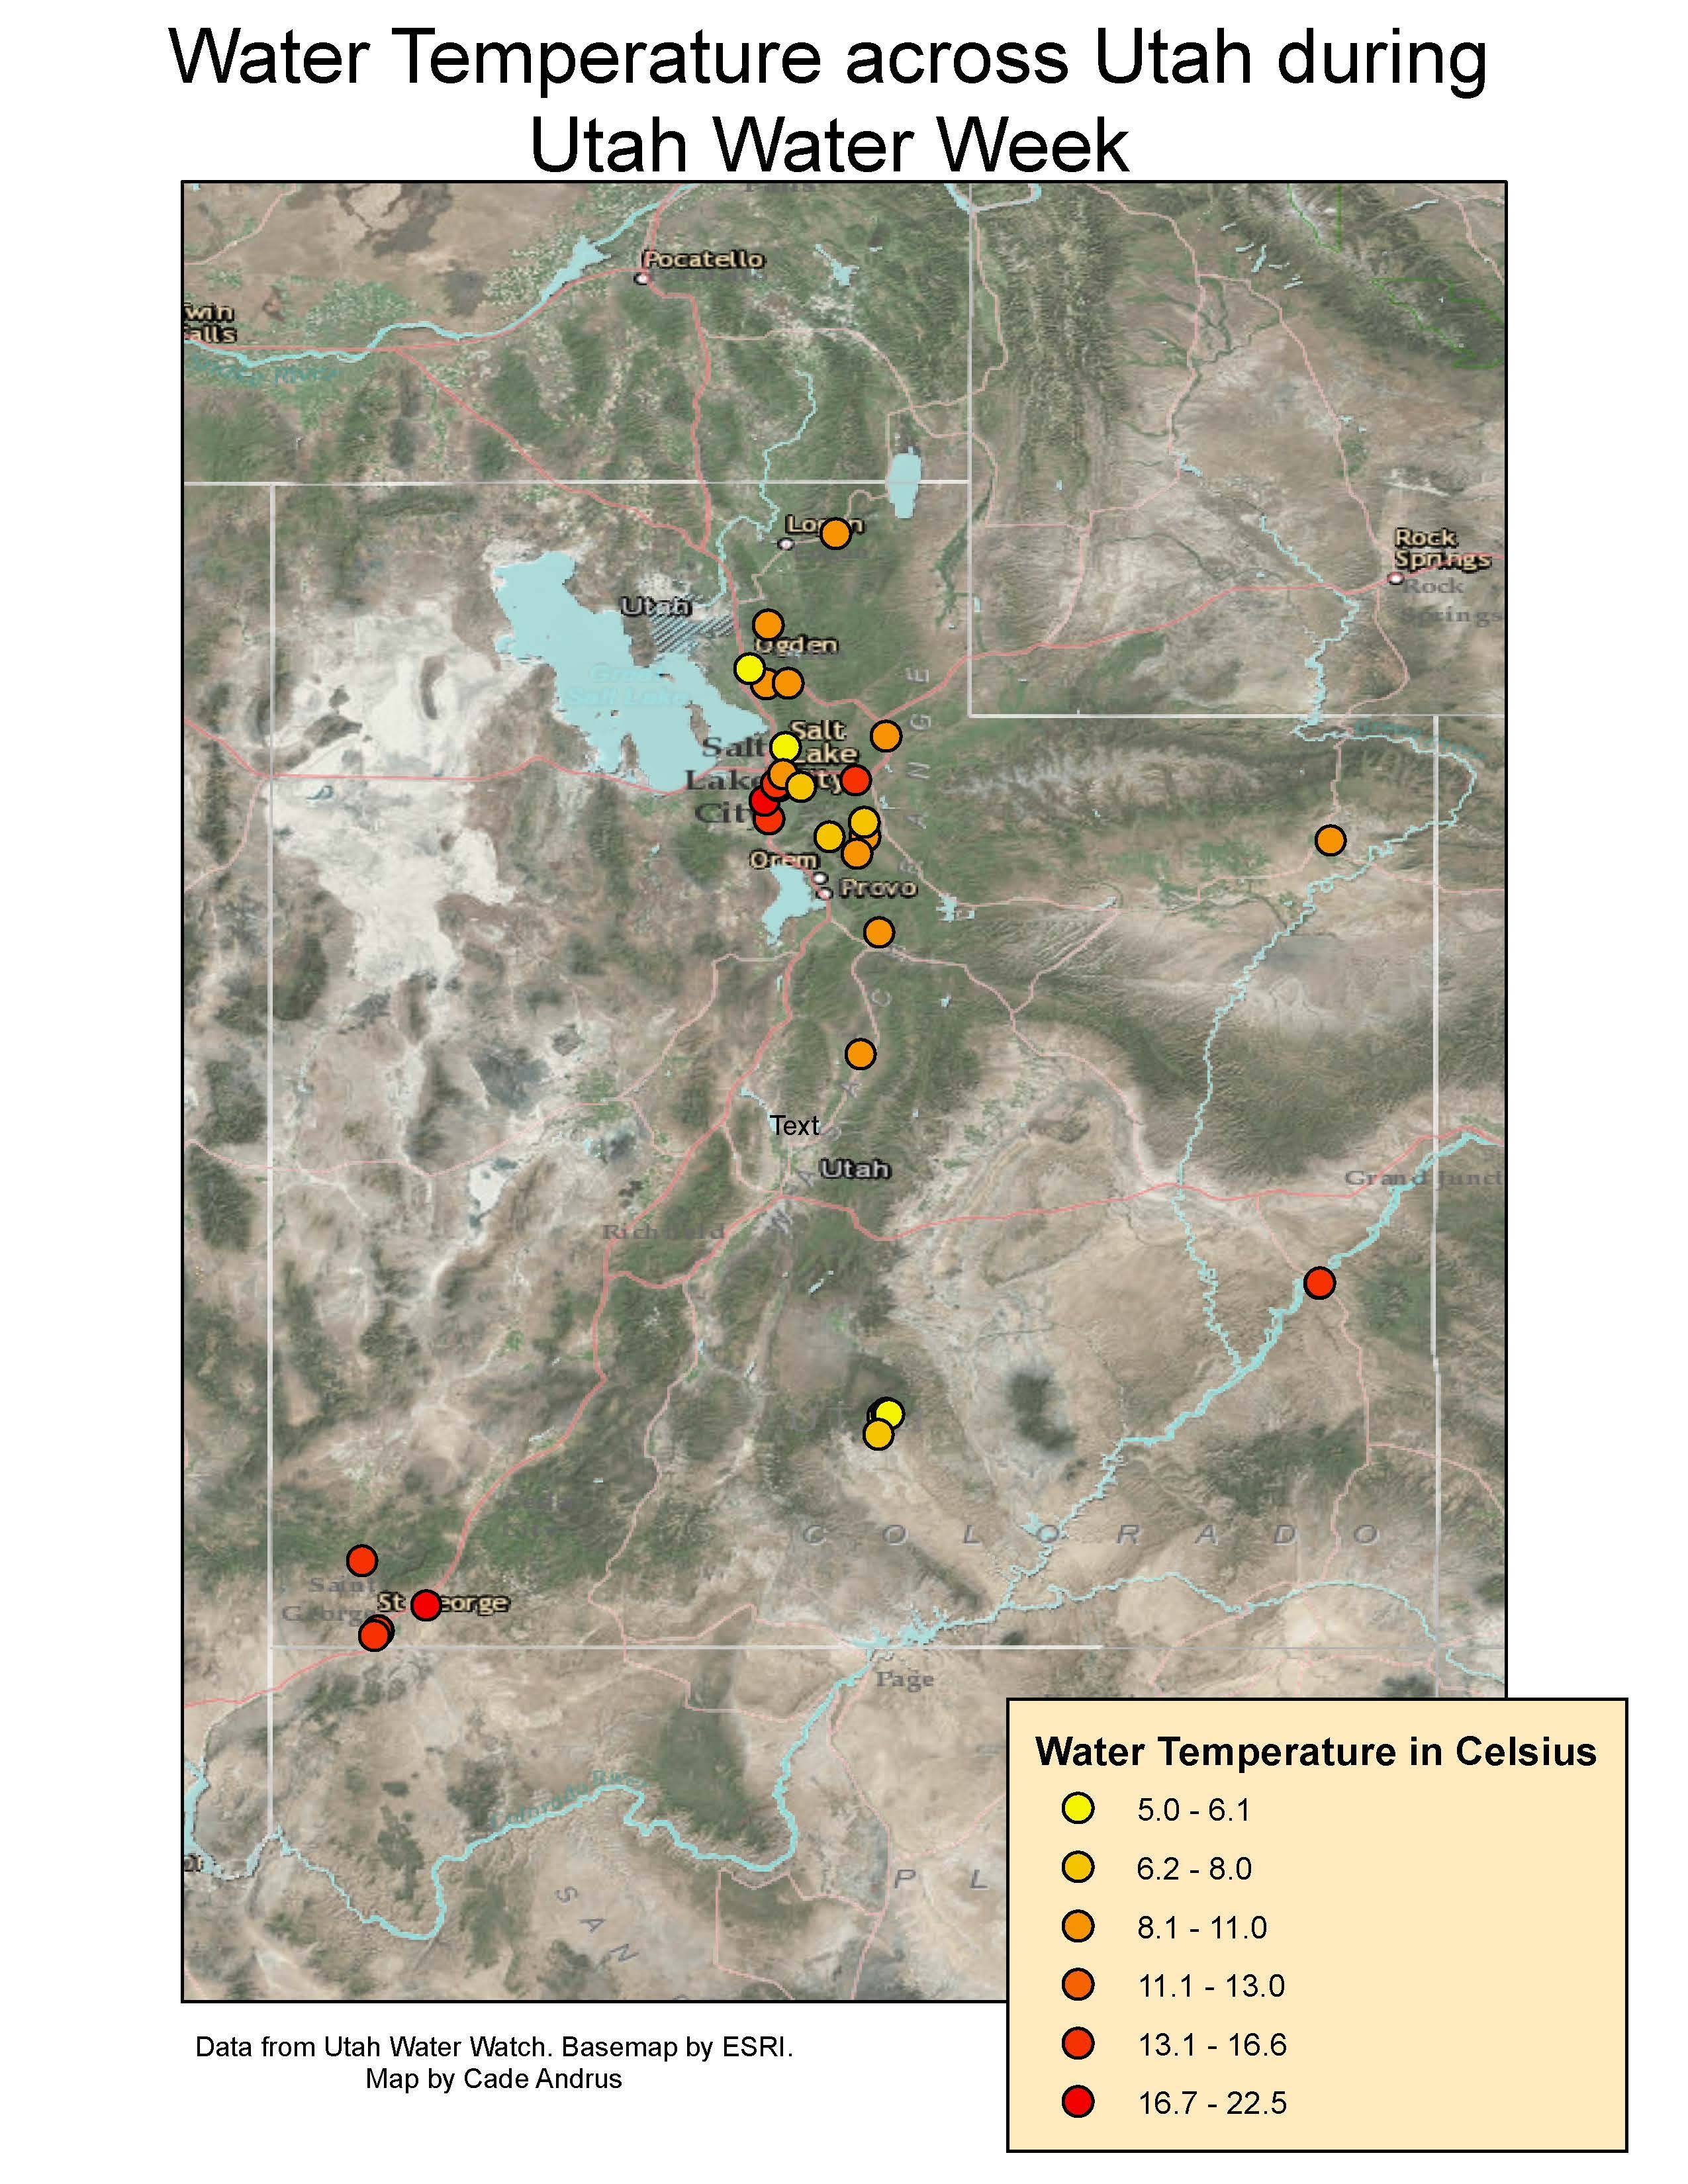
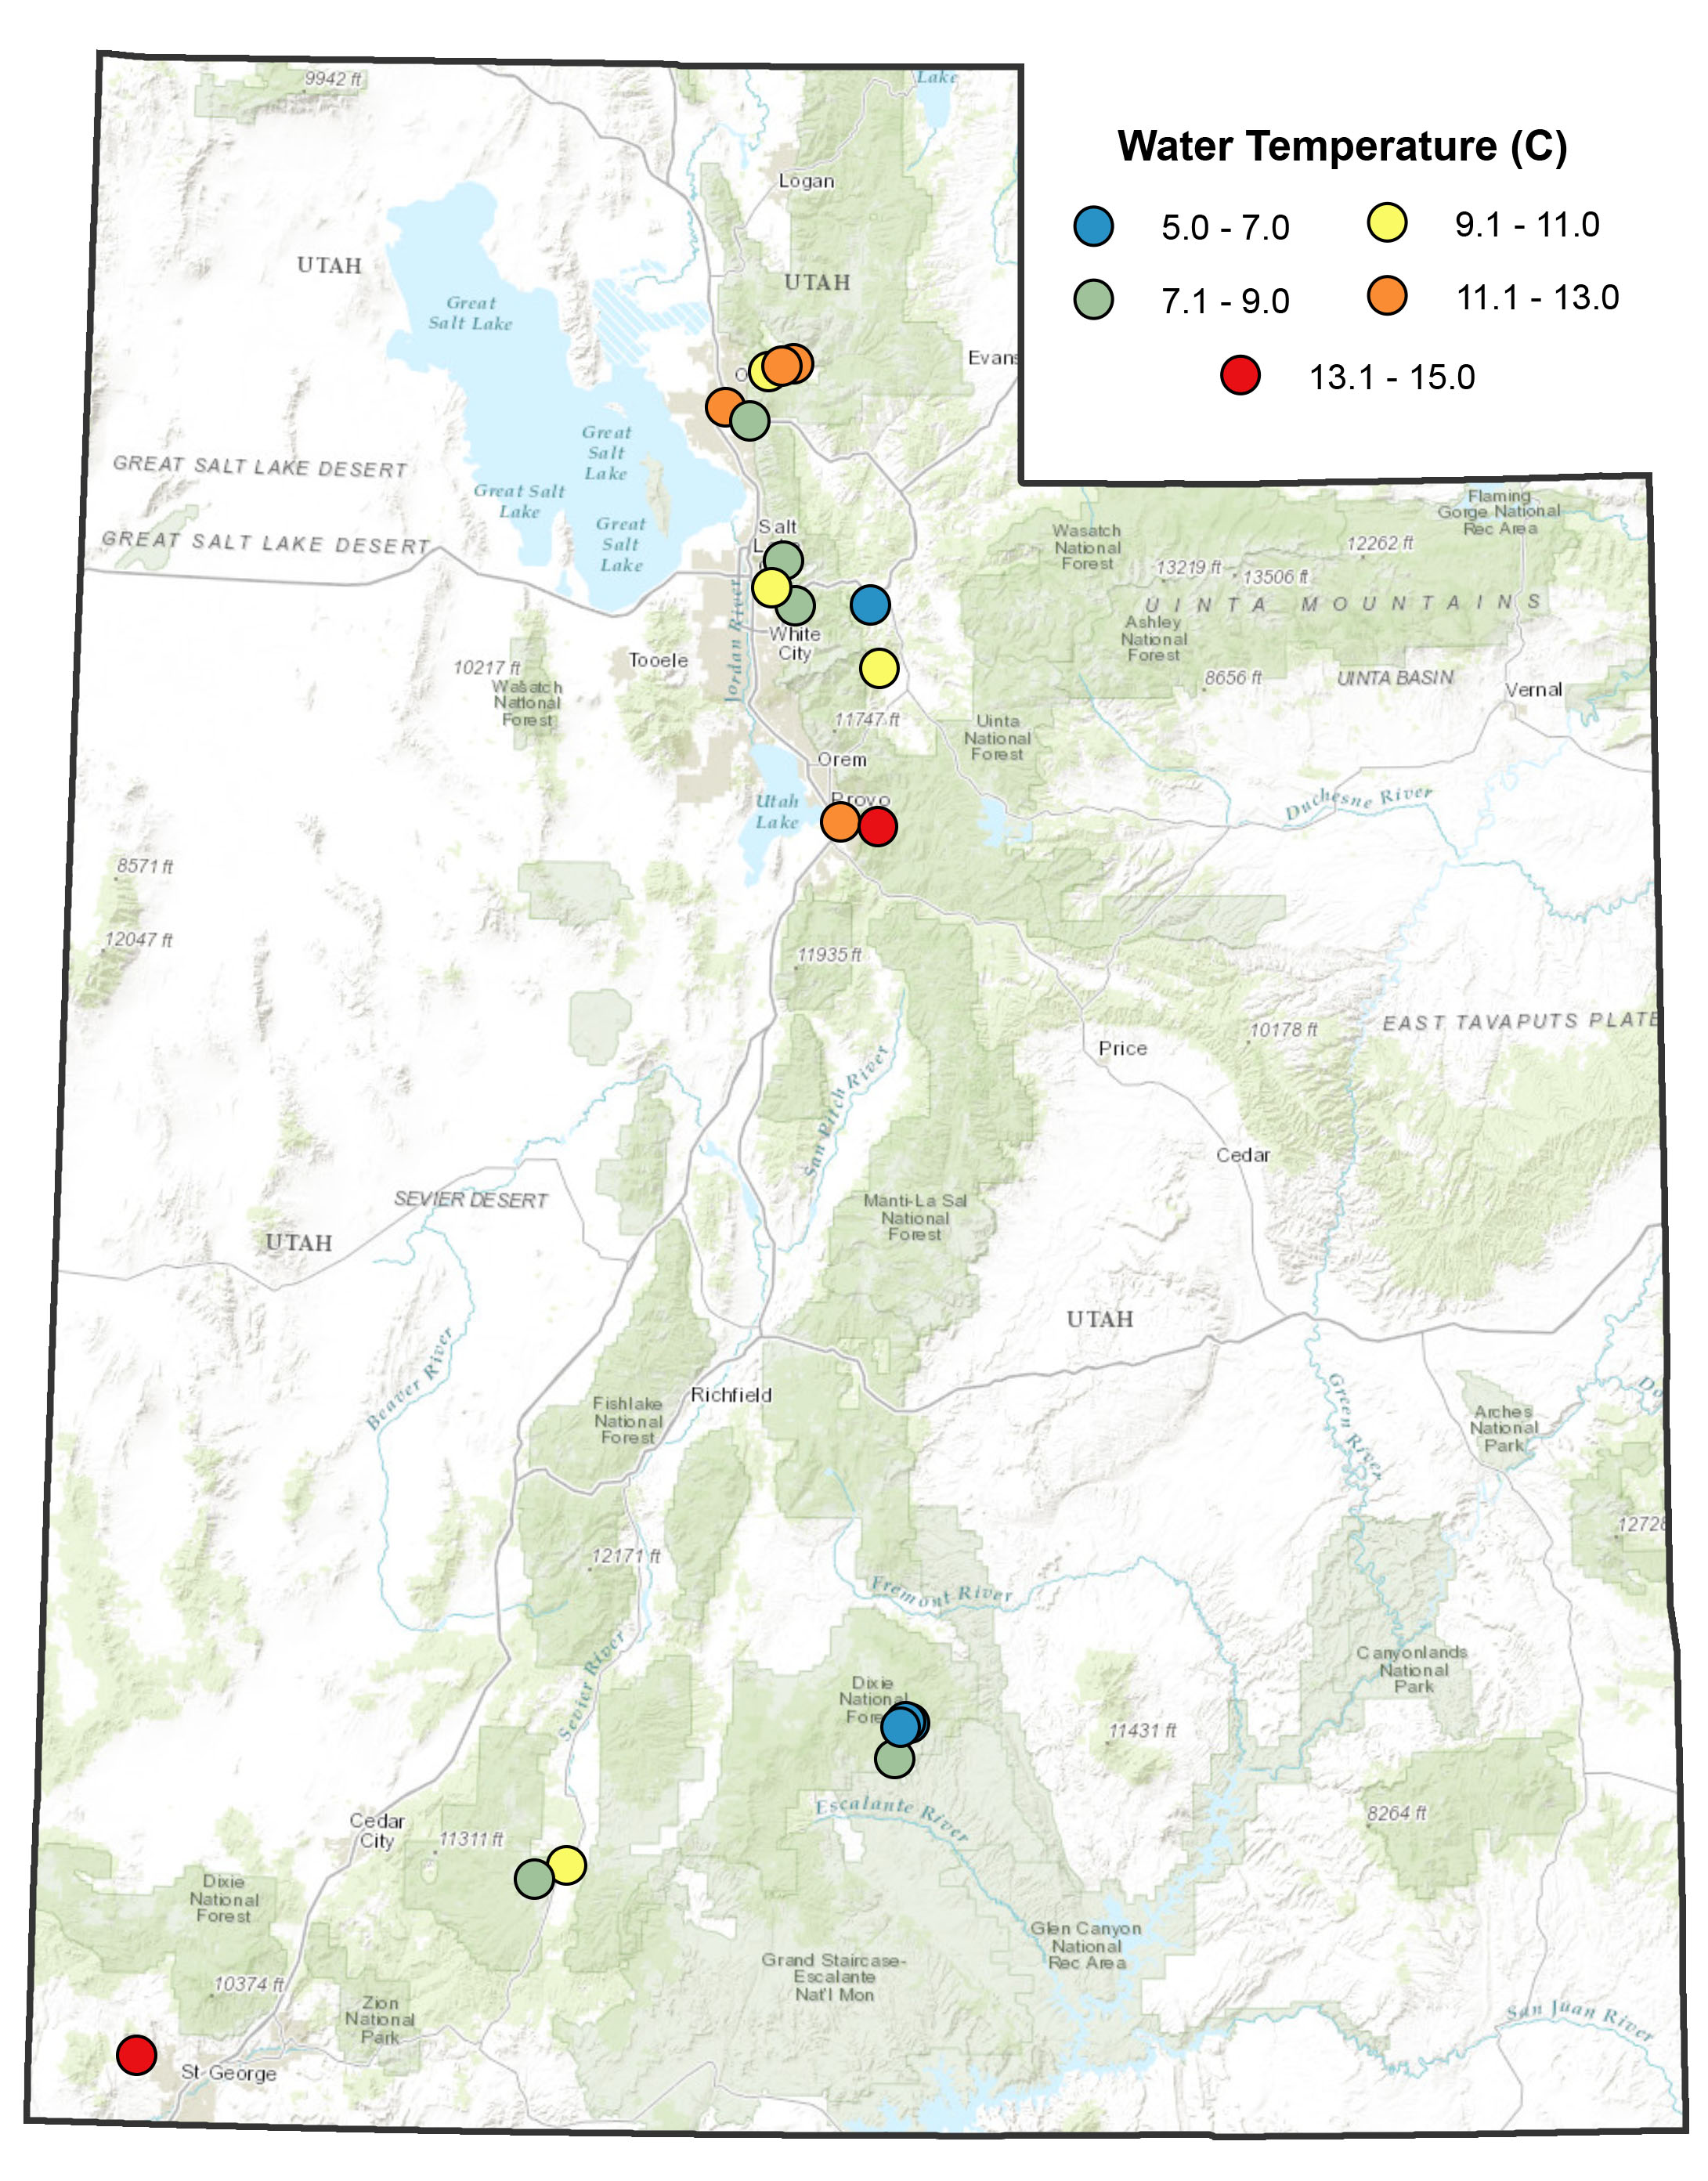
Average water temperature: 9.9ºC (49.8ºF)
Average pH: 6.7
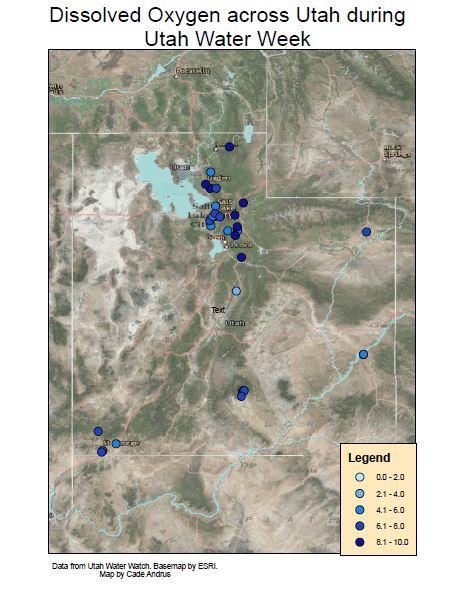
Average dissolved oxygen: 8.1 mg/L
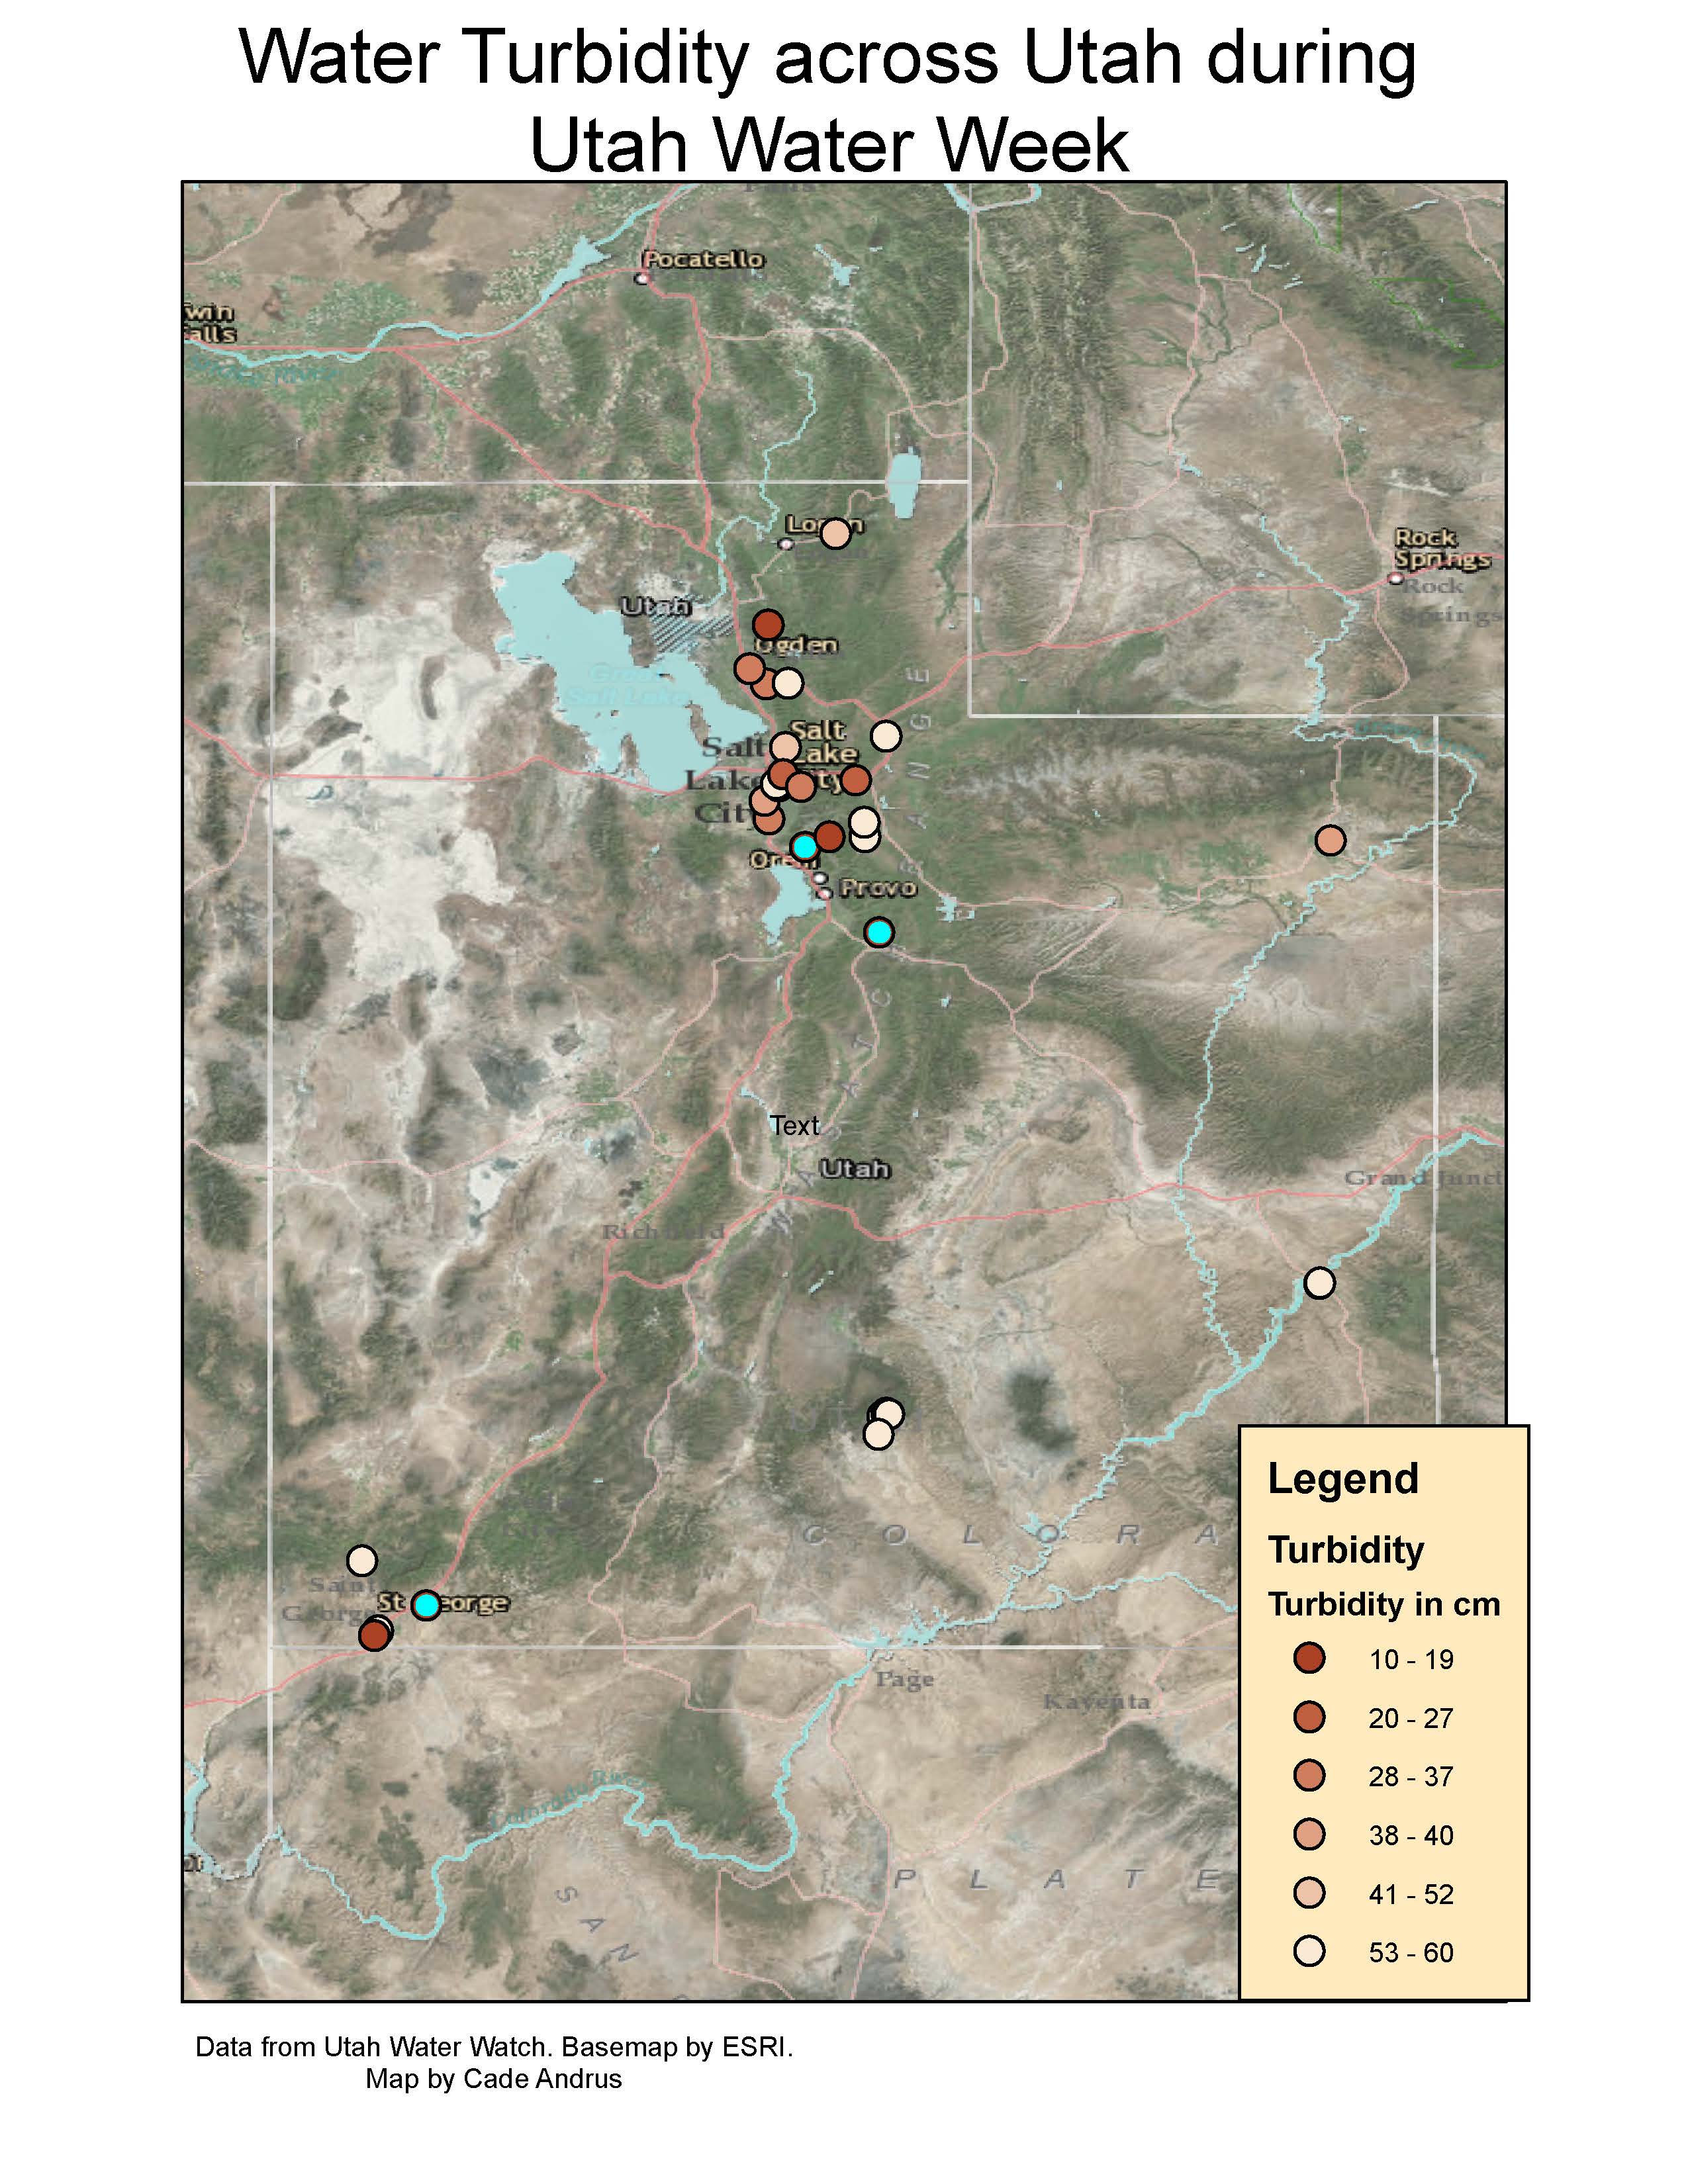
Average turbidity: 43.7 cm
Results showed that all sites monitored were healthy and safe for the organisms and humans that use these lakes and streams.
- The average water temperature for all sites was 9.9ºC, which was 0.8ºC colder than last year. The coldest temperature was 3.6ºC at Quail Hollow Park in northern Utah. The warmest temperature of 20.1ºC was recorded at the Jordan River Wetlands at Kennecott Nature Center in Murray, Utah. These temperature differences can be attributed to elevation, location, and the type of environment.
-
Average dissolved oxygen was 8.1 mg/L, close to last year's average at 8.3 mg/L. When DO levels drop below 6 mg/L, it may be harmful for certain sensitive aquatic organisms. The lowest dissolved oxygen reading was 4.5 mg/L at East Canyon Creek at the outflow of Swaner Nature Preserve's main pond. The highest dissolved oxygen was 12 mg/L at East Canyon Creek at Morman Flat and Pine Creek.
- The average pH of all the lakes and streams measured was 6.7, which is 0.1 lower than last year. The lowest pH was 5.5 in two different locations and the highest was 7.5 at eight different locations.
- The highest stream turbidity during Water Week was in the Jordan River, which had a measurement of 12.5 cm. Water week is held in the spring, typically during spring runoff, which tends to make waters murky with sediment. The average turbidity level was 43.7 cm with eleven sites having readings of 55 cm or more. There were nine sites measured this year using a secchi disk, which is the protocol for measuring lakes, reservoirs, or ponds; while streams are measured using a turbidity tube. The highest measurement for a lake was 2 meters at Matt Warner Reservoir, and the lowest being 0.46 meters at Stansbury Park Lake.
To switch between water quality parameters and view results, click on the picture of the box with the arrow in the top left corner of the map.
2022 Results
Fast Facts:
Number of monitoring events/sites: 27
Total hours sampled by all volunteers: 28 hours
Total miles driven: 493 miles
Warmest air temperature sampled: 33.3ºC (92ºF)
Coldest air temperature sampled: 6.8ºC (44ºF)
Average water temperature: 10.7ºC (51ºF)
Average pH: 6.8
Average dissolved oxygen: 8.3 mg/L
Average turbidity: 41.2 cm
Click here to see some of the great photos submitted by our volunteers for Utah Water Week this year!
Results showed that all sites monitored were healthy and safe for the organisms and humans that use these lakes and streams.
- The average water temperature for all sites was 10.7ºC, which was 2.3ºC colder than last year. The coldest temperature was 1.7ºC at Silver Lake in northern Utah. The warmest temperature of 20.1ºC was recorded at the Virgin River at Sullivan Park in southern Utah. These temperature differences can be attributed to elevation and location.
- Average dissolved oxygen was 8.3 mg/L, close to last year's average at 8.6 mg/L. When DO levels drop below 6 mg/L, it may be harmful for certain sensitive aquatic organisms. The lowest dissolved oxygen readings were 6 mg/L at Spanish Fork River and Birch Creek. The highest dissolved oxygen was 12 mg/L at East Canyon Creek.
- The average pH of all the lakes and streams measured was 6.8, which is 0.4 lower than last year. The lowest pH was 5.5 in three different locations and the highest was 8 at three different locations.
- The highest stream turbidity during Water Week was in the Yellow Fork river, which had a measurement of 5 cm. Water week is held in the spring, typically during spring runoff, which tends to make waters murky with sediment. The average turbidity level was 41.2 cm with eight sites having readings of 55 cm or more. There were ten sites measured this year using a secchi disk, which is the protocol for measuring lakes, reservoirs, or ponds; while streams are measured using a turbidity tube. The highest measurement for a lake was 2 meters at Jordanelle Reservoir, and the lowest being 0.15 meters at Utah Lake.
2021 Results
Fast Facts:
Number of monitoring events/sites: 32
Total hours sampled by all volunteers: 40 hours
Total miles driven: 725 miles
Warmest air temperature sampled: 30.5ºC (86.9ºF)
Coldest air temperature sampled: 10.3ºC (50.5ºF)
Average water temperature: 13ºC (55.4ºF)
Average pH: 7.2
Average dissolved oxygen: 8.6 mg/L
Average turbidity: 52.9 cm
Click here to see some of the great photos submitted by our volunteers for Utah Water Week this year!
Results showed that all sites monitored were healthy and safe for the organisms and humans that use these lakes and streams.
- The average water temperature for all sites was 13.0ºC, 2.7ºC warmer than last year. The coldest temperature was 4.8ºC at Toll Creek. The warmest temperature of 24.6ºC was at Barton Pond. These temperature differences can be attributed to elevation and location.
- Average dissolved oxygen was 8.6 mg/L, close to last year's average at 8.1 mg/L. When levels drop below 6mg/L it may be harmful for certain sensitive aquatic organisms. The lowest dissolved oxygen reading was 5 mg/L at Bingham Creek and the highest was 12 mg/L at South Fork, South Channel.
- The average pH of all the lakes and streams was 7.2, which is 0.2 higher than last year. The lowest pH this week was 6.5 in 7 different locations and the highest was 8 at 6 different locations.
- The highest stream turbidity during water week was in Bingham Creek, which had a measurement of 10 cm. Water week is held in the spring, typically during spring runoff which tends to make waters murky with mud. The average turbidity level was 52.9 cm, with sixteen sites having readings of 60 cm. There were four sites measured this year using a secchi disk instead of a turbidity tube, which is the protocol for measuring lakes, reservoirs, or ponds. The highest measurement being 7.5 meters at Holmes Creek Reservoir, and the lowest being 0.6 meters at Arrowhead Pond.
To switch between water quality parameters and view results, click on the picture of the box with the arrow in the top left corner of the map.
2020 Results
Fast Facts:
Number of monitoring events/sites: 30
Total hours sampled by all volunteers: 39 hours
Total miles driven: 509 miles
Warmest air temperature sampled: 21.4ºC (70.52ºF)
Coldest air temperature sampled: 11.2ºC (51.16ºF)
Average water temperature: 10.2ºC (50.36ºF)
Average pH: 6.0
Average dissolved oxygen: 8.1 mg/L
Average turbidity: 43.2 cm
Click here to see some of the great photos submitted by our volunteers for Utah Water Week this year!
Results showed that all sites monitored were healthy and safe for the organisms and humans that use these lakes and streams.
- The average water temperature for all sites was 10.2°C, 1.58°C warmer than last year. The coldest temperature was 3.7°C at Jordan River. The warmest temperature of 17.5°C was at Bountiful Pond. These temperature differences can be attributed to elevation and location.
- Average dissolved oxygen was 8.1 mg/L, close to last year's average at 8.29 mg/L. When levels drop below 6mg/L it may be harmful for certain sensitive aquatic organisms. The lowest dissolved oxygen reading was 6 mg/L in 7 different locations and the highest was 10 mg/L in eight different locations.
- The average pH of all the lakes and streams was 6.9, the same as last year. The lowest pH this week was 5.5 in Birch Creek at Shadow Valley and the highest was 8 at 3 different creeks: Bingham, Kimball, and MacLeod Creek.
- The highest stream turbidity during water week was in Sevier River, Jordan River, and Bingham Creek, which had a measurement of 15 cm. Water week is held in the spring, typically during spring runoff which tends to make waters murky with mud. The average turbidity level was 43.2 cm, with eight sites having readings of 60 cm. There were seven sites measured this year using a secchi disk instead of a turbidity tube, which is the protocol for measuring lakes, reservoirs, or ponds. The highest measurement being 5.25 meters at Bear Lake, and the lowest being 0.14 meters at Highland Glen Park.
To switch between water quality parameters and view results, click on the picture of the box with the arrow in the top left corner of the map.
2019 Results
Fast Facts:
Number of monitoring events/sites: 19
Total hours sampled by all volunteers: 26.25 hours
Total miles driven: 300.75 miles
Warmest air temperature sampled: 26ºC (78.8ºF)
Coldest air temperature sampled: 6.9ºC (44.4ºF)
Average water temperature: 8.62ºC (46.9ºF)
Average pH: 6.9
Average dissolved oxygen: 8.29 mg/L
Average turbidity: 49.94 cm
Results showed that all sites monitored were healthy and safe for the organisms and humans that use these lakes and streams.
- The average water temperature for all sites was 8.62 oC, 4.28 oC cooler than last year. The cooler average temperature could be attributed to the high amounts of snow the state received this year. The coldest temperature was 4.5 oC at Emigration Creek, which is located in Escalante and had the highest elevation of all the monitored sites. The warmest temperature of 14 oC was at Mill Creek. These temperature differences can be attributed to elevation and location.
- Average dissolved oxygen was 8.29 mg/L, close to last year's average. When levels drop below 6mg/L it may be harmful for certain sensitive aquatic organisms. The lowest dissolved oxygen reading was 5 mg/L in Mill Creek and the highest was 12 mg/L in the South Fork of Ogden River.
- The average pH of all the lakes and streams was 6.9. The lowest pH this week was 6 in the South Fork of Ogden River and the highest was 8 at Chalk Creek.
-
The highest stream turbidity during water week was in Sevier River, which had a measurement of 20 cm. Water week is held in the spring, typically during spring runoff which tends to make waters murky with mud. Spring runoff was mild this year and the average turbidity level was 49.94 cm, with nine sites having readings of 60 cm. There was only one lake measured this year and the volunteers used a secchi disk instead of a turbidity tube, which is the protocol for measuring lakes. Their measurement at Deer Creek Reservoir was 4.67 meters.
To switch between water quality parameters and view results, click on the picture of the box with the arrow in the top left corner of the map.
2018 Results
Fast Facts:
Number of monitoring events/sites: 53
Total hours sampled by all volunteers: 60.5 hours
Total miles driven: 792.5 miles
Warmest air temperature sampled: 31.5ºC (90.9ºF)
Coldest air temperature sampled: 10.1ºC (49ºF)
Average water temperature: 12.9ºC (55.22ºF)
Average pH: 7.4
Average dissolved oxygen: 9 mg/L
Results show generally good water quality at all sites with one site reaching an extreme exceedance of state standard for pH.
- The average water temperature for all sites was 12.9 oC, similar to last year. The coldest temperature was 1.3 oC at Willow Creek, which is up at high elevation in Big Cottonwood Canyon. The warmest temperature of 20.3 oC was again at Steed Pond which is a small pond in the valley. These extreme temperature differences can be attributed to elevation and location. Lakes may heat up more quickly because they have a large surface area to absorb solar radiation. Stream and lake temperature can be significantly affected by diverting water for irrigation, homes and other uses.
- Average dissolved oxygen was 8.2 mg/L. When levels drop below 6mg/L it may be harmful for certain sensitive aquatic organisms. The lowest pH reading was 5.5 mg/L in a tributary to East Canyon Creek and the highest was 12mg/L in the Jordan River. It may be surprising that the Jordan had high levels, since it is impaired for low levels. However, if there are much plants/algae present, the levels may increase during the afternoon when the plants are photosynthesizing.
- The average pH of all the lakes and streams was 7.4. The lowest pH this week was 5.5 in Willow Creek and the highest at 8.8 in Pack Creek near Moab.
-
The hightest stream turbidity during water week was the Jordan River, which had a measurement of 9 cm in the turbidity tube. Water week is held in the spring, typically during spring runoff. Spring runoff was mild this year and the average turbidity level was 49cm, with many in the >60cm range.
To switch between water quality parameters and view results, click on the picture of the box with the arrow in the top left corner of the map.
2017 Results
Fast Facts:
Number of monitoring events/sites: 45
Total hours sampled by all volunteers: 54.7 hours
Total miles driven: 620.8 miles
Warmest air temperature sampled: 32.7ºC (90.9ºF)
Coldest air temperature sampled: 9.5ºC (49ºF)
Average water temperature: 12.9ºC (55.22ºF)
Average pH: 7.0
Average dissolved oxygen: 7.7 mg/L
Results show generally good water quality at all sites.
- The average temperature for all sites was 12.8 oC (3.3 oC warmer than last year) with the coldest temperature of 5.0 C at Parley's Canyon Creek and the warmest temperature of 22.5 oC at Steed Pond. Some of these temperature differences can be attributed to changes in elevation and location of the river or stream. Streams receiving melted snow water will generally be cooler this time of year than standing water in ponds. For example, the Jordan River is significantly warmer than streams up canyon. Water temperature in streams should not exceed 20°C.
- The average dissolved oxygen for all sites was 7.7 mg/liter (ppm) with a low of 3.9 mg/liter on one location on Parley's Canyon Creek and a high of 10 mg/liter at many locations in Utah. Values 5.0 mg/liter or lower can be stressful for certain aquatic organisms.
-
The highest turbidity was found in the Jordan River watershed and the Lower Colorado watershed on American Fork River, Diamond Fork River and Virgin Rivers. The lower the reading, in centimeters (cm), the higher the turbidity. Overall, turbidity was high at many sites during Utah Water Week, likely due to increased flows compared during spring runoff. The most turbid sites are dark brown in color.
2016 Results
Fast Facts:
Number of monitoring events/sites: 22
Total hours sampled by all volunteers: 24 hours
Total miles driven: 152 miles
Warmest air temperature sampled: 37ºC (99ºF)
Coldest air temperature sampled: 7ºC (45ºF)
Average water temperature: 9.5ºC (49.1ºF)
Average pH: 7.0
Average dissolved oxygen: 8.7 mg/L
Results show generally good water quality at all sites.
- The average temperature for all sites was 9.5 ºC (1.5 C colder than last year) with the coldest temperature of 6.0 ºC at the Weber River and the warmest temperature of 15 ºC in the Santa Clara River.
- The average dissolved oxygen for all sites was 8.7 mg / L with a low of 5.0 mg/ L on one location on the Weber River and a high of 10 mg/ L at many locations in Utah. Values lower than ~ 5.0 mg / L can be stressful for certain aquatic organisms.
2015 Results
Results show generally good water quality at all sites.
- The average temperature for all sites was 10.9 C (1.0 C warmer than last year) with the coldest temperature of 6.0 C at Highland Glen Pond and the warmest temperature of 23 C in the Virgin River (also the highest from 2014).
- The average dissolved oxygen for all sites was 7.9 mg / L with a low of 5.0 mg/ L on one location on the Weber River and a high of 12 mg/ L at a different location on the Weber River. Values lower than ~ 5.0 mg / L can be stressful for certain aquatic organisms.
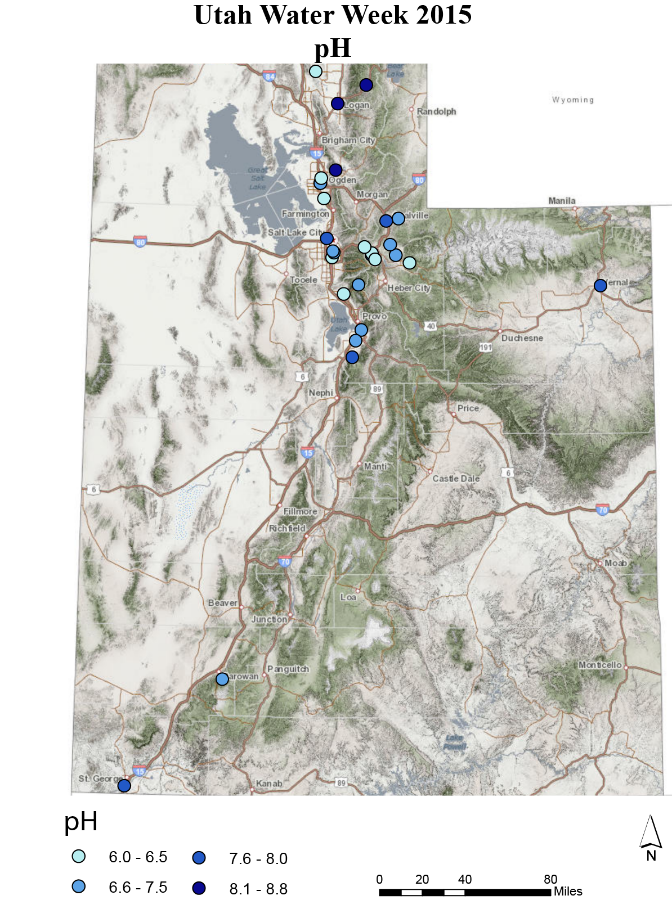
- The average pH for all sites was 7.3 (2014 was 7.2) with a maximum of 8.85 at Temple Fork and a minimum of 6 at three different sites.
2014 Results
Results show generally good water quality at all sites.
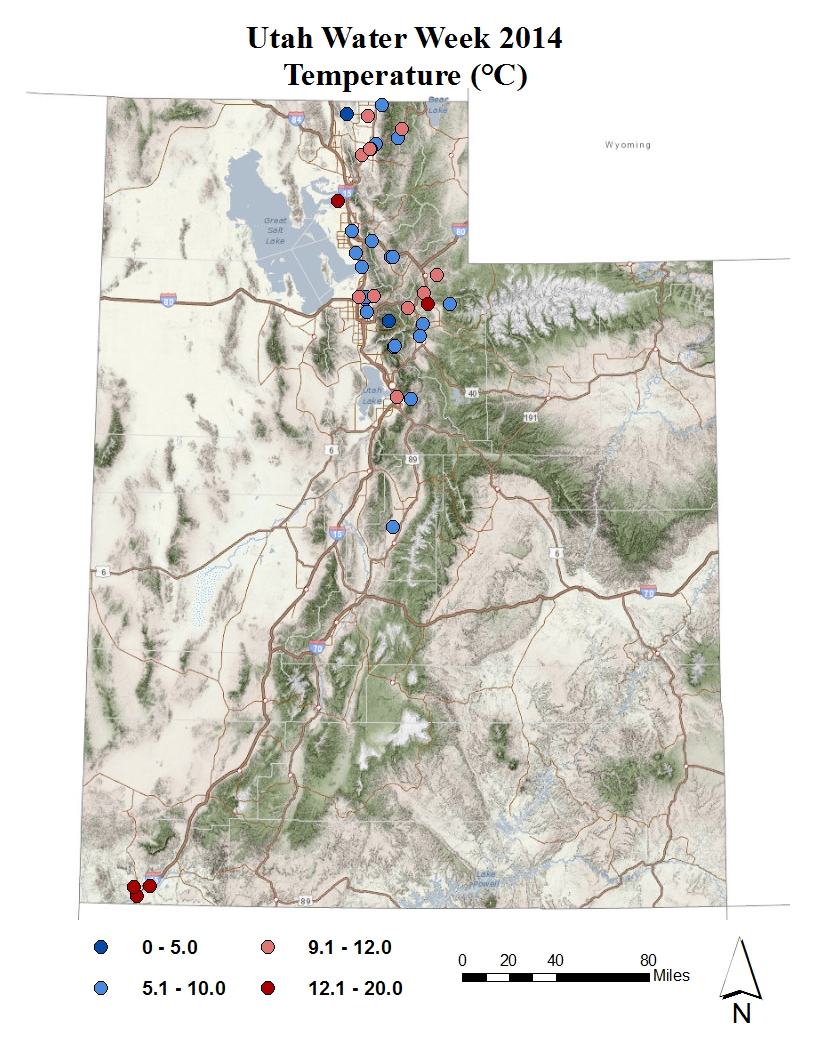
- The average temperature for all sites was 9.5 C (1.5 C colder than last year) with the coldest temperature of 6.0 C at the Weber River and the warmest temperature of 15 C in the Santa Clara River.
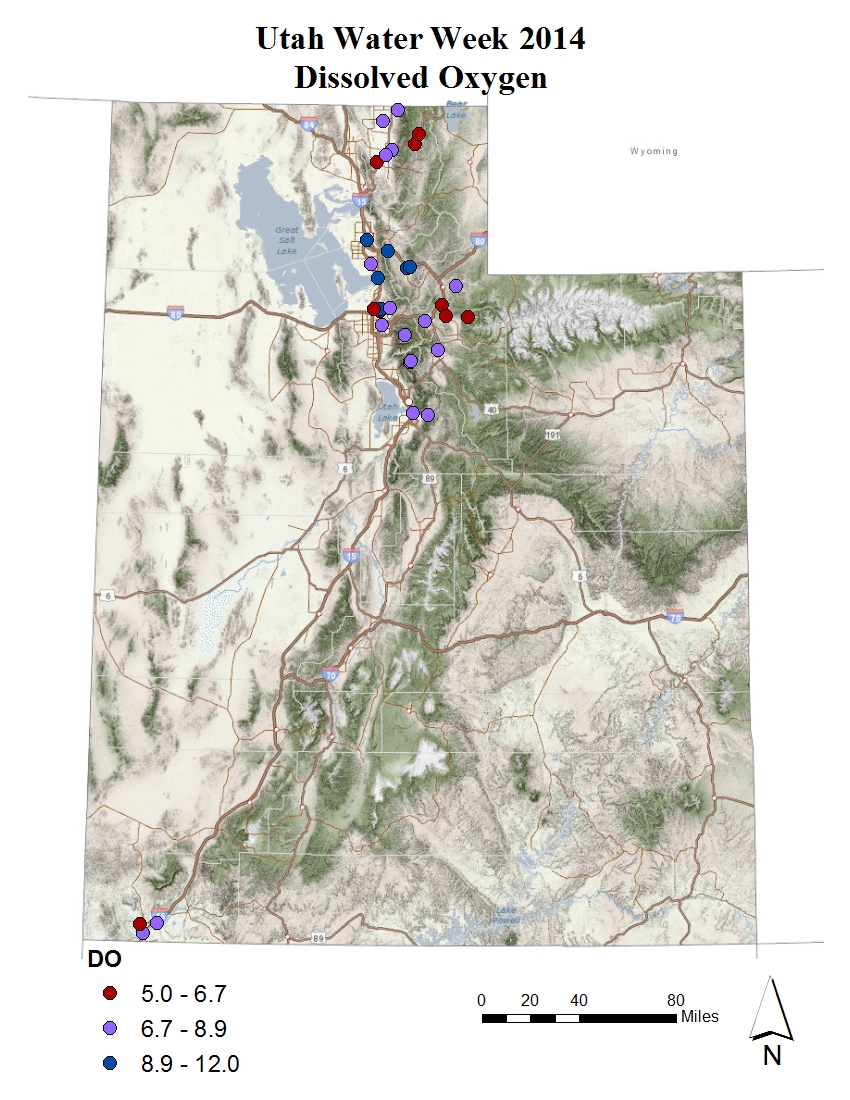
- The average dissolved oxygen for all sites was 7.9 mg / L with a low of 5.0 mg/ L on one location on the Weber River and a high of 12 mg/ L at a different location on the Weber River. Values lower than ~ 5.0 mg / L can be stressful for certain aquatic organisms.
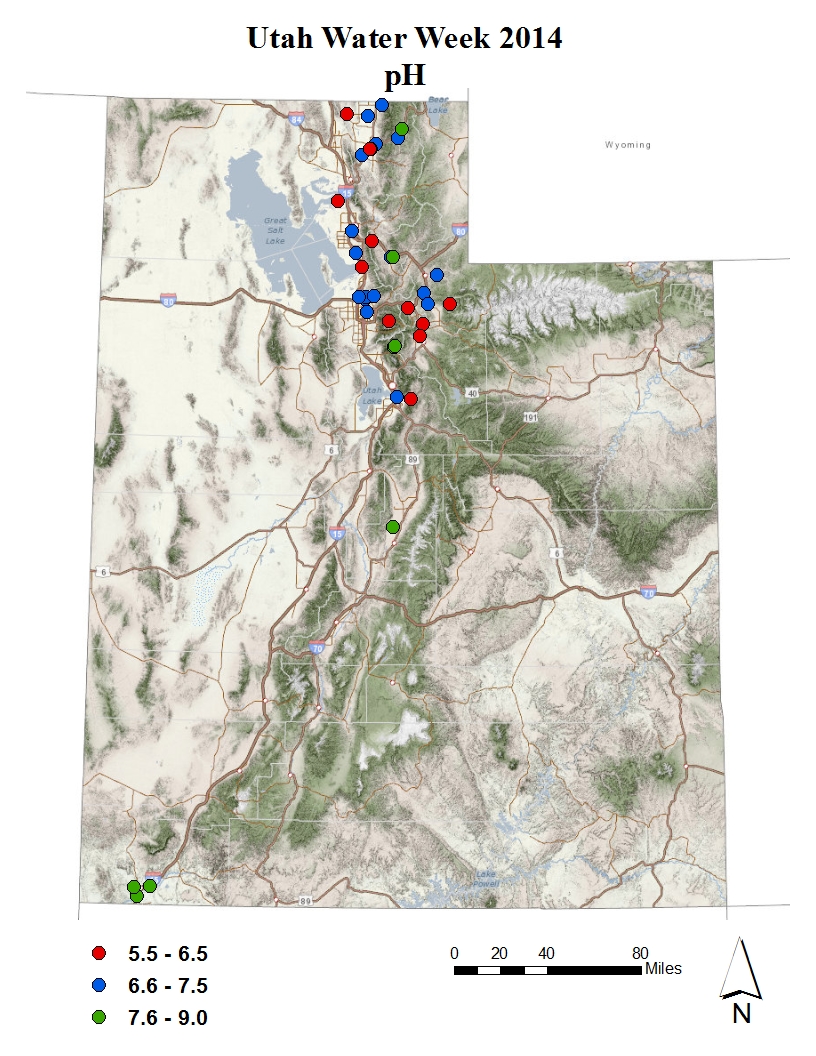
- The average pH for all sites was 7.2 with a maximum of 8.7 at Temple Fork and a minimum of 5.5 at Farmington Creek.


