HAB Squad
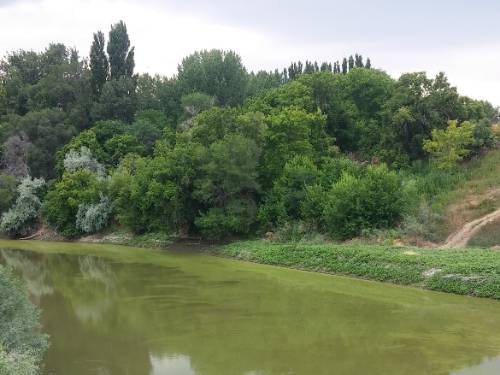
Volunteers monitor sites regularly and learn skills to identify if cyanobacteria (harmful algae) are present. Volunteers provide an important resource to notify the health department and state about concerns. In addition, some volunteers provide data to NOAA to build their satellite monitoring capabilities.
HAB Squad Instructions
Utah Water Watch
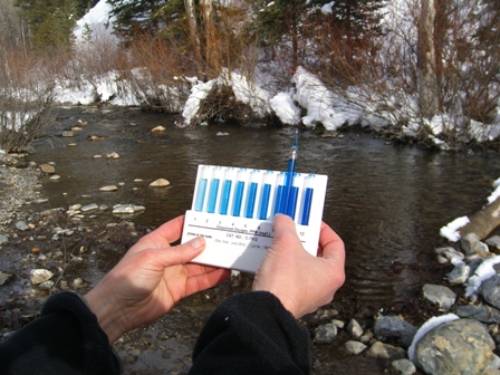
Utah Water Watch monitoring is recommended for beginners. With this program, you will learn monitoring basics and contribute your data to our online database.
Utah Water Watch Instructions
Additional Monitoring Programs
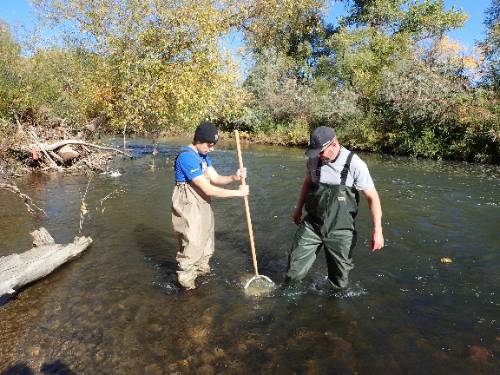
Additional monitoring is for retired professionals or others with a background in environmental monitoring. Additionally, we encourage Tier 1 volunteers with at least 2 years of volunteering experience to participate if desired. These volunteers work with local watershed coordinators or Utah Division of Water Quality scientists to collect high quality data for assessment purposes.
Additional Monitoring Instructions