An Alternate Method for Setting Codling Moth Biofix
October 2018
Diane Alston, Extension Entomologist (No longer at USU) • Marion Murray, Extension IPM Specialist • Rick Heflebower, Horticulture Agent (Washington County)
Quick Facts
- An alternate method for setting codling moth biofix (first moth emergence) was found to be effective for Utah’s fruit production regions.
- The new method, called “fixed-biofix,” uses latitude and elevation of orchard sites, rather than trap-capture, to predict biofix and timing of egg hatch during the growing season.
- The fixed-biofix method is simpler to implement and easier to explain to growers and crop consultants, and can be accessed online.
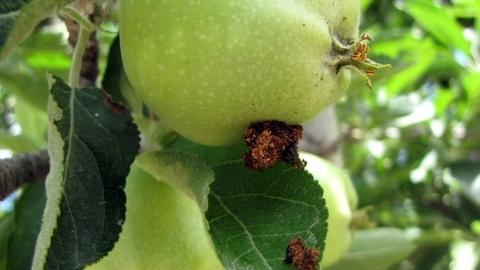
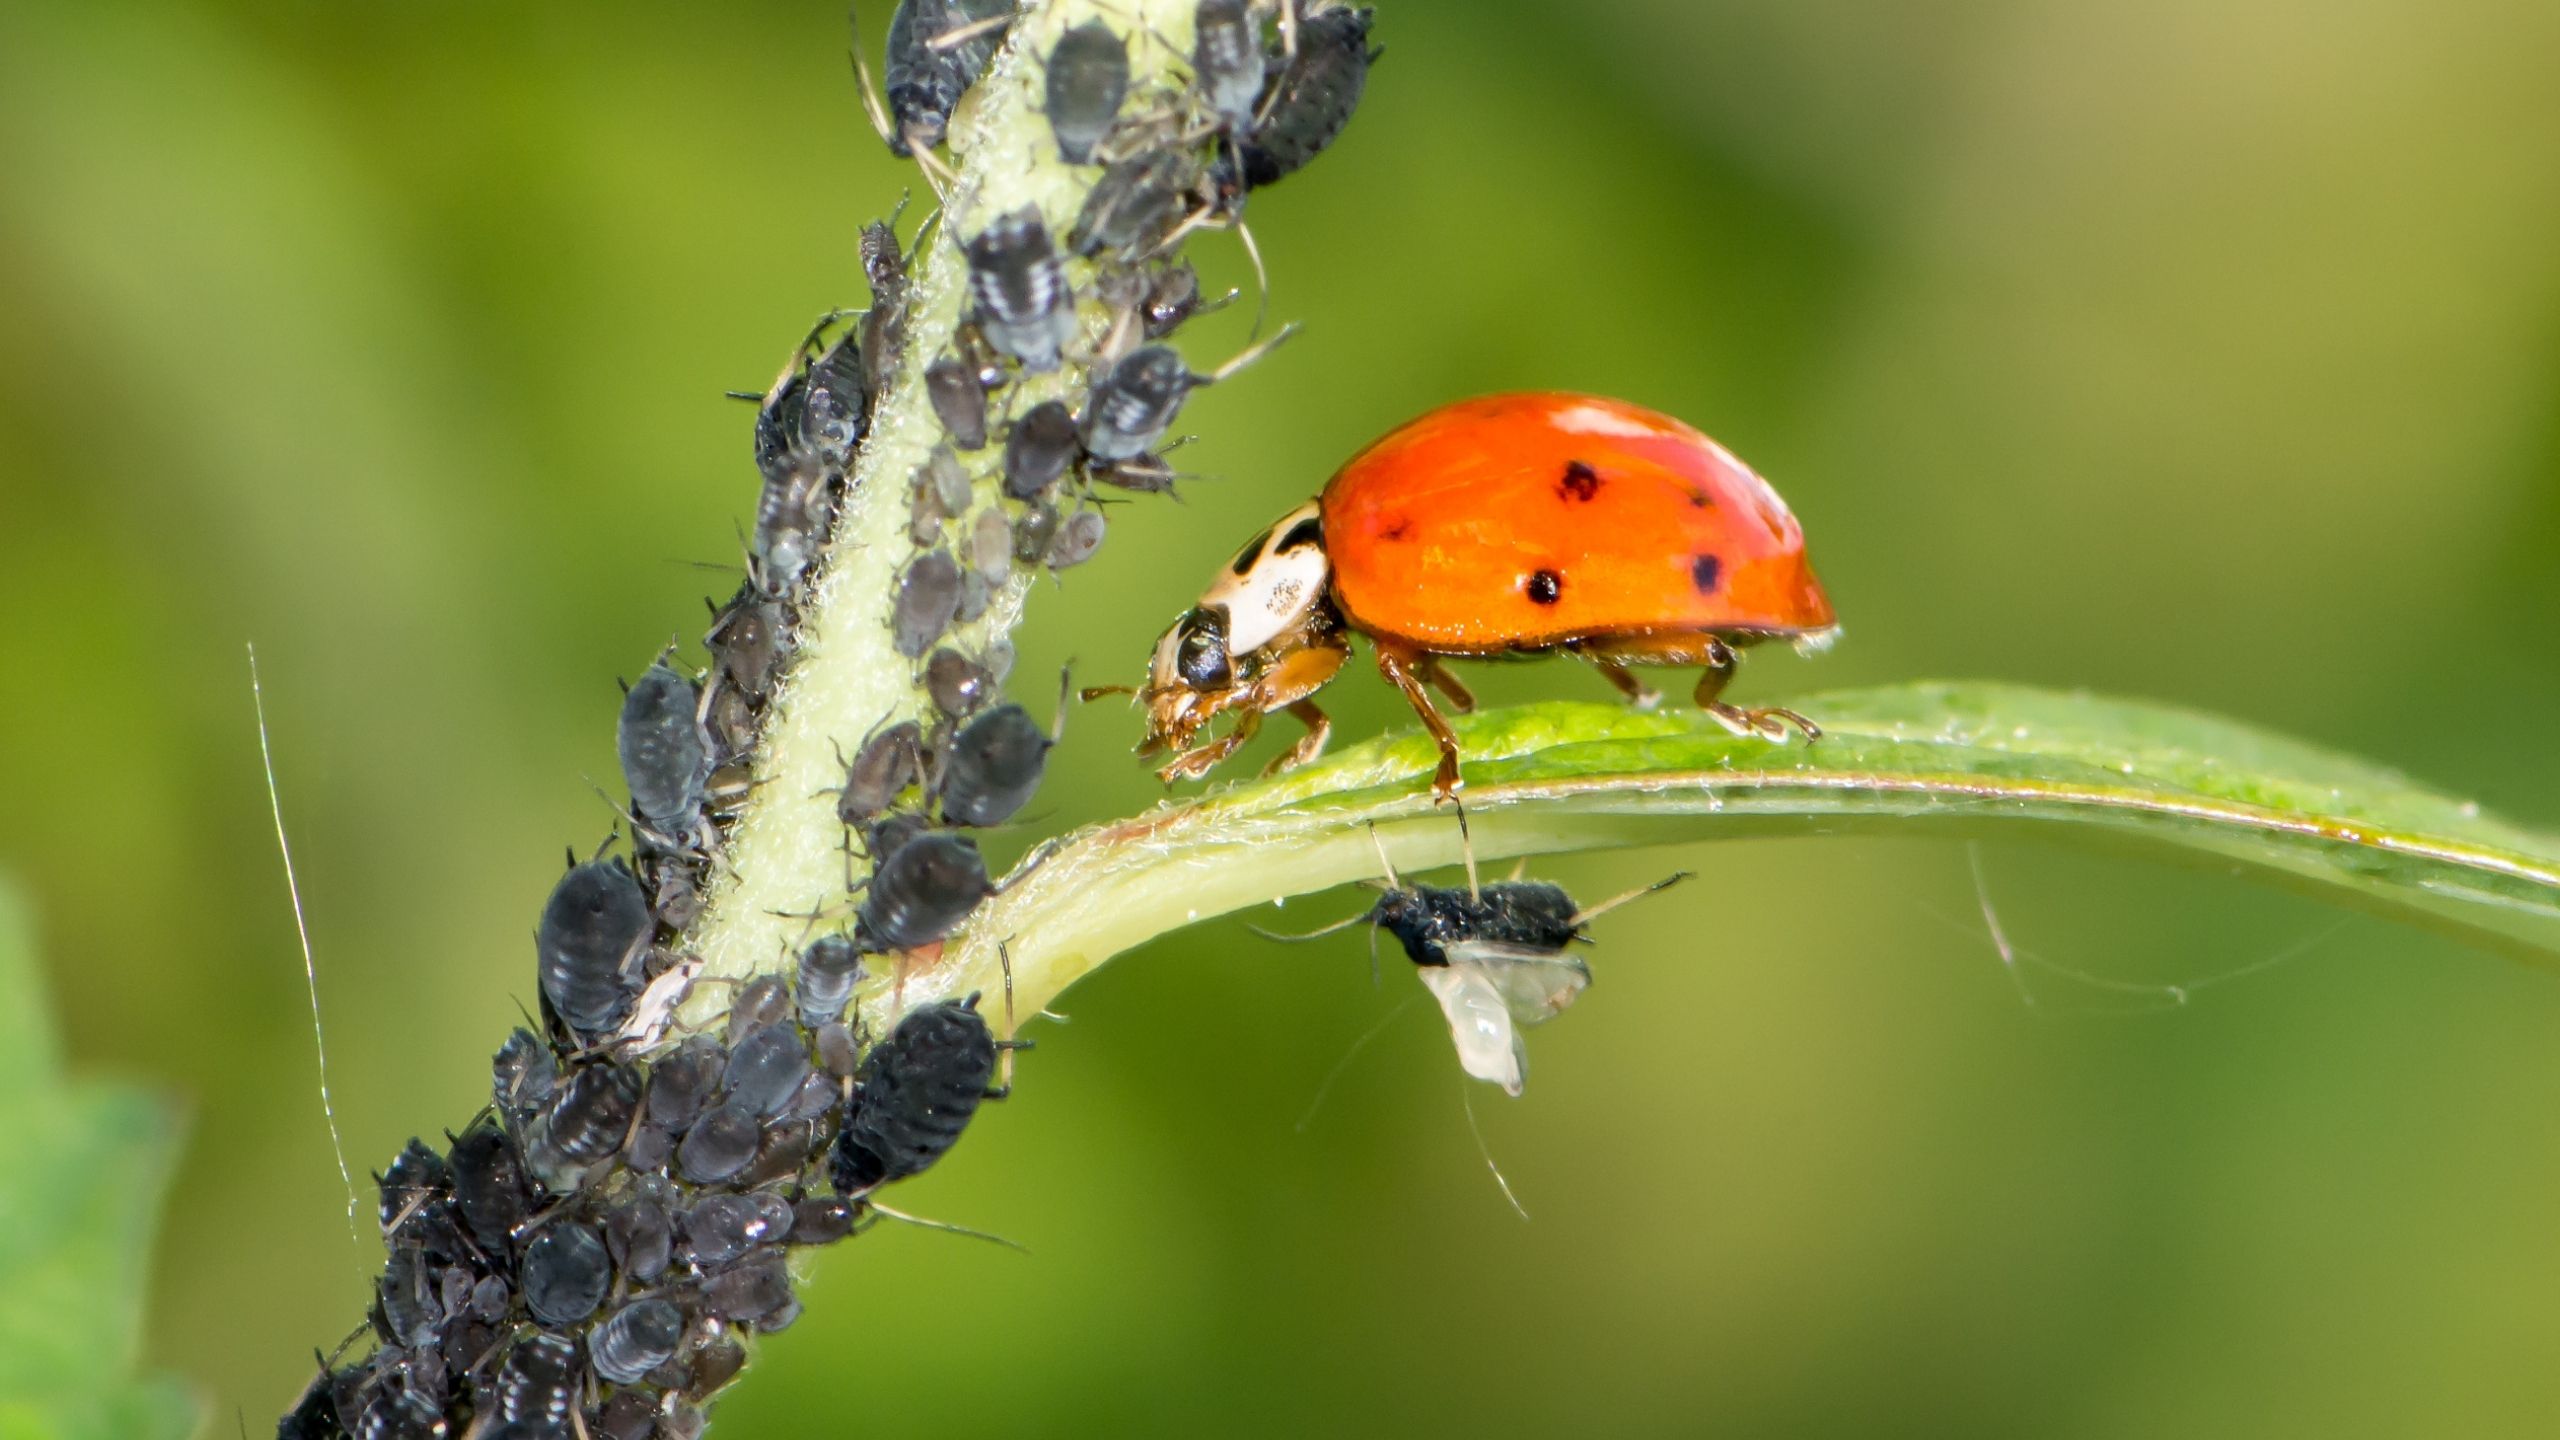
Codling moth, Cydia pomonella (L.) (Lepidoptera: Tortricidae), is the key insect pest of apple, pear, and walnut throughout the world, including Utah (apple and pear) (Fig. 1). Effective management practices are based on accurate determination of the first flight of codling moths in the spring, called “biofix.” Biofix is the starting point for a heat-driven development model [degree days (DDs)] that predicts the timing of egg hatch and entrance of young larvae into fruit, the target stages for management. An accurate biofix, plus the DD model, provide orchardists (commercial and home garden) with a convenient tool to determine optimal timing for codling moth management.
Challenges in Biofix-Setting
The traditional method for setting codling moth biofix is through the use of traps baited with the female sex pheromone, codlemone. Traps are placed in the orchard before the first male moths are expected to emerge in the spring, and checked daily until the date at which the first moths are caught.
To address the challenge of setting an accurate biofix date, researchers at Washington State University found that average codling moth emergence time on a DD scale starting on January 1 each year could be predicted using a site-specific equation, and negated the need to use traps (Jones et al. 2013).
Use of the trap-based method to set codling moth biofix has a number of disadvantages:
- Too few traps may be placed in an area to represent the diverse microclimates (slopes and aspects) that influence the timing of first emergence.
- Traps are checked too infrequently (daily is required).
- Inclement spring weather may delay moth flight.
- The use of mating disruption in commercial fruit production has decreased codling moth populations in some regions, especially in the spring, causing an inaccurate delay in the first moth capture in traps.
Sites at elevations less than 1,300 ft fit a simple quadratic equation using only latitude; however, for higher elevation sites, such as in Utah, a multiple regression model using latitude and elevation was required.
A study was undertaken in Utah’s apple-producing regions to validate the latitude-elevation model, and compare its precision with actual egg hatch and larval entry into fruit, the key life stage targets for insecticide applications.
Methods
The equation developed by Jones et al. (2013) was based on data from 366 location-years and 33 locations across the U.S. (including Utah) and three other countries. Including data from locations with elevations greater than 1,300 ft (400 m) required both latitude and elevation to accurately represent the data (Fig. 2). The multiple regression equation that best described the entire dataset was
To validate the accuracy of the regression equation to estimate biofix in a broader spectrum of Utah’s apple and pear-producing regions, 30 orchard location-years in northern and southern Utah were used in the study (Box Elder, Weber, Davis, Utah, Iron, and Washington counties) in 2016-2018. Locations were selected based on the availability of a nearby weather station to obtain temperature data for degree-day calculations, and presence of apple orchards conducive for codling moth sampling. At each location, we determined three different biofixes, which corresponded to the date of:
- First codling moth capture in traps using CM-DA Combo lures (Trécé Inc., Adair, OK) (“trap-biofix”).
- DDs calculated with the equation at left using elevation and latitude (“fixed-biofix”), with a January 1 start date.
- DDs calculated with the equation at left using elevation and latitude (“fixed-biofix”), with March 1 start date.
Beginning when egg hatch was predicted using the trap biofix method, for the 1st and 2nd generations of codling moth (220 and 1,120 DDs, respectively), 1,000 fruit were sampled in each orchard one to three times to verify start of egg hatch and first larval entries into fruit (Figs. 3 & 4).
Fruit were returned to the laboratory to check for egg hatch and larval entry status (Fig. 5). Egg hatch data was collected in 2016 and 2017, but not in 2018.
Mean emergence time (DDs) =
1755.599 - 66.777 x latitude + 0.676
x latitude² - 0.0347 x elevation (m)

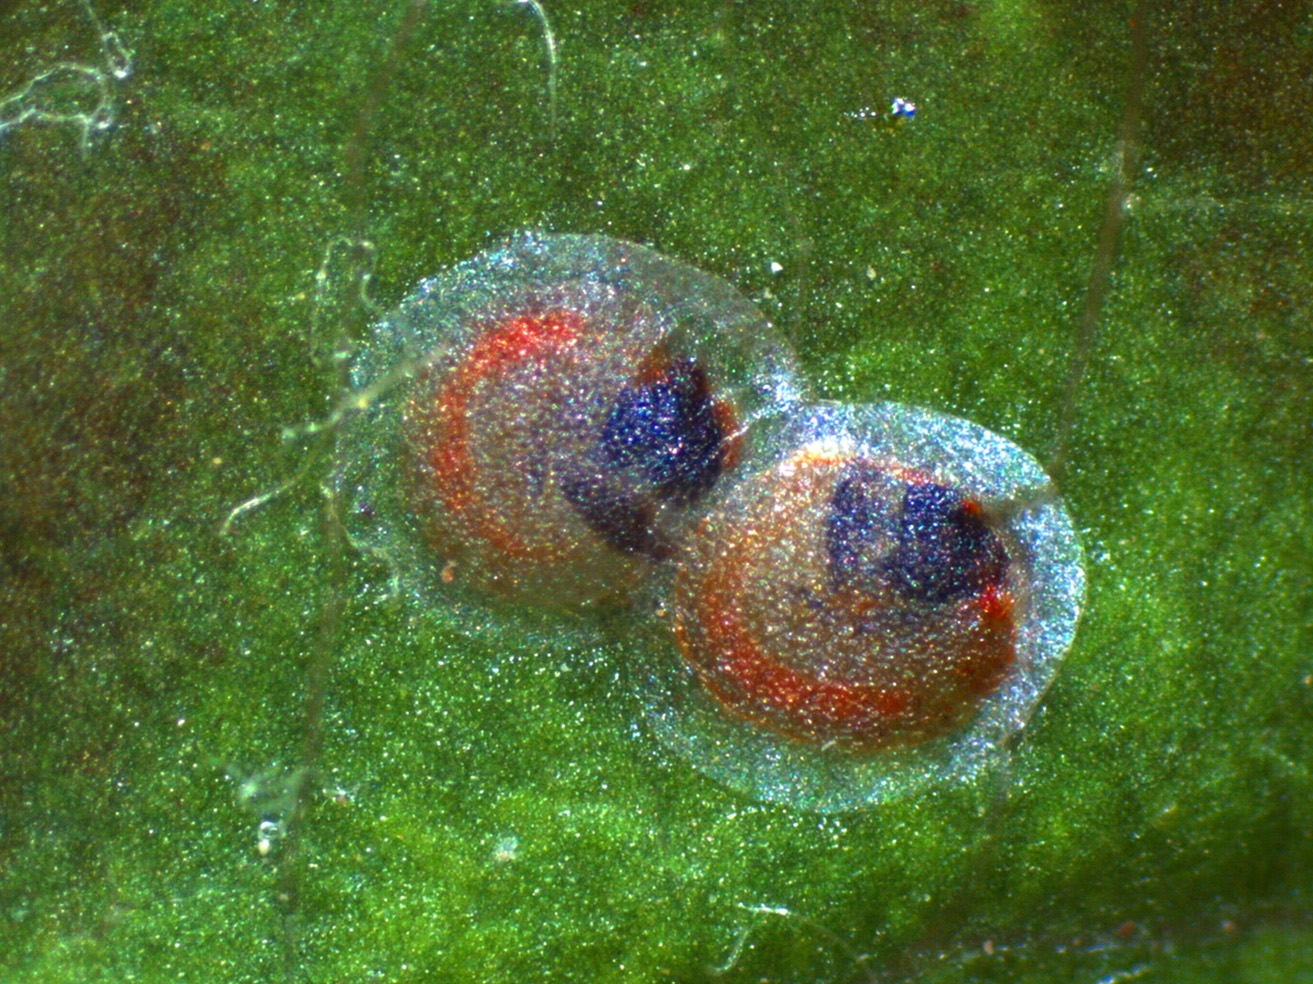
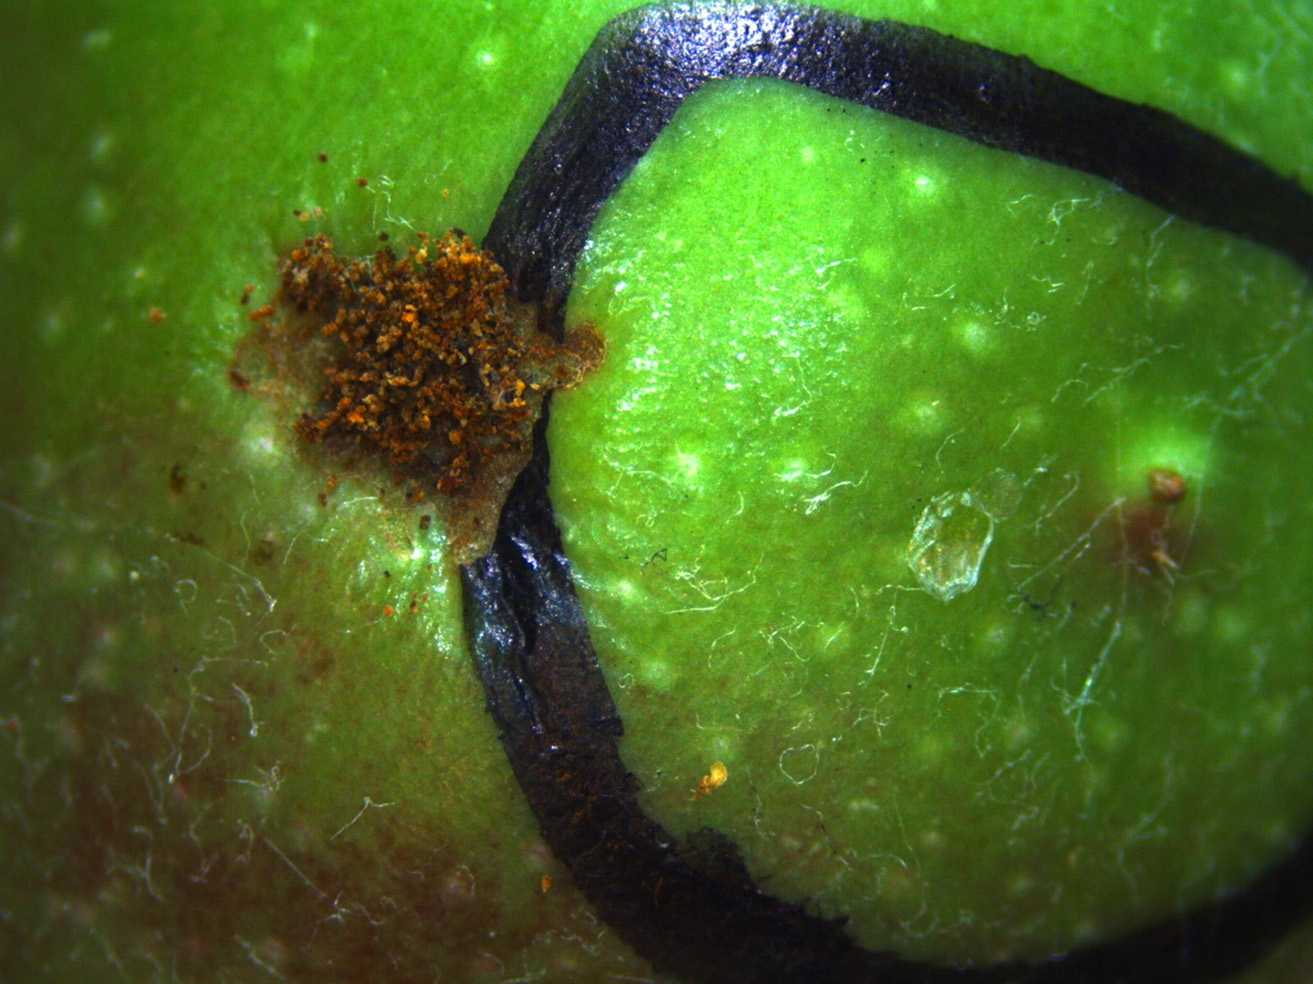
Table 1. The difference in number of days (range) between the new model (fixed-biofix) using March 1 as the start date, and the trap-biofix for predicting seasonal flight and egg hatch in 30 orchard location-years in northern and southern Utah, 2016- 2018. Start and end of egg hatch periods for the 1st and 2nd codling moth generations are provided. Positive numbers indicate equation predictions were earlier than traps; negative numbers indicate equation predictions were later than traps.
| Location | Biofix | Start 1st Egg Hatch | End 1st Egg Hatch | Start 2nd Egg Hatch | End 2nd Egg Hatch |
|---|---|---|---|---|---|
| Perry1 | 3 to 6 | 2 to 3 | -2 to 3 | -3 to 1 | 1 |
| Kaysville2 | 4 to 21 | 3 to 9 | 1 to 6 | 1 to 8 | 2 to 4 |
| American Fork3 | 0 to 13 | 0 to 5 | 0 to 2 | 0 to 2 | 0 to 2 |
| Payson3 | -1 to 0 | -4 to 0 | 0 | 0 to -1 | 0 to -1 |
| Santaquin3 | 1 to 6 | 0 to 1 | 0 to 2 | -1 to 1 | 0 to 1 |
| West Mountain3 | -2 to 1 | -3 to 2 | -1 to 1 | -1 to 1 | -1 to 1 |
| Genola3 | -1 to 1 | 1 to 2 | 0 to 4 | 1 to 3 | 1 to 3 |
| Cedar City4 | -11 to -1 | -5 to 0 | -3 to 4 | -3 to 3 | -3 to 3 |
| New Harmony5 | -4 to 6 | -9 to 2 | -2 to 1 | -2 to 1 | -2 to 1 |
1located in Box Elder County
2located in Davis County
3located in Utah County
4located in Iron County
5located in Washington County
Results
We found that for the two fixed-biofix options (options 2 and 3 on the previous page), using a start date of March 1 correlated more closely to the trap-biofix in each year; therefore, a March 1 start date was used for data analyses.
To compare the accuracy of the DD predictions based on the fixed-biofix to trap-biofix for the three years (2016- 2018), we calculated the difference in number of days for critical codling moth phenological events (e.g., start and end of 1st and 2nd generation egg hatch) (Table 1).
We observed variation in dates between the fixed- and trap-biofix methods across the 10 orchard locations in the three years, ranging from 11 days early to 21 days late. However, this early variation in number of days between methods for biofix became less pronounced over the course of the season. The error rate for predicting start and end of egg hatch periods for the first and second generation of codling moth across all locations and years was < 9 days. The majority of locations across years did not vary more than 5 days between the two methods, and were often within 3 days.
Our fruit sampling data confirmed that start of egg hatch and first larval entry aligned well with using the fixed-biofix for the codling moth DD model in both 2016 and 2017 (egg hatch data were not collected in 2018).

Recommendations
A convenient and accurate method to set codling moth biofix is critical to effective codling moth management. Our target error rate for differences between the two methods was < 5 days. Although there was a greater range in setting biofix dates for most orchard locations, the predictions for 1st- and 2nd-generation start and end of egg hatch did fall within the target range using the fixed biofix method for most locations (Table 1).
The chance of differing biofix dates between the two methods is greater because daily DD accumulations around the start of flight are low (e.g., few DDs accumulated per day when temperatures are cool in the spring); therefore, even small variations in DDs can result in a large difference in number of days. However, the DD accumulations at biofix are only a small proportion of DD accumulations needed for the key phenological events of start and end of egg hatch that occur later in the season. The resulting “fixed-biofix” management program is simpler and lower cost to implement, and easier to explain to growers and crop consultants than a trap-biofix method. Given the relatively low variation in prediction of egg hatch between the two methods, the fixed-biofix method is appropriate for use in Utah.
 Utah Traps
This tool was developed with the Utah Climate Center, and provides accurate dates to implement pest management actions for approximately 70 locations in Utah. Growers can also monitor for frost, wind, soil moisture, and more at 22 of those locations.
On the TRAPs site, the new codling moth model is labelled, “Codling Moth-Fixed Biofix.”
The results of this Utah study support the validity of using the Jones’ equation to set biofix, with a March 1 start date. This alternative biofix-setting option will help balance issues with spring temperature variation, low codling moth populations, and trap operation errors that lead to challenges in setting accurate biofix dates with pheromone traps.
The fixed-biofix model was included in the Utah TRAPs (Temperature Resource and Alerts for Pests) website in 2018, and tested that season for accuracy.
Predicted emergence, or biofix, timings in DDs for the representative apple and pear production areas of northern and southern Utah are presented in Table 2. Training of Utah’s tree fruit industry in the efficiency and accuracy of the equation-based biofix-setting model (fixed-biofix) is on-going.
Table 2. Predicted emergence time [fixed-biofix from Jones et al. (2013), in degree days (DDs)] for apple and pear production regions of northern and southern Utah.
| Location | Latitude | Elevation (ft) | Biofix (DDs) |
|---|---|---|---|
| Northern Utah | |||
| Perry1 | 41.458 | 4,403 | 184 |
| Roy2 | 41.162 | 4,541 | 188 |
| Kaysville3 | 41.022 | 4,344 | 194 |
| American Fork4 | 40.392 | 4,613 | 202 |
| Payson4 | 40.036 | 4,874 | 205 |
| Santaquin4 | 39.991 | 4,844 | 207 |
| West Mountain4 | 40.028 | 4,688 | 209 |
| Genola4 | 40.005 | 4,715 | 209 |
| Southern Utah | |||
| Cedar City5 | 37.707 | 5,627 | 251 |
| New Harmony6 | 37.482 | 5,197 | 265 |
1located in Box Elder County
2located in Weber County
3located in Davis County
4located in Utah County
5located in Iron County
6located in Washington County
References
- Jones, V. P., M. Doerr, and J. F. Brunner. 2008. Is biofix necessary for predicting codling moth (Lepidoptera: Tortricidae) emergence in Washington state apple orchards? Journal of Economic Entomology 101 (5): 1651-1657.
- Jones, V. P., R. Hilton, J. F. Brunner, W. J. Bently, D. G. Alston, B. Barrett, R. A. Van Steenwyk, L. A. Hull, J. F. Walgenbach, W. W. Coates, and T. J. Smith. 2013. Predicting the emergence of the codling moth, Cydia pomonella (Lepidoptera: Tortricidae), on a degree-day scale in North America. Pest Management Science DOI 10.1002/ps.3519.
Related Research
What Is Biochar and How Is It Used?
Biochar is a charcoal-like product that contains no petroleum. It is made by heating biomass such as herbaceous or woody crop residues, non-salvageable timber and slash, or animal manure, in a contained system. There are many potential uses for biocha
General Concepts of Biological Control
“Balance of Nature.” Virtually all pest populations are affected by natural enemies to some extent. In many cases, natural enemies are the primary regulating force of the pest populations.

Using Degree Days to Time Treatments for Insect Pests
Degree days (often referred to as “growing degree days”) are accurate because insects have a predictable development pattern based on heat accumulation. Insects are exothermic (“cold-blooded”) and their body temperature and growth are affected by their su

Important Components of a Successful Pest Management Program
The lowest population density of a pest that will cause economic damage; or the amount of pest injury which will justify the cost of control.

Pest Management Decision-Making: The Economic-Injury Level Concept
Pest managers cannot afford to take a pest management action without knowing if it is economically sound. Treating a pest needlessly is not conducive to making a profit. Other values such as aesthetics of the management situation (pertinent to landscapes

The Integrated Pest Management (IPM) Concept
The term Pest Management came about in the early 1960’s, which then evolved into Integrated Pest Management (IPM). However, many aspects of IPM have been practiced since plants were first cultivated by humans.

Integrated Pest and Pollinator Management
An inextricable link exists between humans and pollinators, with benefits that include ecosystem health and function and human food security. Bees, butterflies, moths, wasps, flies, and beetles are responsible for most of the world’s pollination servic
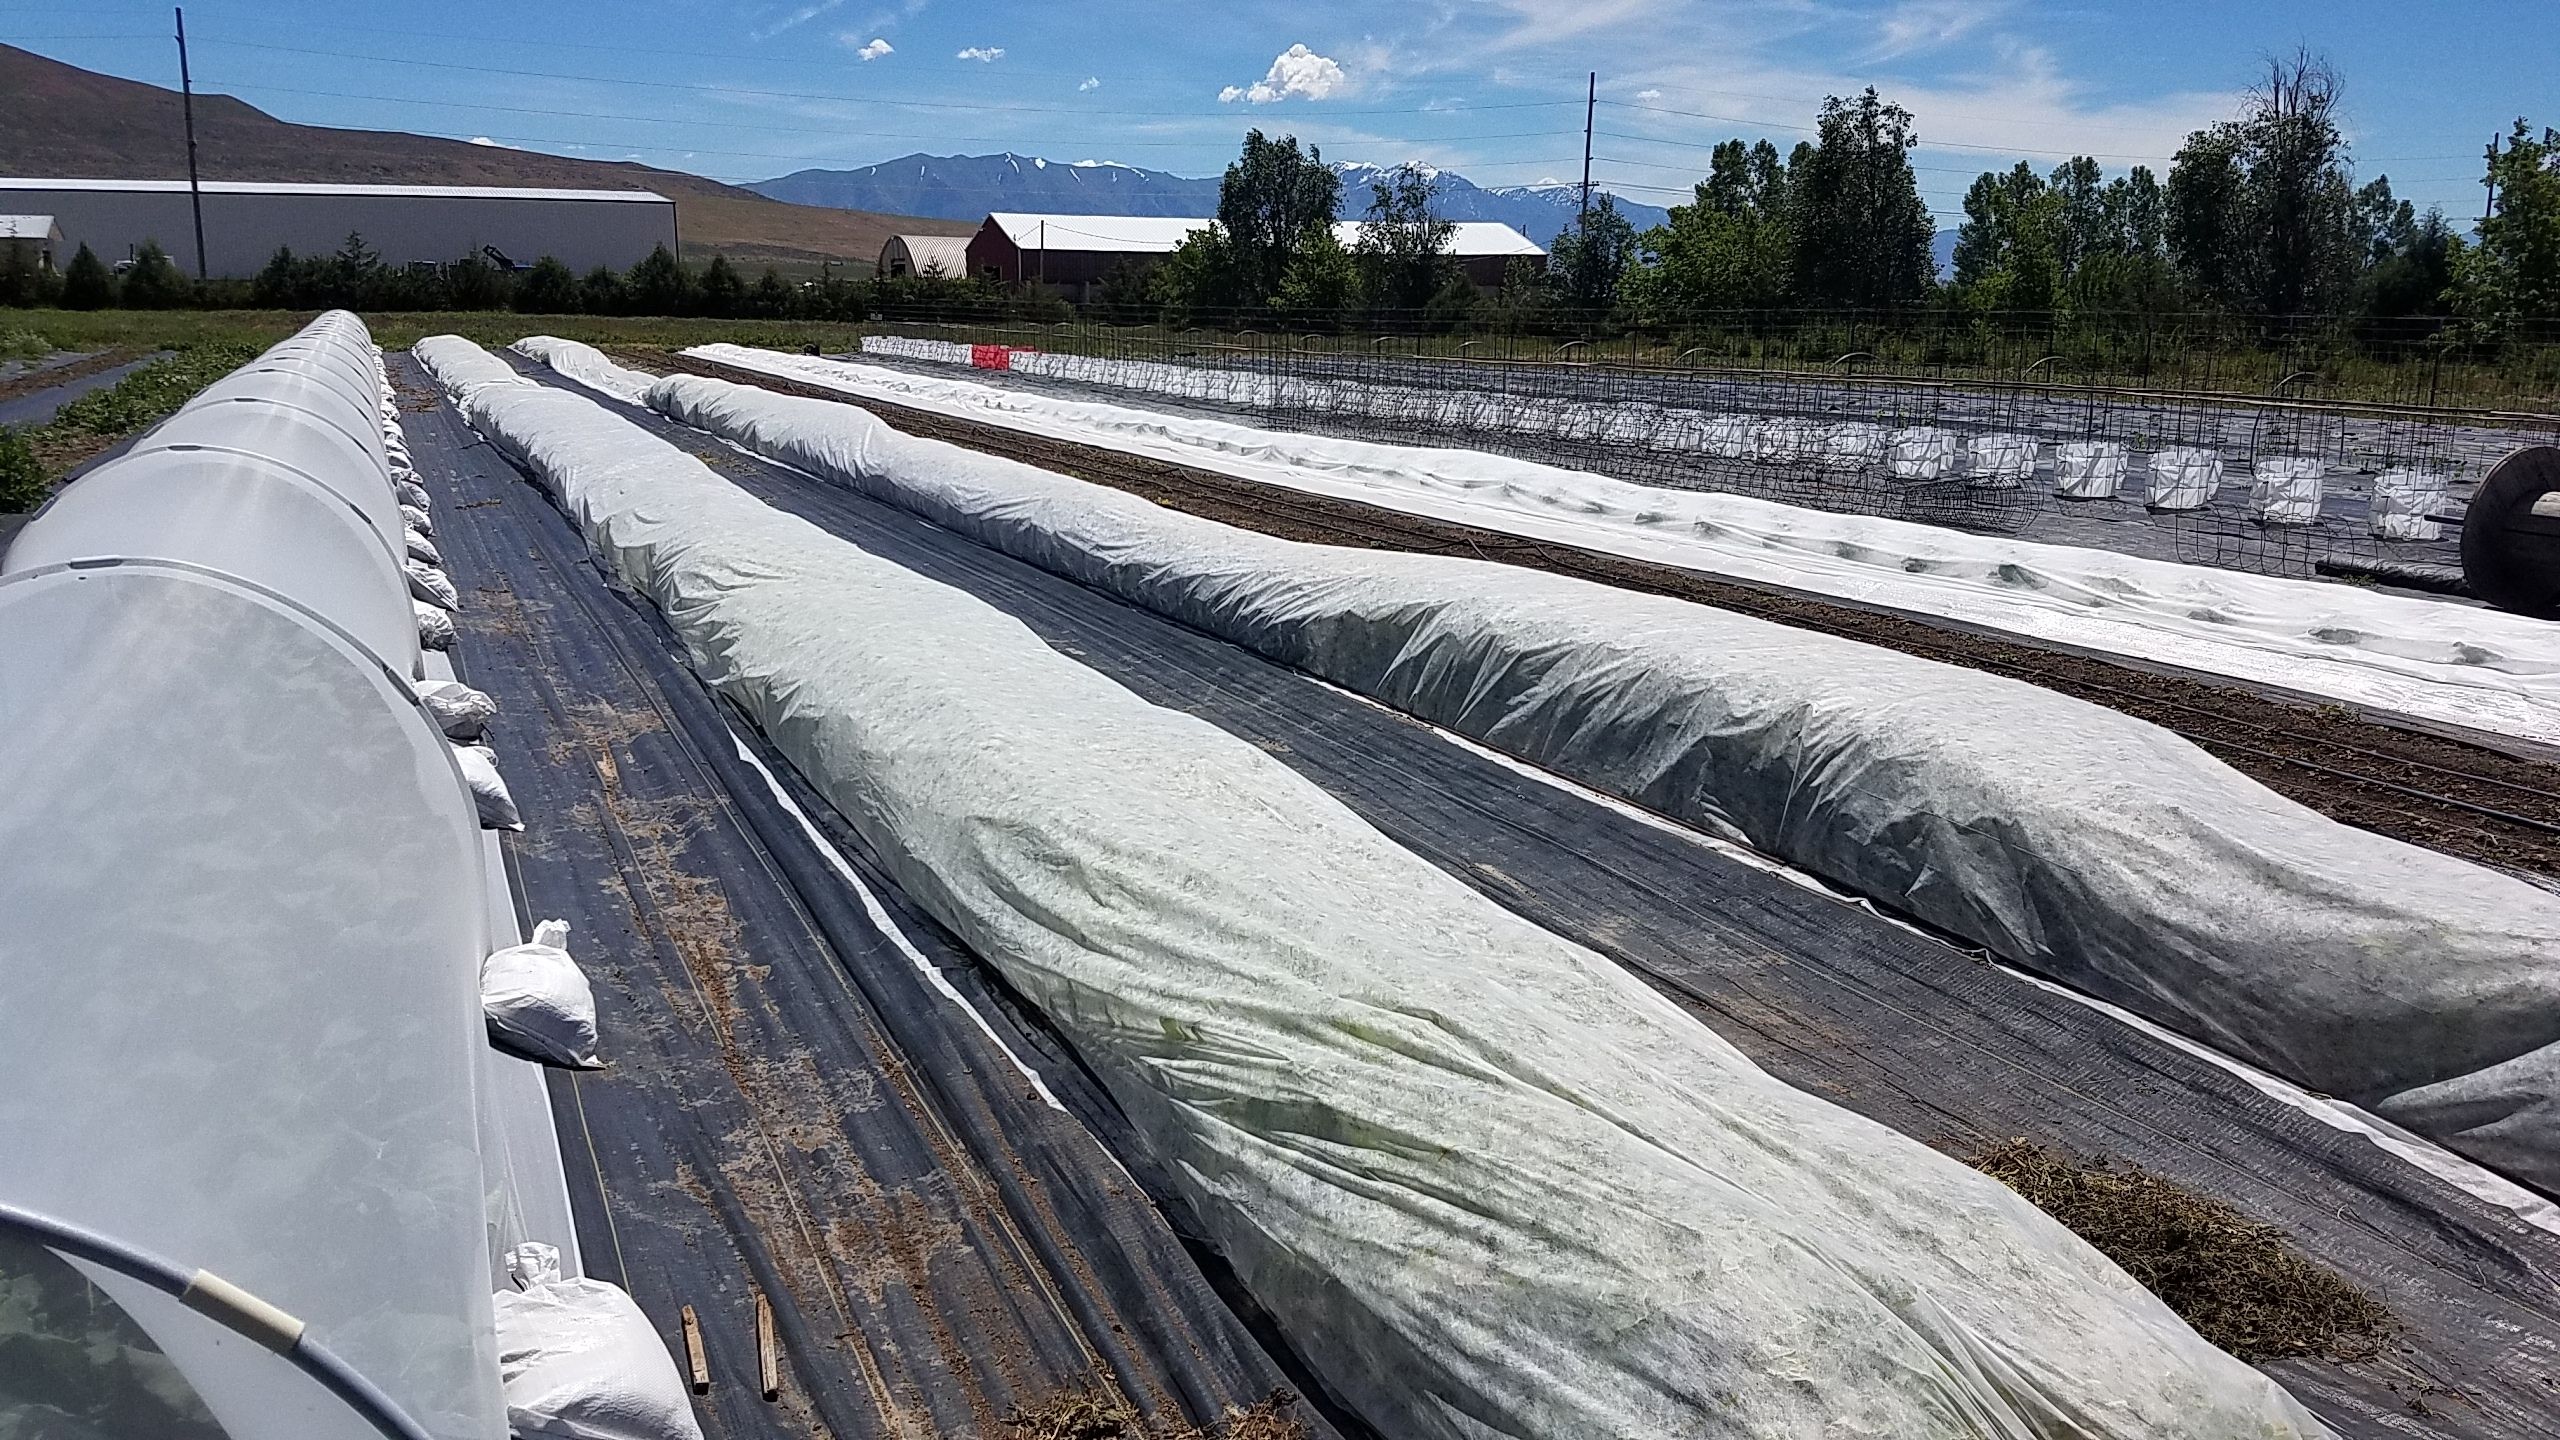
Row Covers
Row covers on Utah farms. As an integrated pest management tool, row covers act as a physical barrier that prevents the movement of pests such as insects, birds, and mammals, to host plants.