Impacts of Drought on Tribal Economies in Nevada
Introduction
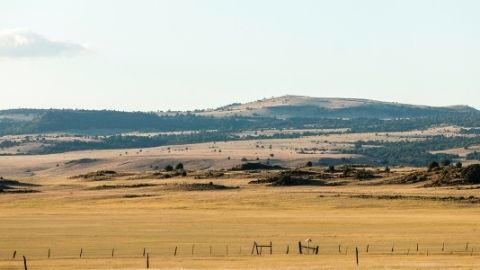
Drought negatively impacts agricultural productivity, often causing reduced crop yields, damage to pasture/range, and reduced plant growth (e.g., Hatfield et al., 2011; Kuwayama et al., 2019). Droughts are particularly concerning for Native American reservations in the arid Western United States, as agricultural production on the reservations provides an important economic base (Deol & Colby, 2018). Close cultural and economic ties to natural resources, geographic remoteness, and economic challenges render Indian reservations vulnerable to climate change impacts (U.S. Global Change Research Program, 2014). Sustaining agricultural production (e.g., crops, food, livestock) on tribal lands will become progressively more challenging in the future due to decreased water availability, extended droughts, and changes in precipitation amounts and timing.
The objective of this fact sheet is to illustrate the economic impacts of drought on agriculture and reservation economies in Nevada. Nevada is the driest state in the United States, with an average yearly precipitation of 9.96 inches, and 71% of the state experienced abnormally dry conditions over the past 20 years. The results discussed here cover four reservations located in Nevada, including the Duck Valley Indian Reservation, Goshute Indian Reservation, Pyramid Lake Indian Reservation, and the Washoe Tribe of NV/CA. As shown in Table 1, these reservations suffer from poverty and unemployment levels above the United States averages, while median household income is below the United States average. Also, employment in agriculture and related industries is above the United States average for several reservations.
| Table 1. Selected Economic Indicators by Reservation (2018) | ||||
|---|---|---|---|---|
| Geographic Area | Population Below Poverty Level (%) | Employment in Agriculture, Forestry, Fishing/Hunting, and Mining (%) | Unemployment Rate (%) | Median Household Income ($) |
| Duck Valley | 36.2 | 9.5 | 18.4 | 35,750 |
| Goshute | 33.6 | 1.9 | 25.7 | 37,500 |
| Pyramid Lake | 19.0 | 6.5 | 18.7 | 40,625 |
| Washoe | 13.8 | 1.1 | 10.0 | 50,951 |
| United States | 11.8 | 1.8 | 5.9 | 64,324 |
Source. Data from U.S. Census Bureau (2020).
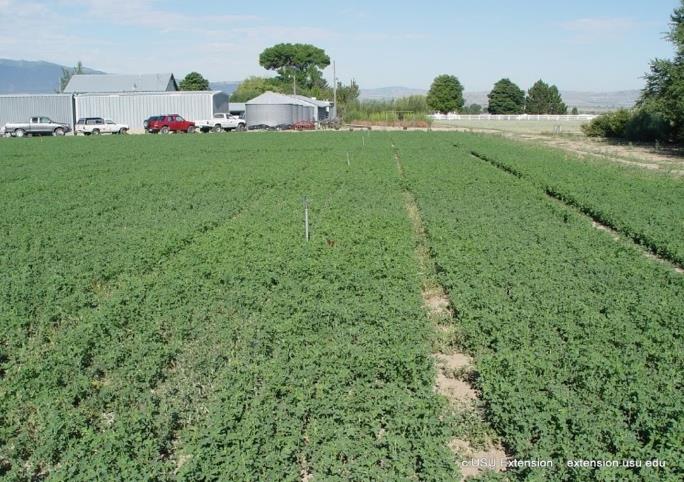
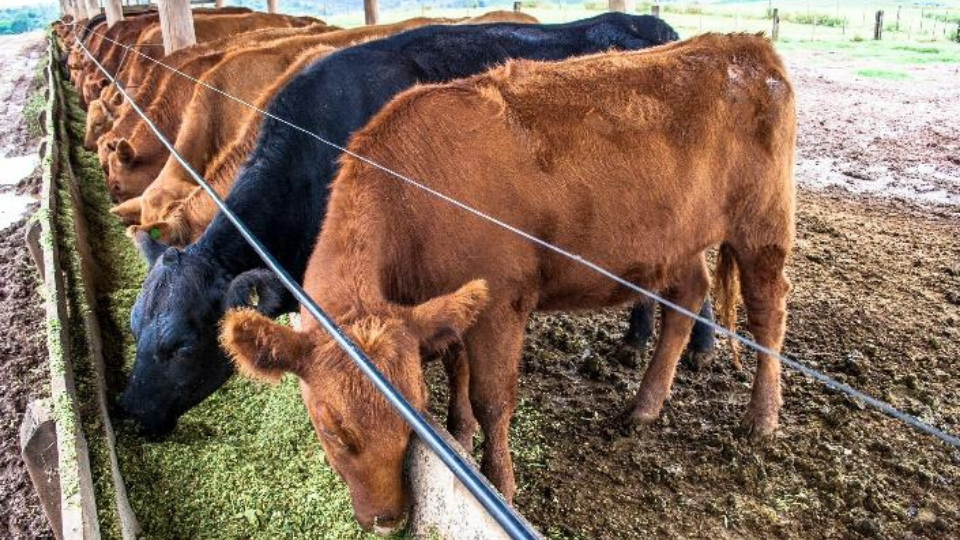
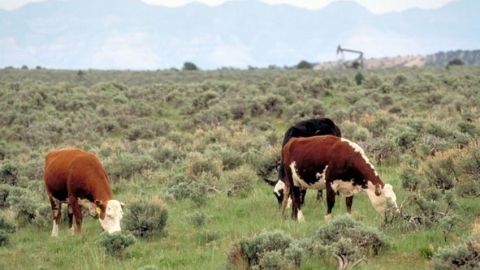
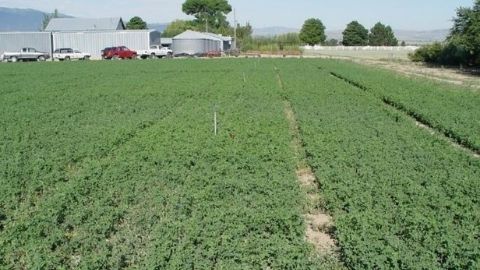
Of all agricultural sales in Nevada, “cattle and calves” represent 37%, making it the most important agricultural sector in Nevada, and “hat/forage” (all irrigated) represent 34% (USDA NASS, 2019). Of all cattle inventory and harvested hay/alfalfa acres in Nevada, 50% and 30%, respectively, are located in reservation counties (USDA NASS, 2020). Table 2 provides 2018 cattle inventory and hay production in acres by reservation.
| Reservation | Nevada Counties (Reservation % Share of County Area) | Cattle Inventory | Hay Production |
|---|---|---|---|
| Duck Valley | Elko (1%) | 1,640 | 140 |
| Goshute | White Pine (1%) | 340 | 70 |
| Pyramid Lake | Lyon (.02%), Storey (.25%), Washoe (11%) | 1,480 | 5 |
| Washoe | Douglas (19%) | 3,130 | 700 |
Note. Values calculated using cattle and hay production data by county, reservation share (USDA NASS, 2020).
Calculating Economic Impacts
We used cattle inventory (head) and hay yield (tons/acre) data from the United States Department of Agriculture (USDA) National Agricultural Statistical Service (NASS). Precise cattle inventory and hay production data is not available for each reservation, so values were estimated using available county-level data, reservation share only. Data spanned from 1981 to 2016.
To measure drought, we used the Palmer Drought Severity Index (PDSI) data from the Center for Disease Control and Prevention (CDC), provided by the Cooperative Institute for Climate and Satellites – North Carolina (CICS-NC). PDSI values were compiled using temperature and precipitation data. PDSI can range from -10 to 10, but typically -4 to 4, where 0 represents normal conditions and negative/positive values represent drier/wetter conditions.
First, we applied panel data analysis to examine how drought impacts cattle inventory and hay yields. We then used the regression estimates to calculate cattle and hay production losses under defined drought scenarios. Finally, we estimated the dollar value of cattle and hay production losses for each reservation, which represents the direct impacts of drought. These were used to determine total economic impacts (losses) to each reservation. Total economic impacts include (1) direct impacts (e.g., losses in cattle and hay sectors); (2) indirect impacts (e.g., losses in related sectors, which either sell inputs to the cattle and hay sectors, such as feed, seeds, labor, and veterinary services, or purchase output of cattle and hay sectors, such as food processing); and (3) induced impacts (e.g., losses due to reduced household income and spending throughout the economy, as well as reduced tax revenues).
Drought Impacts on Cattle Inventory and Hay Yields
The impacts of PDSI (drought severity), drought duration (years), and wet periods (years) were used to estimate the impacts of drought on cattle inventory and hay yields. Results show that drought affects cattle inventory and hay yields significantly but differently.
First, drought negatively affects cattle inventory and hay yield during the year that conditions become drier. Specifically, a decrease in PDSI by 1 unit (drier conditions) results in a 0.3% decrease in cattle inventory and a 0.4% decrease in hay yields in the first year of drought. Drought also has a longterm negative impact on cattle inventory but no long-term impact on hay yields. Specifically, a oneyear duration of very dry conditions (that is, PDSI below -1.9) results in a 1.87% decrease in cattle inventory in the following year. Cattle producers are impacted by drought through reduced feed availability and/or higher feed costs, which may motivate them to cull or sell cattle earlier than planned. The reduction of breeding stock affects post-drought cattle inventory (Shrum et al., 2018).
Direct and Total Economic Impacts of Drought on Tribal Communities
Two assumed drought scenarios and their impacts on cattle inventory and hay yields in Table 3 were used to estimate the direct and total economic impacts of drought. Direct losses of drought affecting the cattle sector range from $13,700 on the Goshute Reservation to $100,500 for the Washoe Tribe (see Table 4). Total economic impacts due to drought affecting the cattle sector range from $26,600 on the Goshute Reservation to $198,000 for the Washoe Tribe, with total economic losses of $588,800 for all four reservations (only for areas located in Nevada).
We calculated the direct and total impacts with the assumption that very dry conditions (PDSI less than -1.9) last for two years, causing a 3.72% decrease in cattle inventory, but the impacts can be scaled up or down. For example, for a one-year drought, the estimated impacts would be half.
The direct losses of drought for the hay sector range from $30 on the Pyramid Lake Indian Reservation to $4,200 for the Washoe Tribe (see Table 5). Total economic impacts due to drought for the hay sector range from $200 on the Pyramid Lake Reservation to $13,100 for the Washoe Tribe, with total economic losses of $16,600 across all four reservations.
Again, we calculated direct and total impacts with the assumption that PDSI decreases by 2 units, causing an 0.87% decrease of hay yields, but the impacts can be scaled up or down. For example, for PDSI decrease by 1 unit, the estimated impacts would be half.
| Table 3. Drought Scenarios and Impacts on Cattle Inventory and Hay Yields | ||
|---|---|---|
| Product | Scenario Description | Total Impact |
| Cattle | Two-year drought: PDSI decreases below -1.9 and stays the same for two years, then increases back to the pre-drought level. | -3.72% |
| Hay | PDSI decreases by 2 units. | -0.87% |
| Table 4. Economic Impacts of Drought for the Cattle Sector (in Thousand $) | ||||
|---|---|---|---|---|
| Reservation (NV area only) | Direct Impacts | Indirect Impacts | Induced Impacts | Total Impacts |
| Duck Valleya | 88.9 | 71.8 | 35.7 | 196.4 |
| Goshutea | 13.7 | 12.9 | 0.0 | 26.6 |
| Pyramid Lake | 61.1 | 78.3 | 28.3 | 167.8 |
| Washoea | 100.5 | 69.2 | 28.3 | 198.0 |
| Total | 264.2 | 232.2 | 92.3 | 588.8 |
Note. aThe area located in Nevada only.
| Table 5. Economic Impacts of Drought for the Hay Sector (in Thousand $) | ||||
|---|---|---|---|---|
| Reservation (NV area only) | Direct Impacts | Indirect Impacts | Induced Impacts | Total Impacts |
| Duck Valleya | 0.5 | 0.7 | 0.5 | 1.8 |
| Goshutea | 0.6 | 0.7 | 0.3 | 1.6 |
| Pyramid Lake | 0.0 | 0.1 | 0.0 | 0.2 |
| Washoea | 4.2 | 5.8 | 3.2 | 13.1 |
| Total | 5.3 | 7.3 | 4.1 | 16.6 |
Note. aThe area located in Nevada only.
Conclusions
Reductions in cattle and hay production due to drought result in reduced economic activity in related sectors and significant economic losses to tribal economies. Calculated direct and total economic impacts are larger for the cattle sector than for the hay sector since drought affects cattle production in the long term, and the cattle production is more prominent on the reservations in Nevada. Although estimated disruptions in hay production due to drought are smaller, reduced hay availability may have considerable negative consequences for cattle production if it depends heavily on hay for feed as a result of reduced grazing efficiency.
In conclusion, droughts represent a threat to tribal economies, where agriculture plays an important role. These results highlight the need for education and policy to improve the ability of reservation agricultural operations to prepare for and respond to drought.
References
- Deol, S., & Colby, B. (2018). Tribal economies: Water settlements, agriculture, and gaming in the western U.S. Journal of Contemporary Water Research & Education, 163(1), 45–63.
- Hatfield, J. L., Boote, K. J., Kimball, B. A., Ziska, L. H., Izaurralde, R. C., Ort, D., Thomson, A. M., & Wolfe, D. (2011). Climate impacts on agriculture: Implications for crop production. Agronomy Journal, 103(2), 351–370.
- Kuwayama, Y., Thompson, A., Bernknopf, R., Zaitchik, B., & Vail, P. (2019). Estimating the impact of drought on agriculture using the U.S. Drought Monitor. American Journal of Agricultural Economics, 101(1), 193–210.
- Shrum, T. R., Travis, W. R., Williams, T. M., & Lih, E. (2018). Managing climate risks on the ranch with limited drought information. Climate Risk Management, 20, 11–26.
- U.S. Census Bureau. (2020). 2014–2018 American community survey 5-year estimates [Data set]. https://www.census.gov/tribal/
- U.S. Global Change Research Program. (2014). National climate assessment. http://nca2014.globalchange.gov/report
- USDA NASS. (2019). 2017 Census of agriculture. https://www.nass.usda.gov/Publications/AgCens us/2017/Full_Report/Volume_1,_Chapter_1_US /usv1.pdf
- USDA NASS. (2020). Quick stats [Data set]. https://quickstats.nass.usda.gov/
Authors
Tatiana Drugova, Postdoctoral Fellow, Department of Applied Economics; Kynda Curtis, Professor and Extension Specialist, Department of Applied Economics; Man-Keun Kim, Associate Professor, Department of Applied Economics

Kynda Curtis
Food Systems Specialist
APEC Dept
Related Research
Drought Mitigation for Cow/Calf Producers: Depopulation Strategies
A drought is a recurring event faced by many cow/calf producers across the nation. As drought events increase in their severity, it is important for cattle producers to have a management plan to mitigate the economic effects of drought. Two of the most co
Drought-Tolerant Options for Southwest Agriculture: Edible Produce
This fact sheet is the second in a series of three that provide an overview of drought-tolerant crops, grasses, and native plants, which may assist in maintaining agricultural production for food and feed and sustain grasslands and rangelands in the arid
Drought-Tolerant Options for Southwest Agriculture: Grasses, Grains, and Legumes
This fact sheet is the first in a series of three that provide an overview of drought-tolerant crops, grasses, and native plants, which may assist in maintaining agricultural production for food and feed and sustain grasslands and rangelands in the arid S
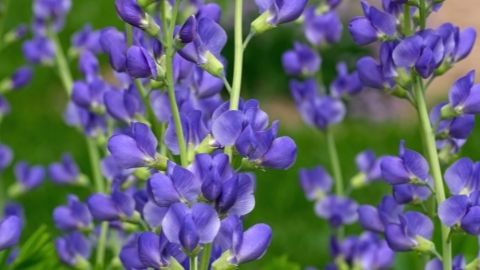
Drought-Tolerant Options for Southwest Agriculture: Ornamentals, Herbs, and Cosmetics
This fact sheet is the third in a series of three that provide an overview of drought-tolerant crops, grasses, and native plants, which may assist in maintaining agricultural production for food, feed, and cosmetics and sustain grasslands and rangelands i
Economic Impacts of Drought in Utah: Uintah and Ouray Reservation
The objective of this fact sheet is to illustrate the economic impacts of drought on agriculture and the economy of the Uintah and Ouray Reservation in Utah.
Impacts of Drought on Tribal Economies in Arizona
The objective of this fact sheet is to illustrate the economic impacts of drought on agriculture and reservation economies in Arizona. Arizona is the fourth driest state in the United States, with average yearly precipitation of 11.24 inches, and 78% of t
Impacts of Drought on Tribal Economies in Nevada
The objective of this fact sheet is to illustrate the economic impacts of drought on agriculture and reservation economies in Nevada. Nevada is the driest state in the United States, with an average yearly precipitation of 9.96 inches, and 71% of the stat
Impacts of Drought on Tribal Economies in New Mexico
This fact sheet will illustrate the potential economic impacts of drought on agriculture and reservation economies in New Mexico. New Mexico is the fifth driest state in the United States, with an average yearly precipitation of 13.38 inches, and 69% of t
Southwest Utah Turfgrass Management Calendar
Cool-season grasses, such as Kentucky bluegrass or the fescues, may be seeded any time from midspring to early fall, but late summer/early fall is the optimum seeding time in southeast Utah. The warmth of the soil in late summer is more advantageous for s