Manuals and Documents
Monitoring Guidelines Tier 1 Volunteer Manual Lake Datasheet Stream Datasheet
Methods
Why we monitor flow: The amount of water in the stream can influence other water quality parameters such as temperature, dissolved oxygen, and turbidity. Stream flow changes based on the amount of precipitation, weather, size of the watershed, and human water withdrawals. The minimum instream flow requirements are set by water management agencies to maintain enough water in a stream for fish or other aquatic wildlife populations.
| Flow | Description | Picture |
|---|---|---|
| No Flow | Water not moving, either no water or only water in isolated pools. |  |
| Low | Some flow but lower than normal baseflow. |  |
| Normal/Baseflow | Natural flow of the stream. |  |
| High/Runoff | At or near bank full due to recent precipitation or runoff. |  |
| Flood | Over bank full. Stream has exceeded normal baseflow banks. |  |
Why we monitor lake condition: Lakes do not have flow like streams do, but the water condition of the surface can influence the mixing of the water column below. Weather, especially winds, are the largest factor affecting lake surface conditions.
| Water Condition | Description | Picture |
|---|---|---|
| Calm | Water not moving. Surface of lake is glassy or smooth. |  |
| Ripples | Surface of lake affected by movement creating small waves, usually as a result of wind. |  |
| Waves | Surface of water is disturbed by movement creating swells or surface waves, usually as a result of wind or energy transfer. |  |
| White Caps | Waves with a white broken crest. |  |
Definition: The debris that are on the surface of the water.
Why we monitor the water surface: Volunteers record visual observations of what is on the surface of the water, which can be an indicator of pollution. While materials on the surface (like dust and pollen) can be natural, trash and oily materials can indicate improper disposal of human-made materials.
| Water Surface | Description | Picture |
|---|---|---|
| Clear | No material is on the surface of the stream or lake. Usually associated with healthy waters; however, clear waters may be polluted with colorless substances. |  |
| Scummy | A visible dirty film on the water surface. May result from floating algae or decaying plant material. |  |
| Foamy | Bubbles or foam. If foam is fairly thin, less than 6 inches high, and grayish, it may be the result of natural oils, soil particles and pollen. Heavy foam may be the result of detergents or animal waste runoff. |  |
| Natural Debris | Leaves, sticks, logs, or other natural objects breaking the surface of the water. |  |
| Trash | Plastic, garbage, yard waste, or other forms of trash littering the water surface. |  |
| Sheen/Oily | Surface has a multi-colored sheen or dark oil color and consistency. A light sheen may result from the natural breakdown of vegetation. A heavy sheen may indicate floating oil from dumping or run-off from sewers, roads, and parking areas. |  |
Definition: The amount of material suspended in the water column, related to turbidity or transparency.
Why we monitor water clarity: Sediment and algae can cover habitat for aquatic organisms and reduce light penetration. Activities in the watershed such as forestry, agriculture, development, erosion, fire, etc. can influence the water clarity. Changes in land use can result in short- or long-term changes to the water clarity. Natural seasonal changes like high runoff can temporarily shift water clarity as well.
Water appearance is often the most obvious water quality indicator that people notice. However, it is not a precise indicator of stream health and is best considered in combination with other data collected. The water clarity in lakes or streams can change with weather, water flow, and land use. When in the field, look into the water and record the best description. Note what surrounding factors may be causing any changes you observe.
| Clarity | Description | Picture |
|---|---|---|
| Clear | Water is transparent and you can see through it to the bottom. |  |
| Cloudy/Milky | Water has a whitish or chalky appearance. Water not completely opaque, still somewhat transparent. Milky water may be the result of natural sediments or indicated a dairy operation or paper manufacturing discharge. |  |
| Turbid | Water has a murky or muddy appearance. Cannot see through the water. |  |
Why we monitor water color: Volunteers monitor water color to track large scale changes in the watershed. If the waters of a clear lake changed to a muddy brown color, that could indicate a change in the watershed. The size of the watershed, slope, geology, natural events (fire, flooding, etc.), and land use all influence the water color. Waterbodies also have small changes in color throughout the year due to physical and biological seasonal shifts. When in the field, choose one of the following colors that best describes the water. Check NORMAL if it is the typical color when you come to monitor or ABNORMAL if this color is unusual for the waterbody.
| Color | Description | Picture |
|---|---|---|
| Clear | Usually associated with healthy waters. However, clear waters may be polluted with colorless substances. Very clear water without any living organisms indicates a pollution problem. |  |
| Brown | Often results from decaying organic matter in the stream or lots of sediment. Streams that drain wetlands may be stained a very dark brown. |  |
| Green | Slightly greenish water results from the presence of microscopic plants or algae, and usually indicates healthy conditions. Deep green, or pea soup color, often results from an overabundance of algae (phytoplankton). Heavy nutrient loads from fertilizers, animal waste, and poor sewage treatments often promote heavy amounts of algae. |  |
| Red | May result naturally from drainage through soils rich in iron and tannins. |  |
| Blue | Clear cool waters often have a blue color. Strong blue colors can result from glacial runoff. |  |
| Orange | May indicate runoff from mines or oil wells. May result naturally from drainage through soils rich in iron and tannins. |  |
Definition: Odors coming from the waterbody.
Why we monitor odor: The general smell of a water body can indicate potential contamination. Not all unpleasant odors indicate an unnatural cause. Local biologic processes like decomposition influence water’s odor. Bacteria have a strong influence on smell. Waste disposal or accidental spills can temporarily change the smell of the water and are sometimes cause for concern. Smell is a useful, but limited, tool that should be considered in combination with other indicators.
| Odor | Description |
|---|---|
| None | No strong or apparent odor associated with the water. |
| Oil | A strong chemical smell that could be the result of mishandled industrial waste or effluent. |
| Sewage | A foul smell that can indicate possible contamination of wastes from people or animals. |
| Rotten Egg | A sulfurous smell, which often indicates anaerobic (without oxygen) decomposition processes or some animal waste. Minerals delivered from sulfur springs also give off this smell. |
| Fishy | A strong smell that may indicate the presence of dead fish. |
| Musky | May indicate mold, raw sewage, animal waste, or heavy algal accumulation and decomposition. |
| Chlorine | Smells like a swimming pool. May result from heavy chlorination of treated sewage. |
Why we monitor algae cover: Extremely abundant algae cover can be the result of heavy nutrient loads from fertilizers, animal waste, and poor sewage treatment. Overabundance of algae often result in deep green or pea soup color.
When investigating algae cover, look upstream and downstream of the sampling location and record what category best describes the dominate condition of algae in the stream. See our HAB Squad page if you suspect a harmful algal bloom and need help identifying the type.
| Algae Cover | Description | Picture |
|---|---|---|
| Little/Rare | No visible signs of algae. |  |
| Substrate Layer | Algae that is attached to the stream bed and woody debris, often green-brown slimy coating. |  |
| Filamentous | Strands of long, green stringy or hair-like algae attached to substrate, rocks, or plants. |  |
Present Weather:
Choose the one category that best represents the weather while you sampled.
- Clear
- Cloudy
- Overcast
- Light Rain
- Heavy Rain
- Snow
Past 24 Hour Weather:
Choose the categories that best applies to the weather over the past 24 hours. Past weather will affect volume of flow, turbidity, temperature, and other factors in your stream. If a weather event was an unusual one, your results may be unusual too.
Inches of Rainfall:
Total rainfall in past 72 hours. We want a general description of how much it has rained in the past 3 days. Rain events can result in changes in water quality due to increased flows or run off from the associated watershed. You can look this up online for your location or the nearest weather station.

For a stream, you can monitor from the side or stream bank, or the center or an area of deeper, well-flowing water.
| Location | Description | Picture |
|---|---|---|
| Side | You are standing on the stream bank or in the adjacent shallows. All measurements take place outside of the main flow. |  |
| Center | You are standing in the flowing section of the stream. May not be the deepest part of the stream, but all measurements are taken in a well-flowing location. |  |
Why we monitor stream habitat: The relative proportions of these different habitats in a stream are one way to determine how healthy the stream is. The riffle/ run/ pool ratio is a measure of the kinds of habitat in the stream for fish, macroinvertebrates, and other aquatic life.
| Habitat | Description | Picture |
|---|---|---|
| Riffle | Water that moves over a shallow area of cobbles and gravel creates a riffle (a length of stream characterized by shallow, fast moving water broken by rocks). These well-oxygenated, fast moving waters provide habitat for macroinvertebrates and spawning fish. Higher densities of organisms live in riffles compared to pools. |  |
| Run | A run is a length of a stream that has moving water, some depth, and low turbulence. Runs are generally deeper than riffles. Runs are good areas for fish to feed and travel. |  |
| Pool | A pool is a deep area of fairly still water, which creates refuges for fish to hide in and to rest from the current. Pools provide unfrozen habitat for aquatic life during the winter and also act as natural pollution filters. Some pollutants, such as suspended solids, settle out of the water and down to the bottom of pools. |  |
For a lake you can monitor it at one of three locations, inshore (along the shoreline), from a dock or pier, or from a boat. It is best to monitor a lake where you have access to deep water for the Secchi Disk measurement.
| Location | Description | Picture |
|---|---|---|
| Inshore | You are standing on the shore or in the adjacent shallows. | 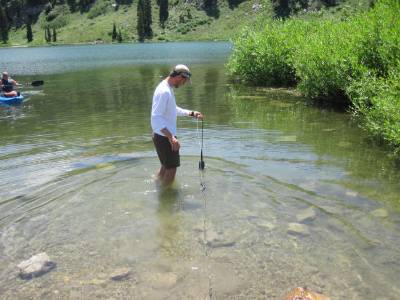 |
| Dock/Pier | You are standing on a dock or a pier. This will most likely not be the deepest part of the lake. | 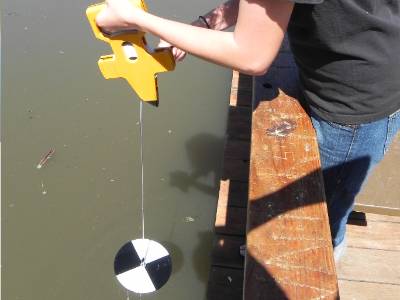 |
| Boat | You are in a boat out in the lake to take your measurements. | 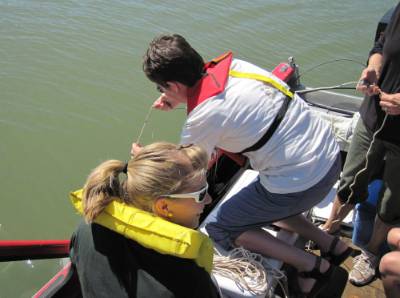 |
Photo point monitoring provides an easy and inexpensive way to monitor and track changes of a stream or lake. Photo point monitoring is utilized by many agencies, including the Division of Water Quality, to document changes in stream shape, riparian habitat or other land use improvements. Photos are taken on a regular basis (once a month, quarterly, yearly etc.) from the same position and field of view. Using site marking and good documentation, photos can be taken by multiple people and remain consistent. Photos may also be used to document efficacy of new management practices and locations should be strategically placed to capture the monitoring objective.
How to take photos:
Hold the camera at eye level. Try to include about 1/3 sky in the photo for scale and for consistent replication. Take the photos in early morning, late afternoon, or slightly overcast days to eliminate harsh glares or dark shadows. Avoid days when visibility is poor due to fog or heavy rain. Photos should include as much of the water body and its banks as possible. Print off copies of your first set of photos and keep them in your notebook. Use these as a reference when taking new photos, taking care to line them up as exactly as possible.
- For a stream: Take photos facing upstream and downstream from your site.
- For a lake, reservoir, or pond: Take photos facing left bank and right bank (if sampling from shore or dock), and straight out from your site (note what direction if you are on a boat).
- If your view of the waterbody is not clear from your monitoring location, find a nearby location that has a better view. Take notes on the location you took the photo and add to CitSci when you upload data.
- Upload your photo(s) to the CitSci database along with your site data.