You Can Lead a Horse to Water:
Mapping Seasonal Water Resources to Predict Wild Horse Movements on Utah Rangelands
Introduction
The lack of water defines deserts and exhibits tremendous year-to-year variation in the timing and amount of precipitation. Water distribution strongly influences animal movements and habitat use in these systems. Some herbivores, such as mule deer and pronghorn, can obtain water from succulent forage, but large grazers, including cattle and horses, need to drink water daily to help digest plant matter. As such, these species are typically found near water sources. In areas lacking perennial water, landowners and land management agencies can develop water sources to provide water for animals. However, temporary surface water that accumulates following snowmelt or rain remains the most widespread water source for wildlife and livestock, allowing these water-dependent species to range farther from developed or perennial sources than they might otherwise.
Seasonal movements of wild horses (Equus caballus) are determined by water availability (Schoenecker et al., 2022), which varies tremendously across the state and from year to year. In summer, herds with access to permanent springs or stock ponds may remain relatively sedentary, whereas those without these resources may become nomadic, searching for temporary water. Migrating horses traverse cattle grazing allotments, croplands, and highways, bringing them into conflict with other land uses.
All wild horse herd management areas in Utah overlap the Bureau of Land Management (BLM) grazing allotments. Although horses and cattle have similar dietary habits, both species rely heavily on predictable water sources during dry periods. The concentration of wildlife and livestock in mesic areas during droughts can become problematic for farmers and livestock producers. We aimed to map the annual distribution of temporary surface water across Utah that cattle, horses, and wildlife could use. Herein, we analyzed an 18-year record of satellite imagery to create a statewide map of seasonal surface-water availability for agricultural and wildlife management purposes.
Is this source of water essential to livestock and wildlife?
Whether natural or human-made, we typically focus on perennial water sources, such as creeks, springs, or guzzlers. However, previous research has demonstrated that free-ranging animals, wild or domestic, readily use temporary (seasonal) water sources, such as snowmelt and puddles left after rainstorms. These are particularly valuable to animals when they fill natural depressions and are available for extended periods (Holton, 2007). Field studies conducted in Utah and Arizona show that surface water availability is the strongest determinant of habitat use for horses and livestock (Miller, 1983; National Research Council [NRC], 2013; Schoenecker et al., 2022).
How much ground is covered by water following snowmelt?
Although seasonal surface water is too variable in space and time for traditional direct monitoring methods, it can be mapped using satellite imagery (Figure 1). Using imagery provided by NASA taken semi-monthly, we can estimate the amount of ground covered by water and its duration during the growing season. Table 1 lists how much of the ground is covered by water during the growing season (1 May through 31 October) and how long it lasts.
Table 1.
Statewide - Proportion of the Growing Season Where Water Covers the Ground (May 1 to October 31)
|
Water present (days) |
Proportion growing season |
No. allotments |
Total square mi 2 |
|
18 |
10% |
940 |
13,472 |
|
37 |
20% |
495 |
9,163 |
|
55 |
30% |
326 |
7,811 |
|
73 |
40% |
240 |
6,479 |
|
92 |
50% |
199 |
5,162 |
|
110 |
60% |
170 |
4,507 |
|
128 |
70% |
141 |
3,501 |
|
146 |
80% |
122 |
3,115 |
|
165 |
90% |
88 |
2,671 |
Notes. This does not include artificial sources, such as guzzlers, stock ponds, or leaking pipes. The number of allotments is determined by a 6-mile radius around each herd management area.
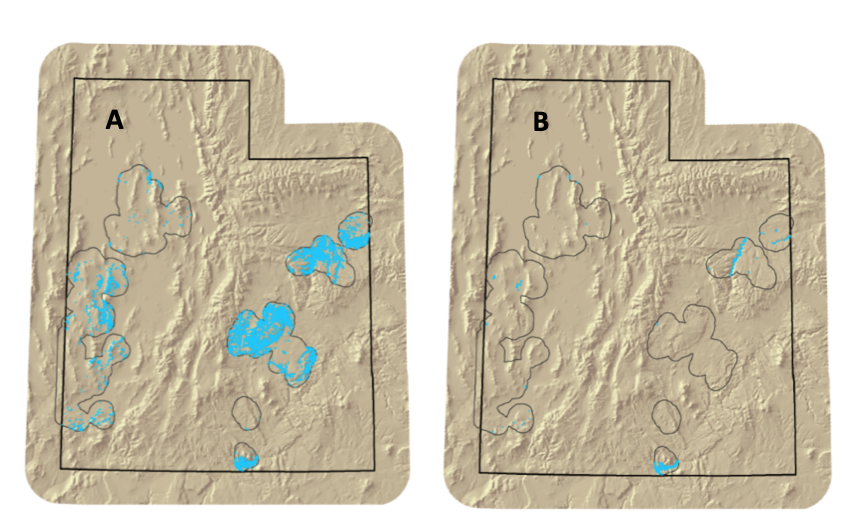
Figure 1. Seasonal Surface Water Across Utah Herd Management Areas
Note. Frames A and B represent the amount of land covered by water for 10% and 90%
of the growing season, respectively.
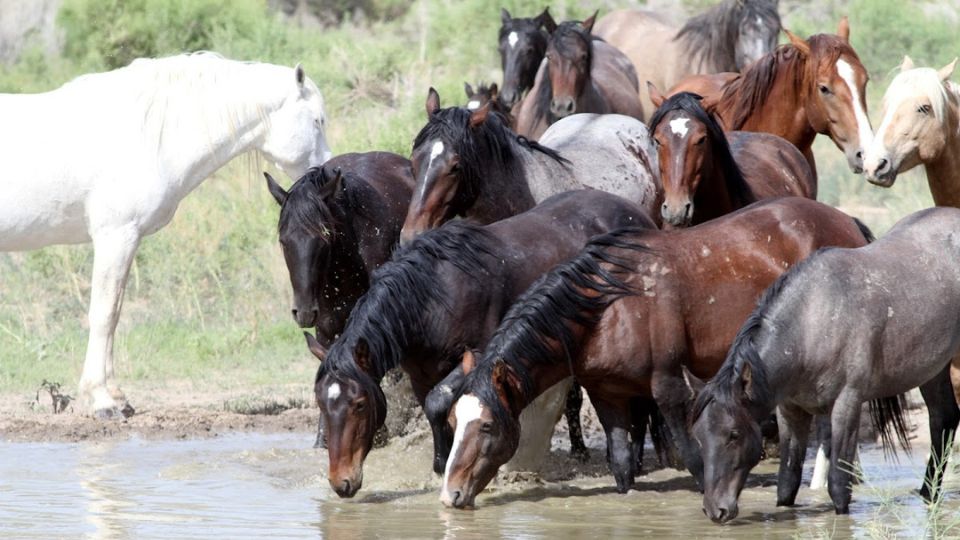
How far do horses travel for water?
Figure 2. Horses Often Water Daily and Can Travel Great Distances to Water Sources
Photo credit: USU Extension
The horse is an animal built for travel. Early accounts from U.S. Army survey parties mapping remote parts of Utah during the 1870s describe single-day rides of up to 40 miles (McPherson & Neel, 2016). Wild horses—unburdened by saddles, riders, and equipment—can easily cover this much ground when necessary. Accounts of Australian "brumbies" walking 10 miles (range: 5–17) within a single day have been reported from the driest parts of their range (Hampson et al., 2010). Closer to home, radio-telemetry studies in southern Wyoming have measured average daily travel distances of approximately 6 miles (Hennig et al., 2018) across summer home ranges of about 15 square miles. Importantly, during these wayfaring episodes, almost half of the location fixes occurred outside the herd management area (HMA), where the horses were originally caught, and 11% were on private land.
Numbering over 400,000 animals, Australia has more feral horses than any other country (Csurhes et al., 2009). Like the Western U.S., it is also largely arid. Substantial research on horse behavior, especially concerning water, has been conducted in Australia. In these herds, horses never went longer than 4 days without drinking, averaging about 2.5 days between visits to water holes (Figure 2). Rarely, horses were found up to 34 miles from the nearest water source. These extraordinary navigational abilities are a testament to both the species' tenacity and the role that surface water plays in the movement patterns and habitat use of these wild horses.
How many grazing allotments are potentially affected by horses?
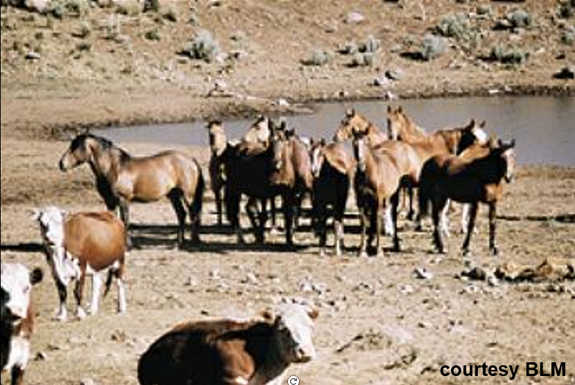
Figure 3. Horses and Cattle Interacting
at a Water Source
Within the state of Utah, there are approximately 9,709 grazing allotments, covering 57,566 square miles of federal or state rangelands (Bureau of Land Management [BLM], U.S. Forest Service [USFS], State Institutional Trust Lands Administration [SITLA]). Of these, 1,651 (17%) fall within 6 miles of an HMA, representing 27% of all grazing lands by area (Figure 4). This figure does not include allotments within 6 miles of the boundary of a BLM herd area (HA) or horses moving on and off tribal lands, military, or national park lands. So, this is an underestimate of the total number of allotments that may be affected by wild horses to some degree. Because of this, competition between wild horses and free-ranging livestock can potentially affect many Utah producers (Figure 3). In Figure 5, we illustrate how the dynamics of temporary surface water might influence horse movements and, therefore, the allotments vulnerable to intrusion by wild horses.
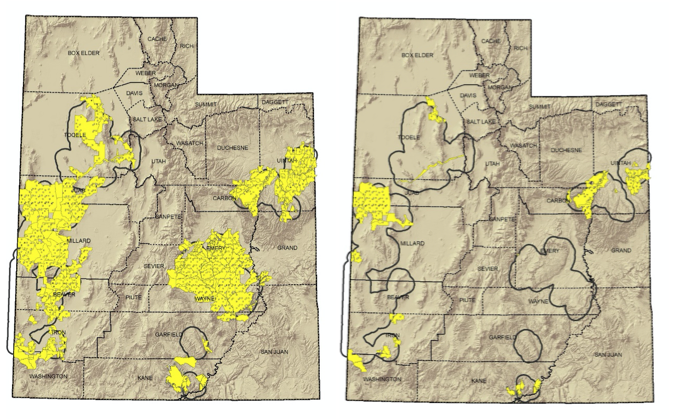
Figure 4. Grazing Allotments Within a 6-Mile Radius of Herd Management Areas
Note. Water is present for 10% and 90% of the growing season, mainly during spring snowmelt and following summer thunderstorms. These maps illustrate the grazing allotments that could be affected by wild horses
throughout the season.
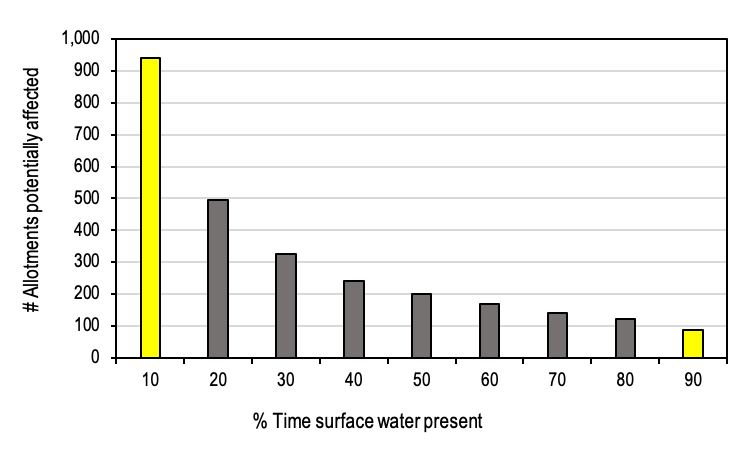
Figure 5. Percent Time Surface Water Is Present on Allotments Affected
by Wild Horses in Utah
Which agricultural/private lands are most vulnerable to crop depredation by wild horses?
For wild horses in Utah, water may be available from anthropogenic sources, such as irrigation canals, cattle tanks, or leaking pipes. In these cases, horses may be attracted to water and surrounding croplands, resulting in conflicts with landowners. In Table 2, we highlight the Utah counties where conflict between wild horses and agriculture on private lands is most likely to occur.
Table 2.
Statewide - Proportion of the Growing Season Where Water Covers the Ground (May 1 to October 31)
|
County |
No. |
% Total |
Area (mi2) |
|
Beaver |
44 |
15.5% |
19.7 |
|
Carbon |
14 |
4.9% |
4.6 |
|
Emery |
1 |
0.4% |
1.4 |
|
Iron |
48 |
16.9% |
36.3 |
|
Juab |
23 |
8.1% |
6.9 |
|
Millard |
9 |
3.2% |
3.7 |
|
Tooele |
119 |
31.9% |
102.7 |
|
Uintah |
26 |
9.2% |
51.4 |
Conclusions
Utah is the second driest state in the U.S., so livestock production takes more land than it would in wetter, more productive environments. As a result, forage and water resources can vary substantially from year to year, and when resources are sparse, competition between livestock and wild horses can occur. The maps presented here can be used to predict what time of year and which allotments are most susceptible to incursions from wild horses on Utah rangelands.
References
-
Bastian, C.T., Van Tassell, L. W., Cotton, A., & Smith, M. A. (1997, July 13–16). Opportunity costs of wild horses: An allotment case study in Wyoming [Conference presentation]. Annual Meeting of the Western Agricultural Economics Association, Reno, NV.
-
Beever, E. A., & Aldridge, C. L. (2011). Influences of free-roaming equids on sagebrush ecosystems, with a focus on greater sage-grouse. In S. T. Knick & J. W. Connelly (Eds.), Greater sage-grouse: Ecology and conservation of a landscape species and its habitats (pp. 273–290). University of California Press.
-
Beever, E. A., Tausch, R. J., & Thogmartin, W. E. (2008). Multi-scale responses of vegetation to removal of horse grazing from Great Basin (USA) mountain ranges. Plant Ecology, 196, 163–184.
https://doi.org/10.1007/s11258-007-9342-5 -
Csurhes, S., Paroz, G., & Markula, A. (2009). Invasive animal risk assessment – feral horses, Equus caballus. Department of Agriculture and Fisheries Biosecurity, Queensland Government, Australia.
-
Davies, K. W., Collins, G., & Boyd, C. S. (2014). Effects of feral free-roaming horses on semi-arid rangeland ecosystems: An example from the sagebrush steppe. Ecosphere, 5, 127. http://dx.doi.org/ 10.1890/ES14-00171.1.
-
Feng, M., Sexton, J. O., Channan, S., & Townshend, J. R. (2016). A global, high-resolution (30-m) inland water body dataset for 2000: First results of a topographic-spectral classification algorithm. International Journal of Digital Earth, 9, 113–133.
-
Girard, T. L., Bork, E. W., Nielsen, S. E., & Alexander, M. J. (2013). Seasonal variation in habitat selection by free-ranging feral horses within Alberta's forest reserve. Rangeland Ecology and Management, 66(4), 428–437. https://doi.org/10.2111/REM-D-12-00081.1
-
Gooch, A., Petersen, S., Collins, G., Smith, T., McMillan, B., & Eggett, D. (2017). The impact of feral horses on pronghorn behavior at water sources. Journal of Arid Environments, 138, 38–43.
-
Hall, L. K., Larsen, R. T., Westover, M. D., Day, C. C., Knight, R. N., & McMillan, B. R. (2016). Influence of exotic horses on the use of water by communities of native wildlife in a semi-arid environment. Journal of Arid Environments, 127, 100–105. https://doi.org/10.1016/j.jaridenv.2015.11.008
-
Hampson, B. A., De Laat, M. A., Mills, P. C., & Pollitt, C. C. (2010). Distances traveled by feral horses in 'outback' Australia. Equine Veterinary Journal, 42, 582–586.
-
Henning, J. D., Beck, J. L., & Scasta, J. D. (2018). Spatial ecology observations from feral horses equipped with global positioning systems transmitters. Human-Wildlife Interactions, 12(1), 75–84.
-
LaForge, M., Uzal, A., Medill, S. A., & McIoughlin, P. D. (2016). Scale-dependent effects of density and habitat on foal survival. Journal of Wildlife Management, 80, 347–354. https://doi.org/10.1002/jwmg.1015
-
McInnis, M. L., & Vavra, M. (1987). Dietary relationships among feral horses, cattle, and pronghorn in southeast Oregon. Journal of Range Management, 40, 60–66.
-
McPherson, R. S., & Neel S. R. (2016). Mapping the four corners: Narrating the Hayden survey of 1875. University of Oklahoma Press.
-
Menard, C., Duncan, P., Fleurance, G., Georges, J., & Lila, M. (2002). Comparative foraging and nutrition of horses and cattle in European wetlands. Journal of Applied Ecology, 39, 120–133.
-
Miller, R. (1983). Habitat use of feral horses and cattle in Wyoming's Red Desert. Journal of Range Management, 36, 195–199.
-
National Research Council (NRC). (2013). Using science to improve the BLM Wild Horse and Burro Program: A way forward. National Academies Press.
-
Ostermann-Kelm, S., Atwill, E. R., Rubin, E. S., Jorgensen, M. C., & Boyce, W. M. (2008). Interactions between feral horses and desert bighorn sheep at water. Journal of Mammalogy, 89, 459–466.
-
Page, M. A. (2008). UDOT wildlife and domestic animal accident toolkit. Utah Department of Transportation Environmental Services.
-
Porfirio, L. L., Lefroy, E. C., Mackey, B., & Hugh, S. (2017). Monitoring the impact of feral horses on vegetation condition using remotely sensed fPAR: A case study in Australia's alpine parks. Parks, 23(2), 27–37.
-
Schoenecker, K. A., Esmaeili, S., & King, S. R. B. (2022). Seasonal resource selection and movement ecology of free‐ranging horses in the western United States. Journal of Wildlife Management, e22341.
-
Zeigenfuss, L., Schoenecker, K. A., Ransom, J. I., Ignizio, D. A., & Mask, T. (2014). Influence of nonnative and native ungulate biomass and seasonal precipitation on vegetation production in a Great Basin ecosystem. Western North American Naturalist, 74(3), 286–298. https://www.jstor.org/stable/24644405
Published December 2023
Utah State University Extension
Peer-reviewed fact sheet
Authors
David Stoner, Research Assistant Professor, USU Department of Wildland Resources
Eric Thacker, Range Professor, USU Extension and Department of Wildland Resources
Linden Greenhalgh, Associate Professor, USU Extension - Tooele County
Mark Nelson, Professor, USU Extension - Beaver County