Biochar Impacts on Crop Yield and Soil Water Availability
What is biochar and how is it made?
Biochar is a charcoal product formed from heating a high carbon material in an environment with limited oxygen. By heating in this type of environment, much of the carbon biomass is retained. This process is referred to as pyrolysis. The materials that are converted to biochar differ around the world, usually depending on what low value, high carbon material is in abundance. Forest deadfall and waste wood from industry are abundant and will eventually require disposal. Biochar production and field application could be a potential way to utilize excess wood to restore soil carbon on cropland (McCollum, 2011).
What are the potential benefits of biochar in Utah agriculture?
The potential to convert waste materials into a soil amendment and other valuable products has earned biochar considerable interest. Biochar has also been recognized as a soil amendment with potential to absorb and hold water, nutrients, hazardous and toxic elements, as well as increase soil carbon storage (Karhua et al., 2011; Uzoma et al., 2011). In agricultural settings, possible soil water retention or crop production enhancements could lead to increased value and potential use of wood biochar as a soil amendment (Fig. 1).
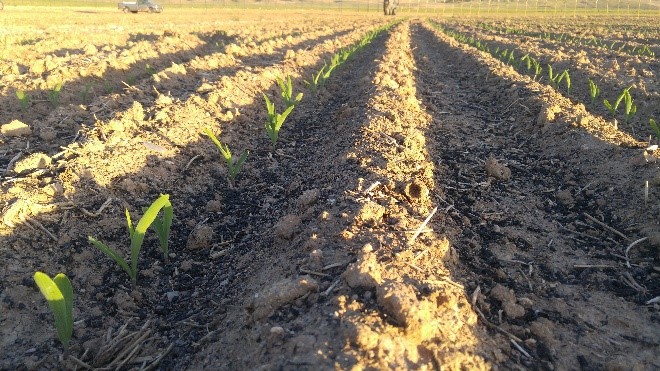
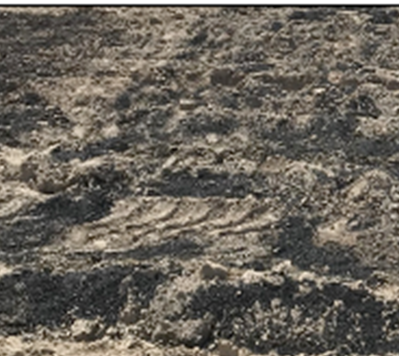
Figure 1. Wood biochar at 10 tons/acre topdressed and incorporated with minimum tillage on a corn field in Utah in 2018.
What are the recommended rates and costs of application?
Biochar is commonly recommended at no more than 10 tons per acre in field crop production (Bista et al., 2019). Wood biochar costs are approximately $350 per ton. Application costs can be about $8 per ton (Sorensen & Lamb, 2018). Therefore, the recommended maximum biochar rate of 10 tons per acre costs about $3,580 per acre. This is generally a one-time cost as a single application lasts for many years. Supplemental nitrogen (N) may also be required, adding an additional cost component. Potential yield losses could further increase the costs associated with biochar use.
How does biochar influence field crop production?
Crop yield is one of the strongest driving forces behind decisions made on the farm—including the purchasing of soil amendments. The impact of biochar on crop yields will greatly influence the ability of growers to finance and apply biochar amendments. Many studies have suggested biochar may be ineffective in improving crop yields (Aller et al., 2019; Novak et al., 2019) and may even lead to yield decreases. However, little research has been conducted on the effect of biochar on alfalfa, which is cultivated on more acres than any other crop in the western United States. Further, many studies have been conducted for corn and wheat, but most are not in the arid conditions of the western United States. We conducted a variety of studies at four fields (Table 1) during 2018–2020 to determine the impact of wood biochar on both yield and quality in these crops, and its impact on plant available water. At one field near Cornish, we also examined the influence of raw wood chips in addition to biochar to determine whether non-pyrolyzed wood would have the same effect as biochar (Table 2). In all trials, biochar was not primed with additional fertilizer. Fertilizer applications followed cooperating growers’ practices without consideration of the biochar.
Table 1 - Site and Soil Characteristics for Four On-Farm Biochar Trials in Utah, 2018 to 2020
| Nearest Town | Crop |
Irrigation |
Soil Texture |
Biochar Rates (tons/acre) |
Soil P (ppm) |
Soil K (ppm) |
Soil OMa (%) |
Soil pH |
| Cedar City | Alfalfa | Full, Partial | Loam | 0,10 | 8 | 56 | 1.4 | 7.3 |
| Cornish | Wheat | Full | Loamy fine sand | 0,1,2.5,5,10,15,30,W10b | 24 | 129 | 1.6 | 7.1 |
| Elberta | Corn | Full, Partial | Silt loam | 1,10 | 56 | 1110 | 2.5 | 7.5 |
| Mosida | Corn | Full | Silt loam | 0, 1, 2.5, 5 10,15 | 23 | 1483 | 1.8 | 7.8 |
|
a OM, organic matter. |
||||||||||||||||||||||||||||||||||||||||||||||||||||||
|
bW10 = 10 ton/ac of wood chips. Table 2 - Biochar and Woodchip Characteristics for Four On-Farm Biochar Trials in Utah, 2018 to 2020
|
Corn
Two biochar studies were conducted for silage corn during 2018–2020 near Elberta and Mosida, Utah. The first study in Elberta examined how a 10 ton per acre biochar rate influenced corn production under full and partial irrigation. In this study, biochar was topdressed applied to eight plots before tillage and corn planting in 2018. Another eight adjacent plots had no biochar applied. Corn was planted in the same plots in 2019 and yield was measured in all plots in both years. The field containing silt loam soil had a robust manure application history and was fertilized by the cooperating grower at industry recommended rates.
Silage corn yield responded to biochar in the full irrigation treatment but not the partial irrigation treatment where water was more limited (Table 3). In the dry year of 2018 with full irrigation, biochar applied at 10 tons per acre increased silage corn yield from 26.6 tons per acre to 29.8 tons per acre, an 11% increase. However, the opposite occurred the following year where biochar decreased yield from 25.5 to 23.1 tons per acre, or a loss of about 10%. Late planting due to a wet spring in 2019 could be a reason for the yield difference between years.
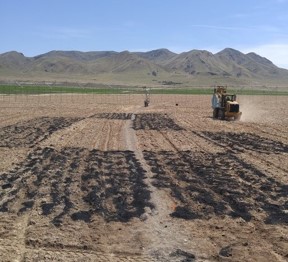
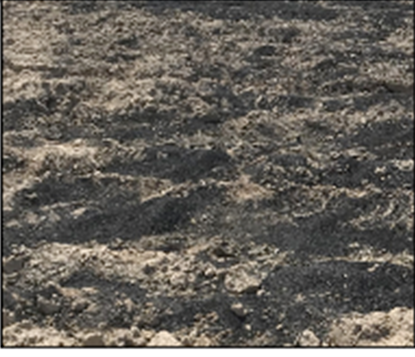
Figure 2. Biochar application at 10 tons/acre in Elberta, Utah in 2018.
Table 3 - Crop Yield With and Without Biochar at 10 Tons/Acre
|
Nearest town |
Crop |
Irrigation rates |
Year |
Yielda |
|
|
With biochar |
Without biochar |
||||
|
Cedar City |
Alfalfa |
Full |
2018 |
4.2 a |
4.0 a |
|
|
|
|
2019 |
6.2 a |
6.4 a |
|
|
|
|
2020 |
5.3 a |
4.9 a |
|
|
|
Partial |
2018 |
3.4 a |
3.6 a |
|
|
|
|
2019 |
5.1 a |
5.2 a |
|
|
|
|
2020 |
3.6 a |
3.8 a |
|
Cornish |
Wheat |
Full |
2019 |
137 a |
140 a |
|
2020 |
122 a |
129 a |
|||
|
Elberta |
Corn |
Full |
2018 |
29.8 a |
26.6 b |
|
|
|
|
2019 |
23.1 b |
25.5 a |
|
|
|
Partial |
2018 |
23.2 a |
26.9 a |
|
|
|
|
2019 |
22.2 a |
22.5 a |
|
Mosida |
Corn |
Full |
2018 |
18.4 a |
21.6 a |
|
2019 |
18.4 a |
20.3 a |
|||
|
|
|
|
2020 |
16.6 a |
18.2 a |
|
a Alfalfa yield is reported as tons dry matter/acre. Silage corn yield is tons/acre adjusted to 65.5% moisture, and wheat yield is bu/acre adjusted to 13.5% moisture. Within each site, irrigation rate, and year, yields followed by the same lowercase letter were not statistically different. |
Most silage corn quality parameters were influenced by the main effect of biochar in the full irrigation treatment. Across both years, biochar raised neutral detergent fiber (NDF) and decreased digestibility of NDF (NDFD), starch, and total digestible nutrients (TDN). Of all silage corn parameters measured, yield, starch, and TDN are generally of most concern to growers. There was nothing conclusive on the impact of biochar on yield from this site, other than biochar provided no consistent yield enhancements or reductions and provided no enhancements in a water-stressed environment. However, biochar did cause consistent reductions in silage corn forage quality.
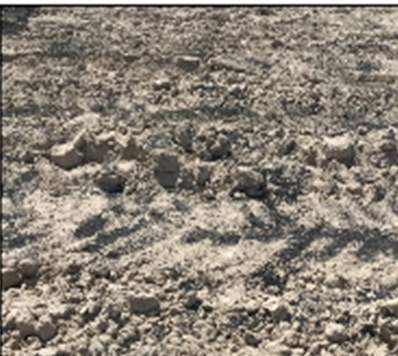
At the second study in Mosida, biochar was also topdressed and later incorporated by the grower’s tillage practices. In this study, biochar was applied at 0, 1, 2.5, 5, 10, and 15 ton per acre rates to examine the effect of biochar rate on corn production (Figure 3). These rates were replicated four times, and the soil at this site was also silt loam.
 0 tons/acre |
 1 ton/acre |
 2.5 tons/acre |
 5 tons/acre |
 10 tons/acre |
 15 tons/acre |
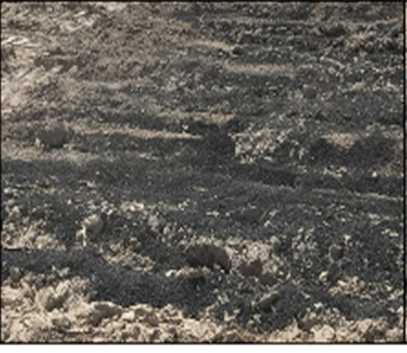
Figure 3. Biochar applied at various tons/acre in Mosida, Utah.
Corn silage yield was not influenced by the biochar rates at this site. Corn silage yield (at 65% moisture) was 19.8, 18.2, and 15.8 tons per acre in 2018, 2019, and 2020, respectively (Table 3). The declining yields may be largely due to the weather, as 2019 had late planting due to a wet spring, and 2020 harvest was early due to early September frost events. These yields were also lower than neighboring fields because this field was first brought into production from rangeland in 2017. All silage corn quality parameters changed from 2018 to 2019 but were not influenced by biochar. As with other corn studies (Aller et al., 2018; Novak et al., 2019), we found wood biochar to have no impact on corn production in the first two years after application.
Alfalfa
A biochar trial was conducted in Cedar City between 2018 and 2019. This trial was designed the same as the Elberta trial with 16 plots that included four plots of biochar and no biochar in two irrigation treatments on loamy soils. Biochar was topdressed applied directly after the first cutting of alfalfa (3-year-old stand) in 2018 and was not incorporated because it was applied to established alfalfa (Figure 4). Alfalfa yield was measured in 2018–2020 and quality in 2018–2019. Soil fertility was managed by the cooperating grower at industry recommended rates.
Biochar had no influence on alfalfa yield in 2018–2020. Biochar did cause a decrease in relative feed quality (RFQ), but values remained within the range requirements to be rated in the highest category as supreme alfalfa (USDA, 2020). These RFQ reductions due to biochar could occur during raking when some biochar was lifted from the soil surface and into the alfalfa windrow.
Within each irrigation treatment, there were no yield differences with biochar, signifying that biochar may not help mitigate crop stress in water-limited scenarios. These results support what we observed in the other test crops: Biochar has few short-term impacts on crop yield.
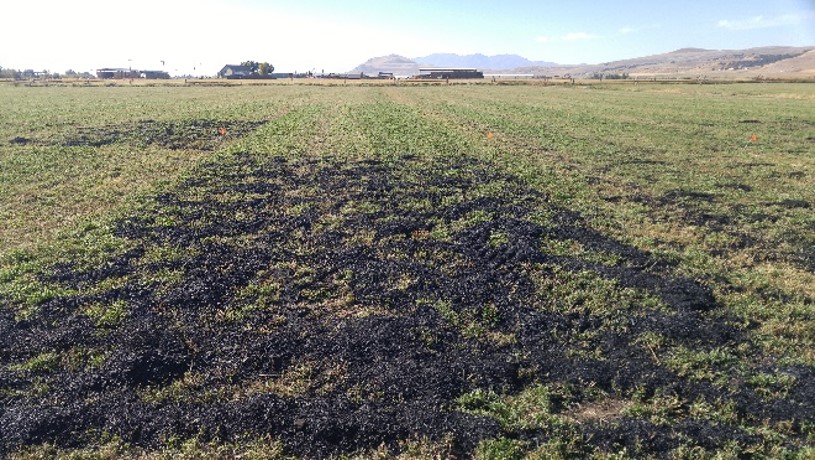
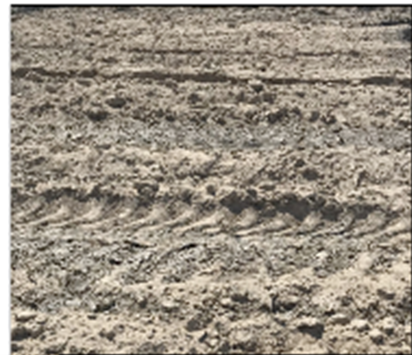
Figure 4. Biochar topdressed on alfalfa just before termination with tillage and subsequent winter wheat planting in Cornish, Utah in fall 2018.
Wheat
Trials were conducted on a wheat field near Cornish, Utah with a loamy fine sand soil. As with the trials at Mosida, an untreated control was evaluated along with plots treated with biochar at rates of 1, 2.5, 5, 10, and 15 tons per acre. Additional treatments included a 30 ton per acre biochar rate and a 10 ton per acre treatment of wood chips.
Biochar rate had minimal impacts on wheat protein and test weights, but biochar did influence wheat yield. Averaged across 2019 and 2020, biochar slightly decreased wheat grain yield by 5 bushels per acre at the 10 ton per acre rate of biochar. The slight yield decrease from biochar was likely due to nitrogen (N) shortages. This field was first-year wheat following alfalfa, so we expected the N credit would be sufficient and did not apply N fertilizer. However, a separate trial with fertilizer rate treatments in the same field displayed a response to additional N, signifying a shortage of available N for maximum yield. The biochar may have exacerbated the N shortage and increased competition with the plants for N, as seen in other studies (Nguyen et al., 2017).
Raw wood chips reduced yield by 19 and 35 bushels per acre (16 and 33%) in 2019 and 2020, compared to the same rate applied as biochar. This additional loss indicates that wood chips may greatly reduce yield and are not a viable alternative to wood biochar. The 5.8 pH of the wood chips may have caused the reduced yields, as more acid-tolerant ryegrass was prevalent in these plots. The reduction in yield could have also been influenced by carbon and nitrogen dynamics of the woodchips compared to biochar (Table 2).
Can biochar help optimize water use?
Soil water tension (measured as kilopascal units, or kPa) was estimated using Watermark™ soil moisture sensors at the one-foot depth in all four trials to determine whether biochar improved water availability in the topsoil. Higher water tension values indicate less available water and low water tension equals more available water.
Corn
Soil water tension (measured as kilopascal units, or kPa) was estimated using Watermark™ soil moisture sensors at the one-foot depth in all four trials to determine whether biochar improved water availability in the topsoil. Higher water tension values indicate less available water and low water tension equals more available water.
In 2018 and 2019 at Mosida, similar available water trends occurred among treatments (Figure 6). The 0, 5, and 15 tons per acre biochar rates began the season with equivalent levels, but in early to mid-July, the available water levels separated, and water availability increased for the increasing levels of biochar. However, the enhanced available soil water had no measurable benefit to corn yield or quality.
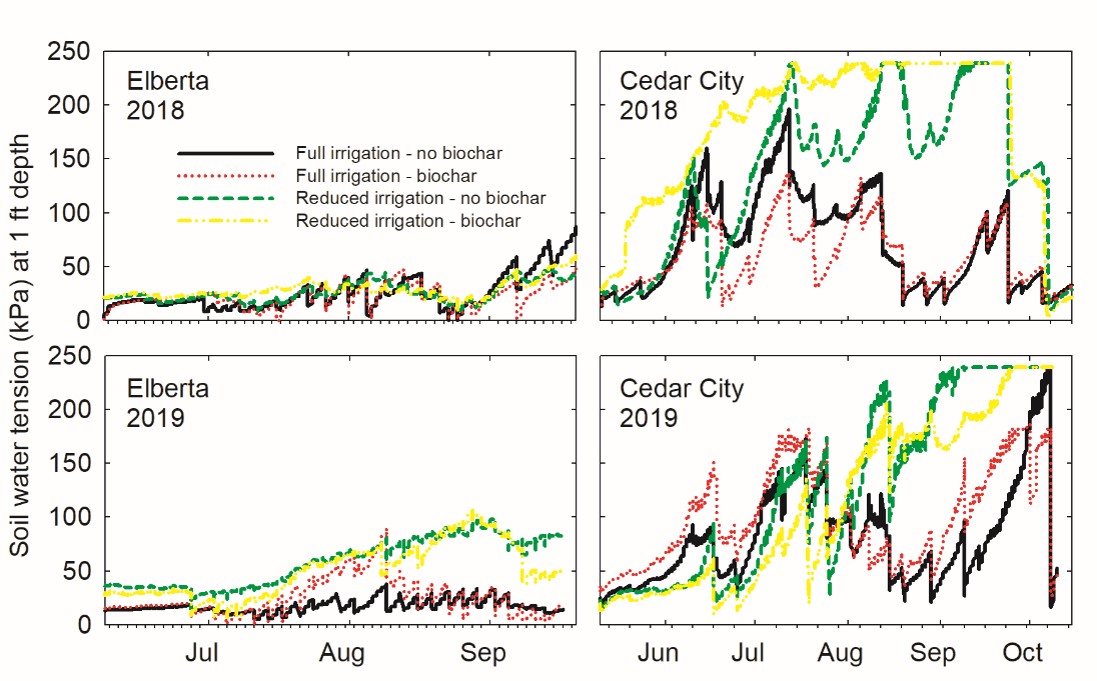
Figure 5. Soil water tension in the Elberta and Cedar City biochar trials.
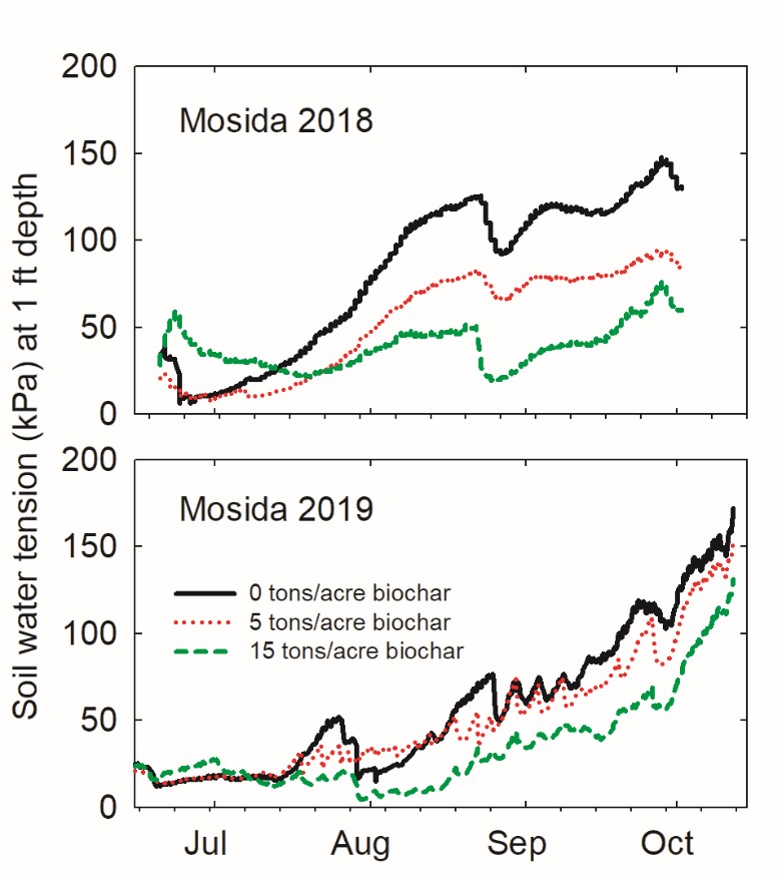
Figure 6. Soil water tension at the Mosida biochar trial.
Alfalfa
In 2018, when the biochar was topdressed onto the field, the partial irrigation treatment often had less available water with biochar, but biochar had few impacts on water availability with full irrigation (Figure 5). The 2019 results showed the partial irrigation rate had more available water with biochar, while biochar decreased available water in the full irrigation treatment. These results were like those at the Elberta site, where during the wet year of 2019, plots with biochar in the full irrigation treatment had less plant available water than plots without biochar. There were not significant yield differences that would suggest that the crop was using more water. Soil water tension observations from these trials lack consistent patterns to confidently suggest that biochar would benefit or harm plant available water levels in the soil.
Wheat
During the 2019 growing season in Cornish, available water was not impacted by biochar. One interesting observation was how the 10 and 30 ton per acre treatments began the season with the same or slightly more available water than the other biochar treatments. However, in mid-July this switched, and they became the treatments with less available water—especially the 10 ton per acre treatment, which ended the season 15 to 20 kPa higher than the other treatments. It was not clear why this occurred because yield (water demand) decreased as more biochar was applied, so there should have been more available water in these treatments.
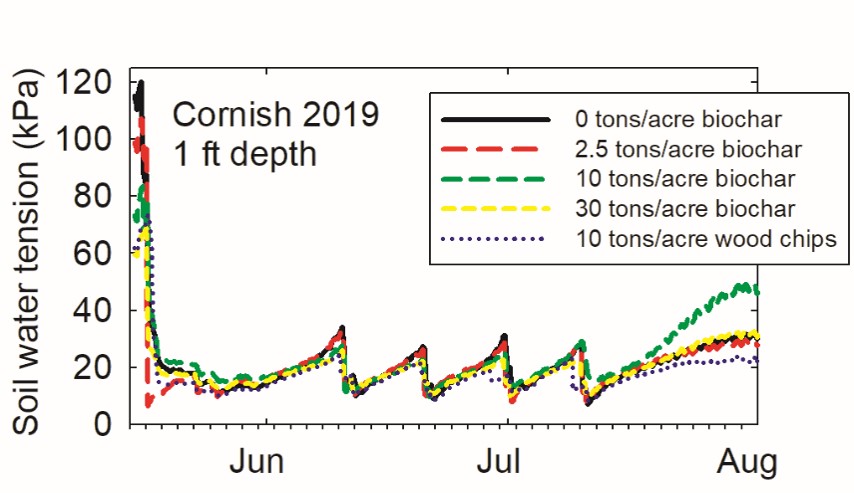
Figure 7. Soil water tension at the Cornish biochar trial.
Summary
Our results on four fields over two to three years showed no consistent benefit of biochar to yield, crop quality, or available soil water. Therefore, biochar may not be a feasible tool for conserving water or boosting short-term (2–3 years) production in the major field crops (alfalfa, silage corn, and wheat) of Utah and the greater Western United States. Similar results have been found in neighboring states and in the Midwestern U.S., where biochar treatments have had no impact on yield (Foster et al., 2016; Aller et al., 2018). The lack of short-term benefits to crop production or water conservation, coupled with the high cost of producing, purchasing, and applying biochar, indicates that wood biochar is not an economically feasible option for growers without financial incentives or assistance or massive price reductions. Potential long-term impacts of biochar to soil health enhancement may alleviate these constraints and warrants further investigation in the Western United States where abundant wood feedstocks are available.
Acknowledgements
This research was supported by the Utah Agricultural Experiment Station and the Utah State University Water Initiative. The authors greatly appreciate the support of the cooperating farmers and Extension faculty.
References
- Aller, D. M., Archontoulis, S. V, Zhang, W., Sawadgo, W., Laird, D. A., & Moore, K. (2018). Long term biochar effects on corn yield, soil quality and profitability in the US Midwest. Field Crops Research, 227(1), 30–40. https://doi.org/10.1016/j.fcr.2018.07.012
- Aston, S., Street-Perrott, A., & Doerr, S. (2014). Factors influencing biochar hydrophobicity and the influence of biochar content on the hydrological and erosional response of a silt loam under simulated rainfall. Geophysical Research Abstracts, 16.
- Bista, P., Ghimire, R., Machado, S., & Pritchett, L. (2019). Biochar effects on soil properties and wheat biomass vary with fertility management. Agronomy, 9(10), 623. https://doi.org/10.3390/agronomy9100623
- Foster, E. J., Hansen, N., Wallenstein, M., & Cotrufo, M. F. (2019). Biochar and manure amendments impact soil nutrients and microbial enzymatic activities in a semi-arid irrigated maize cropping system. Agriculture, Ecosystems & Environment, 233, 404–414. https://doi.org/10.1016/j.agee.2016.09.029.
- Karhu, K., Mattila, T., Bergström, I., & Regina, K. (2011). Biochar addition to agricultural soil increased CH4 uptake and water holding capacity - Results from a short-term pilot field study. Agriculture, Ecosystems and Environment, 140(1–2), 309–313. https://doi.org/10.1016/j.agee.2010.12.005.
- McCollum, D. W. (2011). Producing biochar from forest biomass. United States Forest Service, United States Department of Agriculture. https://www.fs.fed.us/research/highlights/highlights_display.php?in_high_id=385.
- Novak, J. M., Sigua, G. C., Ducey, T. F., Watts, D. W., & Stone, K. C. (2019). Designer biochars impact on corn grain yields, biomass production, and fertility properties of a highly-weathered ultisol. Environments, 6(6), 64. https://doi.org/10.3390/environments6060064.
- Nguyen, T. T. N., Xu, C. Y., Tahmasbian, I., Che, R., Xu, Z., Zhou, X., Wallace, H. M., & Bai, S. H. (2017). Effects of biochar on soil available inorganic nitrogen: A review and meta-analysis. Geoderma, 288, 79–96. https://doi.org/10.1016/j.geoderma.2016.11.004.
- Sorensen, R. B., & Lamb, M. C. (2018). Return on investment from biochar application. Crop, Forage & Turfgrass Management, 4(1), 1–6. https://doi.org/10.2134/cftm2018.02.0008.
- Uzoma, K. C., Inoue, M., Andry, H., Fujimaki, H., Zahoor, A., & Nishihara, E. (2011). Effect of cow manure biochar on maize productivity under sandy soil condition. Soil Use & Management, 27(2), 205–212. https://doi.org/10.1111/j.1475-2743.2011.00340.x.
April 2021
Utah State University
Peer-reviewed fact sheet
Suggested citation:
Yost, M., Holt, J., Austin, J., Creech, E., McAvoy, D., Winward, D., & Allen, N. (2021, April). Biochar impacts on crop yield and soil water availability [Fact sheet]. Utah State University Extension. https://extension.usu.edu/crops/biochar-factsheet
Authors
Jonathan Holt, Matt Yost, Earl Creech, Darren McAvoy, Niel Allen, Jeff Austin, and Dean Winward


Matt Yost
Agroclimate Specialist
PSC Dept


Darren McAvoy
Forestry and Wildland Resources Specialist
Wildland Resources Dept

Niel Allen
Former Irrigation Specialist