Recent Climate Change in Utah, 1870–2023

Climate change is impacting Utah. Forty-five years of temperature data show that Utah is steadily warming which, in turn, is driving declines in winter snowpack, shifting the timing and amount of available water, increasing fire risk, and causing ecological change. This link between warming and natural resources stems from the fundamental connection in mountain regions between temperature, precipitation, and water supply. In winter, Utah receives a considerable amount of precipitation, which primarily falls as snow. Snowpack seasonally accumulates at higher elevations, then melts in spring and summer. By acting as a natural water reservoir that is seasonally replenished, snowpack buffers the landscape against dry conditions. Snow cover also acts as a large-scale control on plant growth and animal movement, influencing local ecology. Thus, current and projected shifts in Utah’s temperature and precipitation regimes due to climate change will continue to impact its water supply, wildfire risk, and ecosystems.
Temperature
Ambient temperatures strongly influence many aspects of modern life, natural resources, and ecosystems. In a dry state like Utah, annual and seasonal temperatures are closely tied to water demand and availability. Warmer summers increase demand for water. Warmer winters cause more precipitation to fall as rain instead of snow, resulting in a shallower snowpack that contains less water and melts out earlier. Together, warmer summers and winters exacerbate water supply issues, particularly in late summer when water is most needed. Over the past four decades, the annual mean temperature in Utah has increased by around 0.4 °F per decade (Figure 1). This trend is driven by rising summer temperatures and is projected to continue; winter temperatures are also projected to increase (Hegewisch & Abatzoglou, n.d.-a, n.d.-b).

Source: Hegewisch & Abatzoglou, n.d.-a., CC BY 4.0
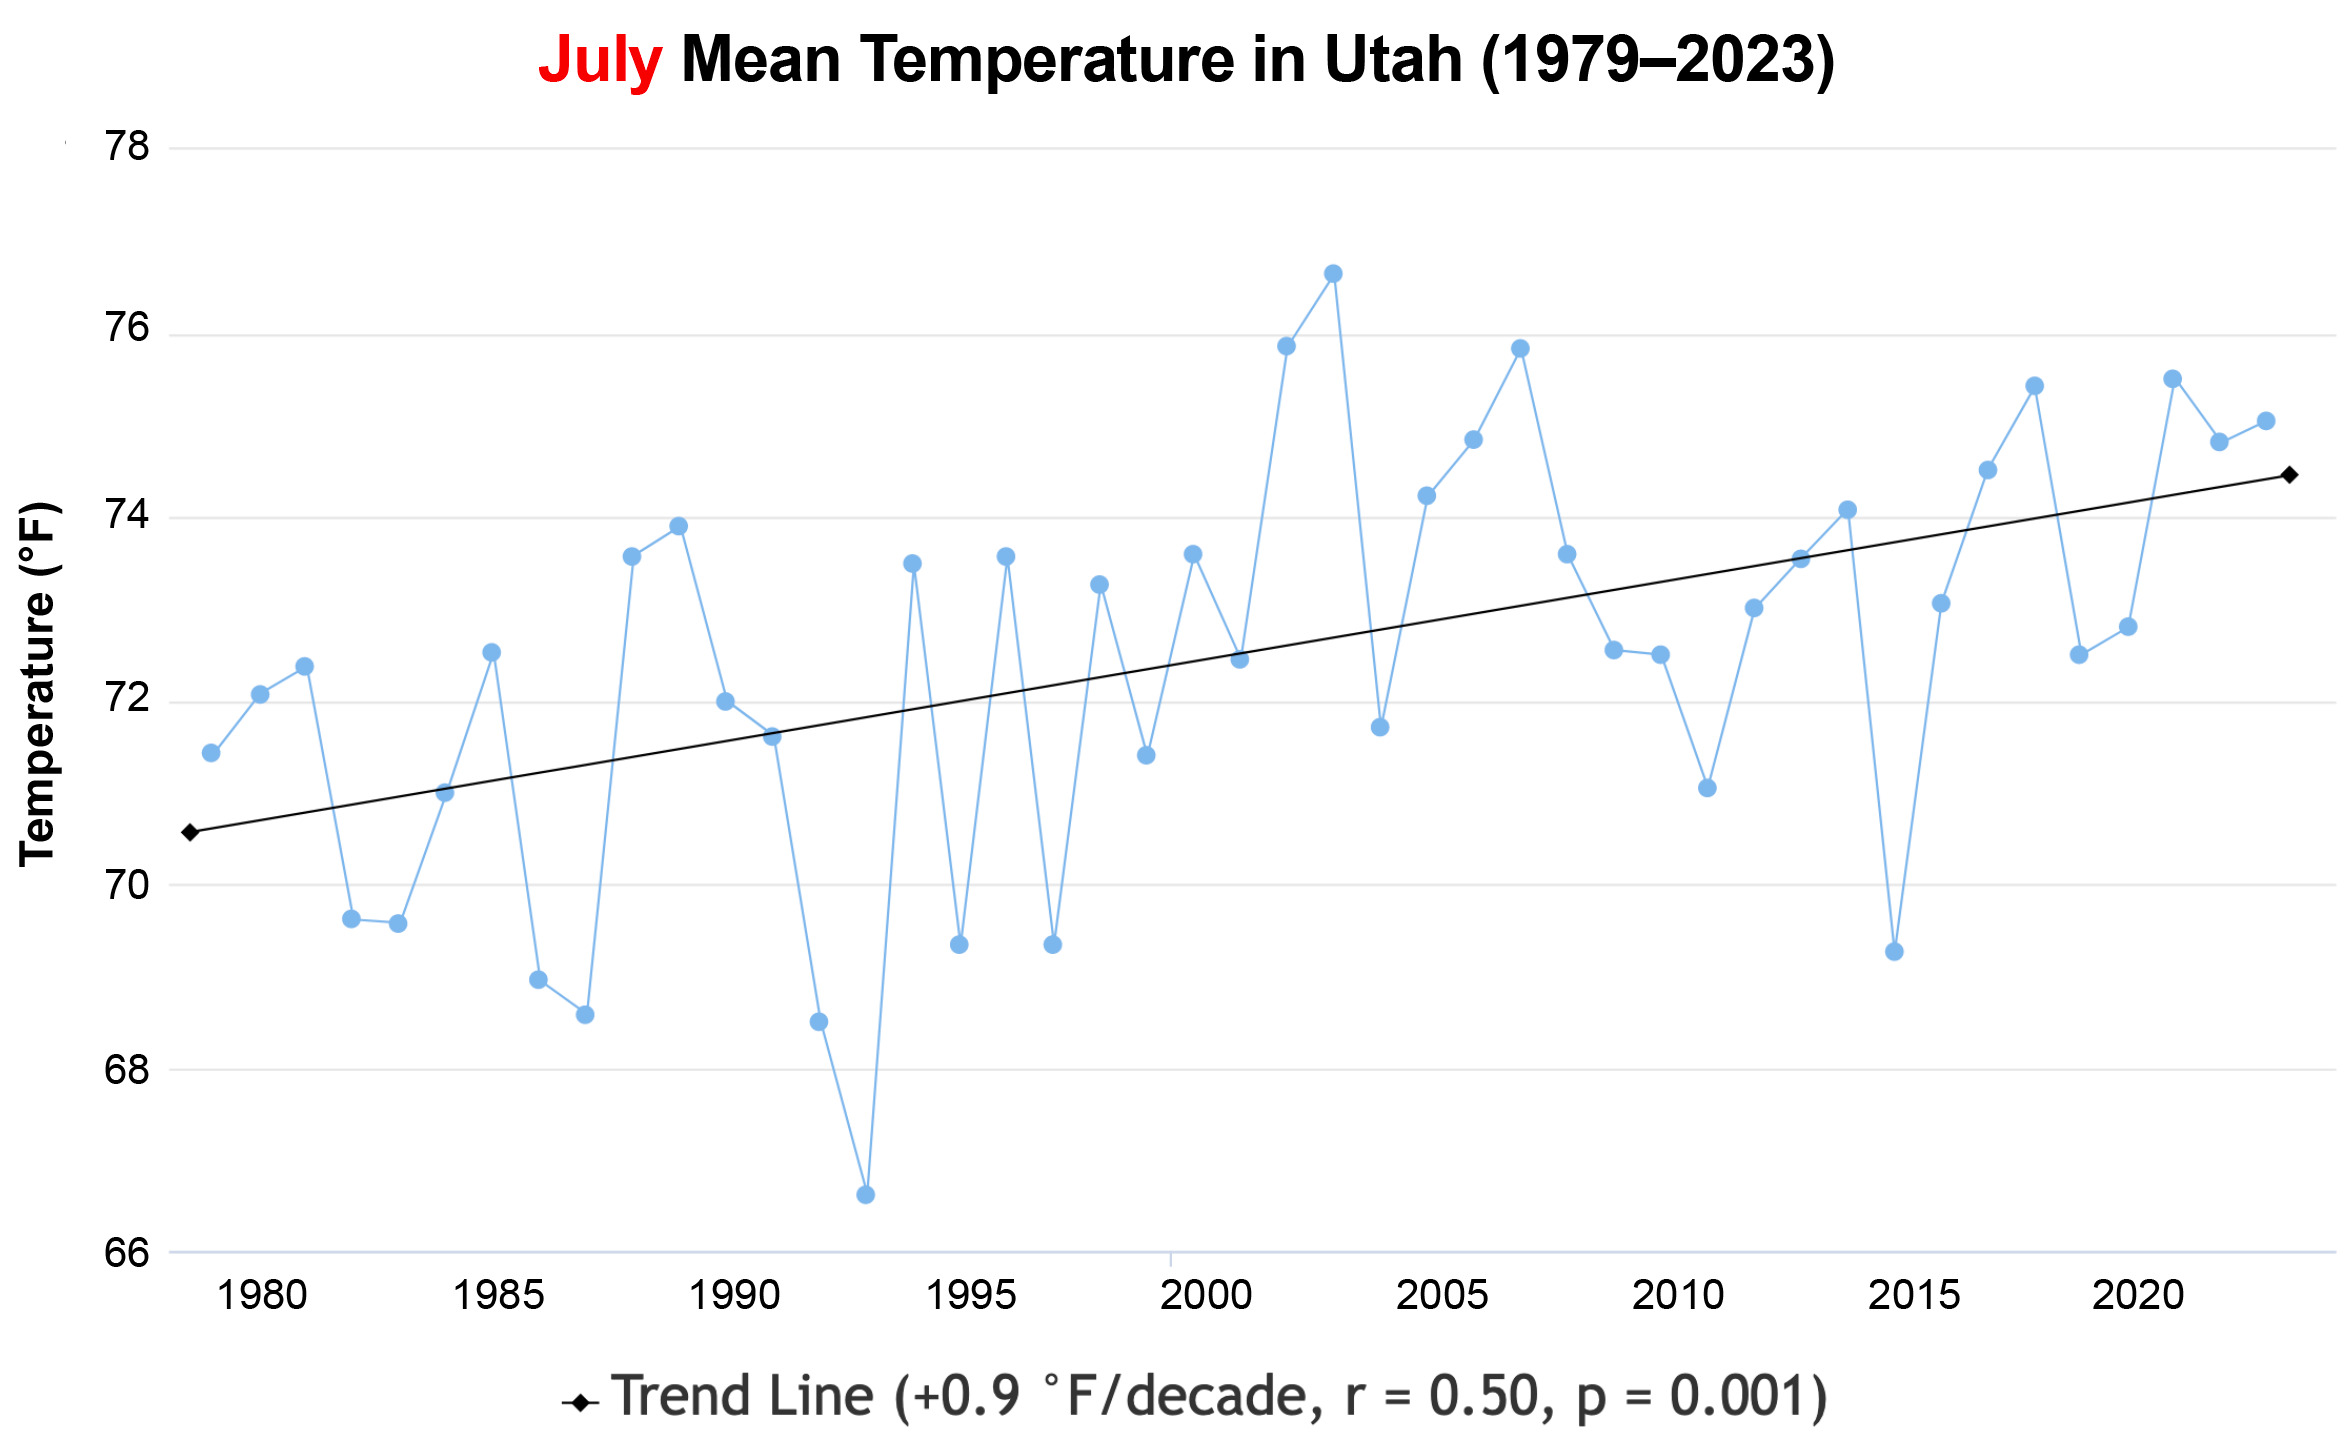
Summer temperatures - In Utah, July temperatures are rising faster than any other month, increasing by nearly 1 °F per decade since 1979 (Figure 2). This warming parallels global patterns of increasing temperatures caused by anthropogenic greenhouse gas emissions, particularly carbon dioxide (Crowley, 2000). Because future greenhouse gas emissions depend on policies and actions, scientists consider a range of future greenhouse gas concentration scenarios to predict future climates. Two common scenarios are RCP 4.5 and RCP 8.5, where RCP 4.5 is a “lower emissions” scenario based on a future where the concentration of greenhouse gases in the atmosphere stabilizes before 2100. RCP 8.5 is a “higher emissions” scenario where greenhouse gas concentrations continually increase. Looking ahead to 2100, under RCP 4.5 and RCP 8.5, summer temperatures in Utah are expected to rise by 3.4 °F and 9.0 °F, respectively (Figure 3).
Source: Hegewisch & Abatzoglou, n.d.-a., CC BY 4.0
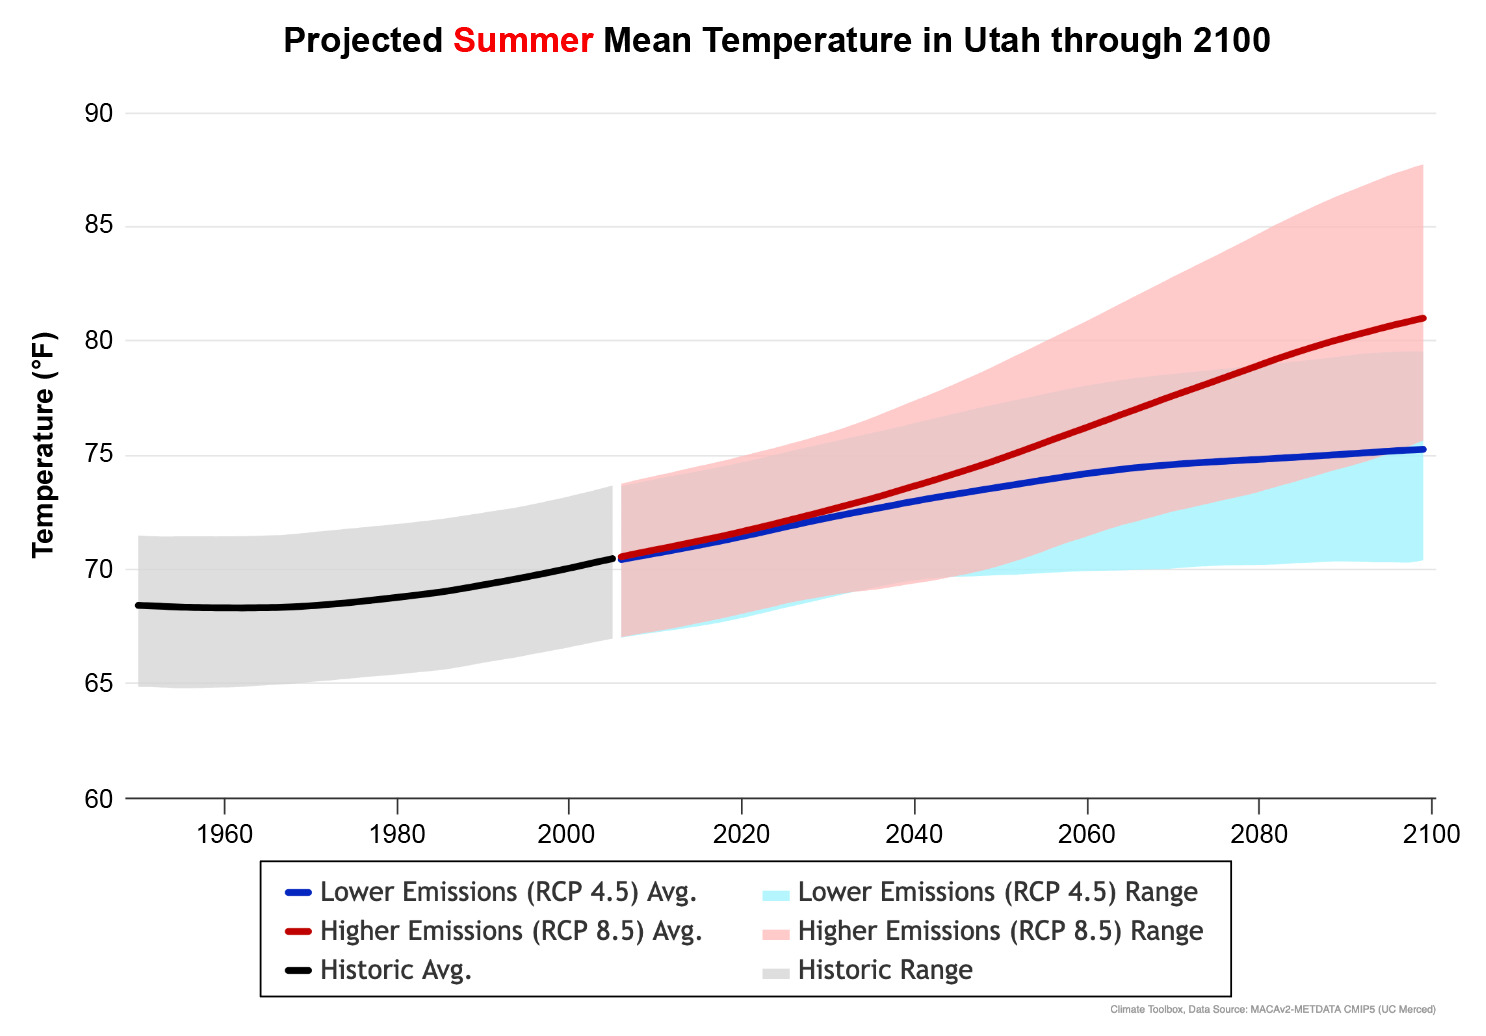
(RCP 4.5) and “Higher” (RCP 8.5) Emissions Scenarios
Note. RCP refers to Representative Concentration Pathway; 4.5 and 8.5 refer to the warming influence expected in 2100 from the projected greenhouse gas concentrations.
Source: Hegewisch & Abatzoglou, n.d.-b., CC BY 4.0
Winter temperatures - Temperatures in winter also appear to be rising, though not as rapidly as summer temperatures. The trend for January mean temperature in Utah indicates an increase of about 0.7 °F per decade since 1979, but these data are more variable, and the trend is not statistically significant (P = 0.12). More warming, however, is anticipated. By 2100, under the RCP 4.5 and RCP 8.5 emissions scenarios, winter temperatures in Utah are expected to rise by 3.8 °F and 8.2 °F, respectively (Figure 4).

(RCP 4.5) and “Higher” (RCP 8.5) Emissions Scenarios
Source: Hegewisch & Abatzoglou, n.d.-b., CC BY 4.0
Precipitation and Snowpack
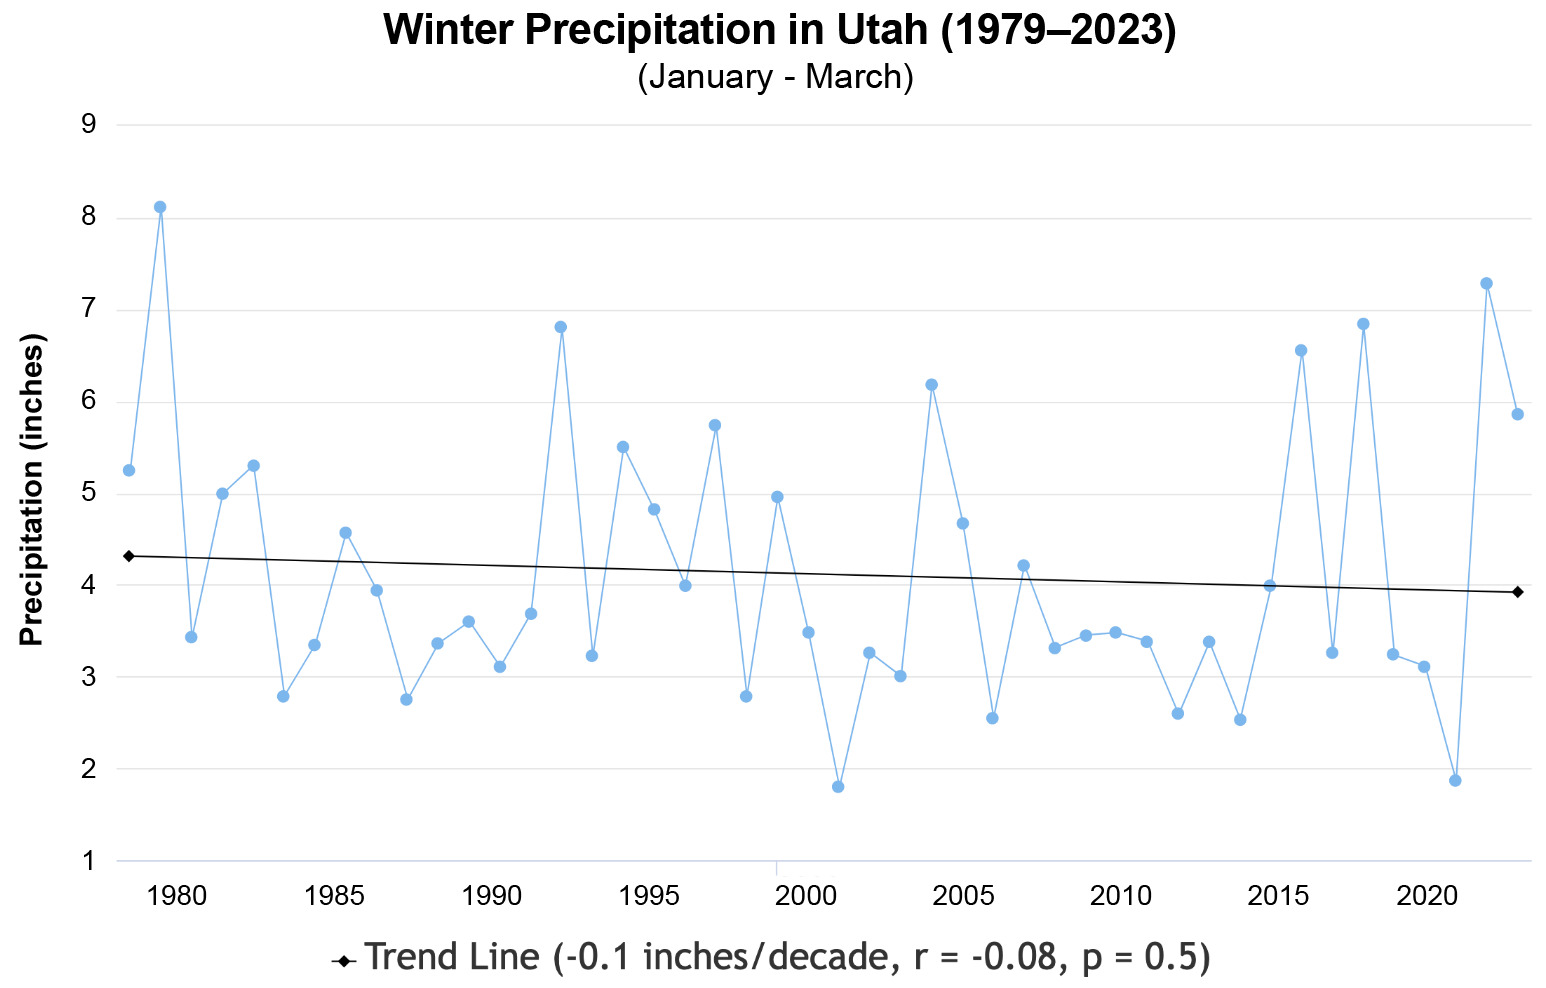
The amount of winter precipitation falling in Utah has not meaningfully changed in the last 40 years, nor is it projected to (Figure 5; Hegewisch & Abatzoglou, n.d.-b). However, rising temperatures are impacting Utah’s water supply by increasing the percentage of winter precipitation falling as rain rather than snow. Between 1960 and 2010, the proportion of winter precipitation falling as snow declined by about 9% (Gillies et al., 2012), contributing to a 16% decline in peak snowpack statewide from 1979 to 2023 (Figure 6, top). Here, snowpack refers to snow water equivalent—a standard measure that corresponds to the amount of liquid water the snow would yield when melted.
The timing of snowpack accumulation is also changing. Since 1979, the date of peak snowpack in Utah has advanced by roughly 9 days (Figure 6, bottom). Looking ahead, projections indicate that by 2062, the Upper Colorado Basin, which includes much of eastern Utah, will begin seeing years where seasonal snowpack does not accumulate, i.e., less than 10% of the current typical spring snow water equivalent is expected (Siirila-Woodburn et al., 2021). This lack of snowpack will remove the massive natural, frozen reservoir that steadily melts, filling lakes and keeping streams flowing in late summer.
Source: Hegewisch & Abatzoglou, n.d.-b., CC BY 4.0
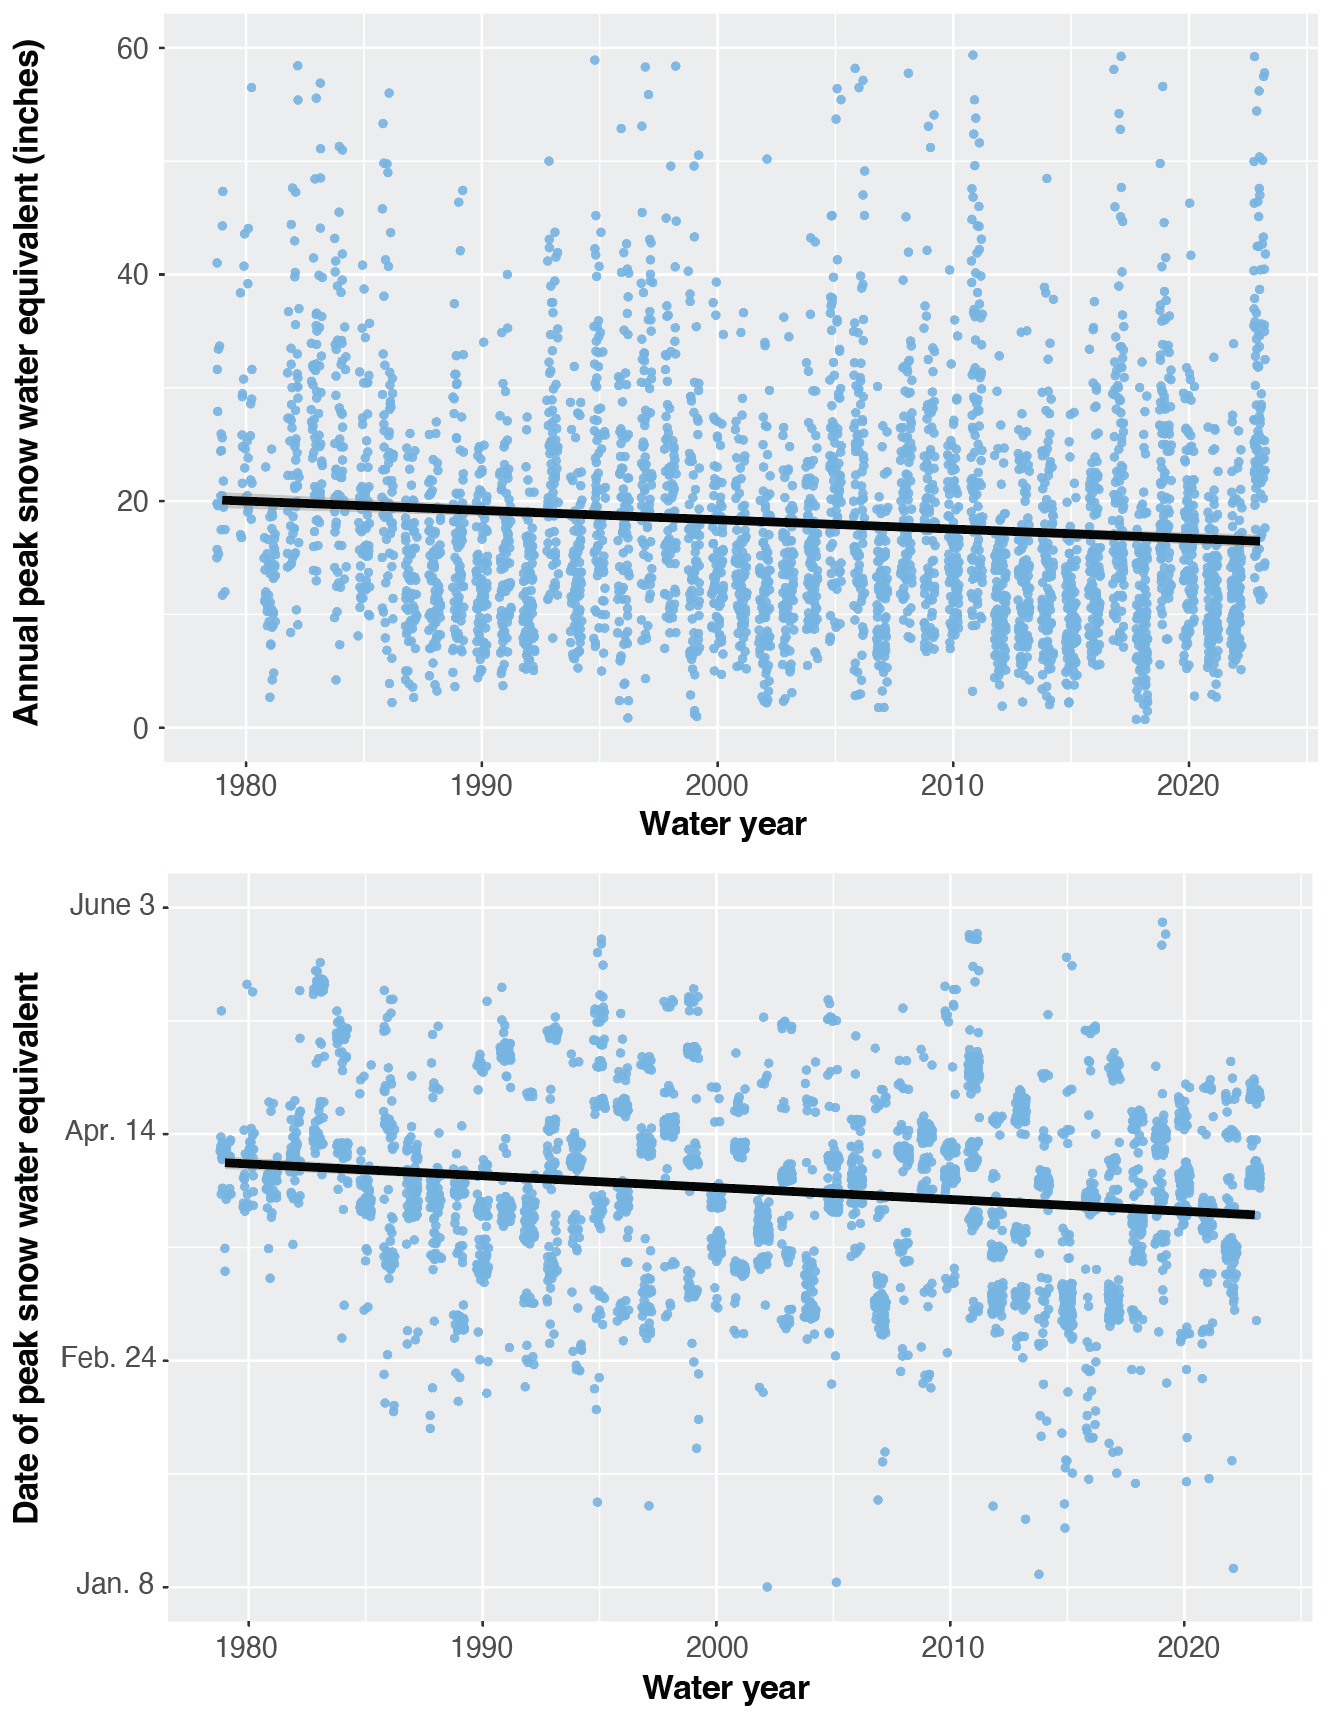
Notes. A water year begins on October 1 of the previous year and ends on September 30 of the named year. Each circle represents one water year of data for a SNOpack TELemetry (SNOTEL) station in Utah.
Data sources: Natural Resource Conservation Service (NRCS) and National Water and Climate Center, n.d.; NRCS, n.d.
Streamflow
In mountain regions, summer streamflows are linked to the amount of snowpack that accumulated during the preceding winter and the timing of snowmelt. Thus, reduced peak snowpack and shifts toward an earlier peak––a response to warmer temperatures––can change stream baseflows. For example, August discharge in northern Utah’s Logan River has declined since 1979 (Figure 7). While this decline has not been directly attributed to climate change, it parallels expectations that consider regional temperature increases and snowpack declines during this period (Figures 2 and 6).
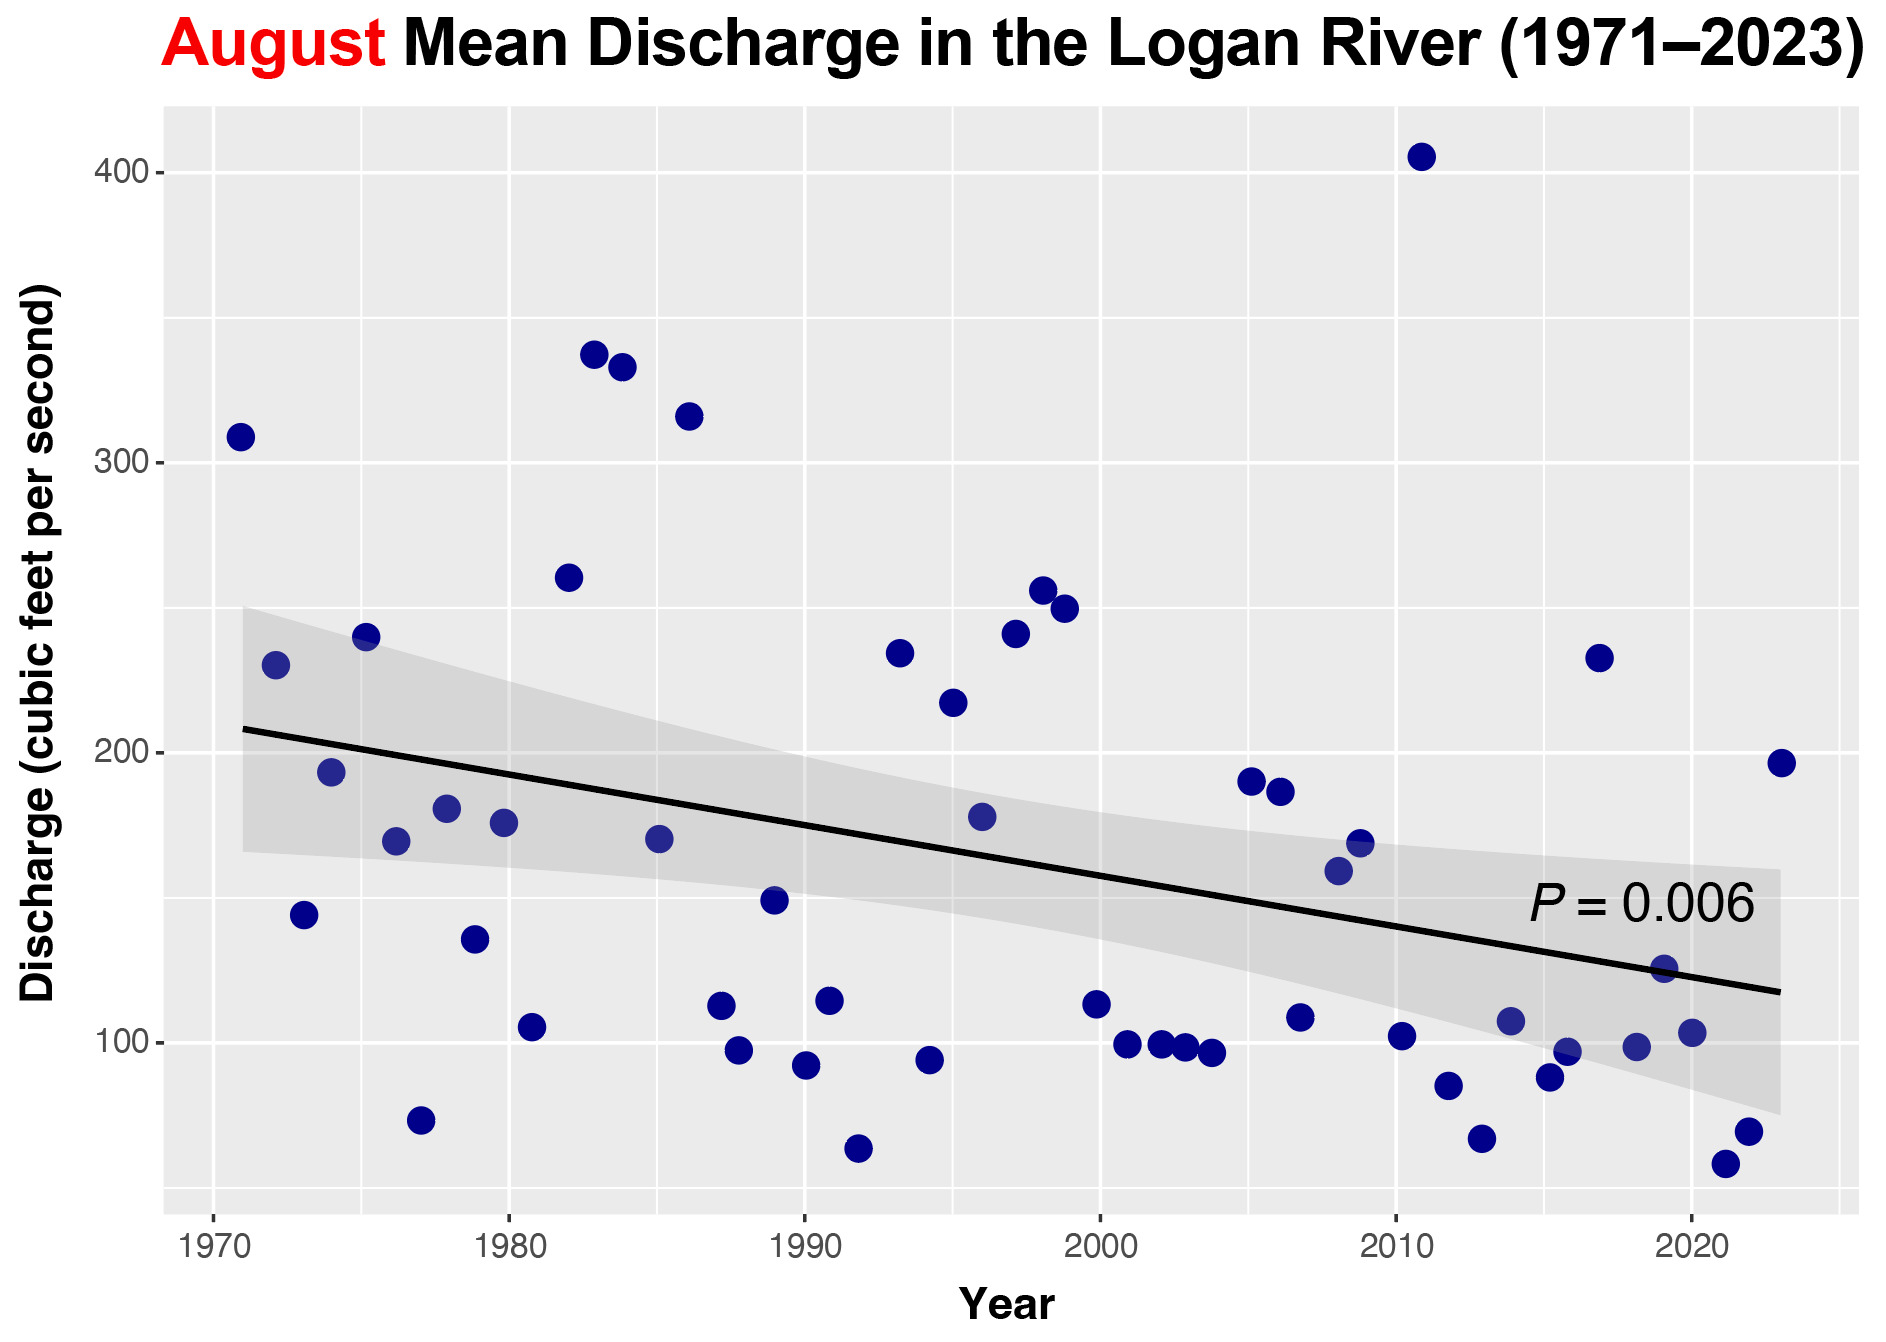
Data source: U.S. Geological Survey, n.d.

Photo credit: Adrille, 2007, CC BY-SA 3.0
The Colorado River (Figure 8) — one of the most iconic and influential rivers in the American West—is also impacted by climate change. From 1916 to 2014, streamflow in the Upper Colorado River Basin, which includes eastern Utah, declined by over 16% despite a slight increase in precipitation over the same period (Xiao et al., 2018). Over half of the decline (about 9%) was directly attributed to warming in the region.
In the central Rocky Mountains, an analysis of August discharge for 153 streams from 1950 to 2008 found that 89% of all nonregulated streams are experiencing declines. Furthermore, “pristine” sites—those without diversions or land-use change during the study period—are experiencing the most rapid decline, with an average 23% decline in August discharge (Leppi et al., 2012). Reduced streamflow can transform streams from perennial, where they flow all year, to ephemeral, where they only flow intermittently, thereby altering the communities of plants, animals, and other organisms the streams can support.
Wildfire
In addition to reducing water availability, higher temperatures affect fire risk by increasing vapor pressure deficit, which draws moisture out of fuel, making it more flammable (Figure 9). Across the western United States, contemporary climate change accounted for about 55% of the observed increase in fuel aridity from 1979 to 2015 (Abatzoglou & Williams, 2016). In July 2007, the largest wildfire in Utah’s recent history occurred—the Milford Flat Fire. The fire was ignited by lightning and, in less than two weeks, burned about 363,000 acres. As temperatures continue to rise and fuel becomes drier, the frequency and severity of large fires in Utah will likely increase. Changes in fire regime affect habitat by altering the structure and type of vegetation (Agee, 1993).
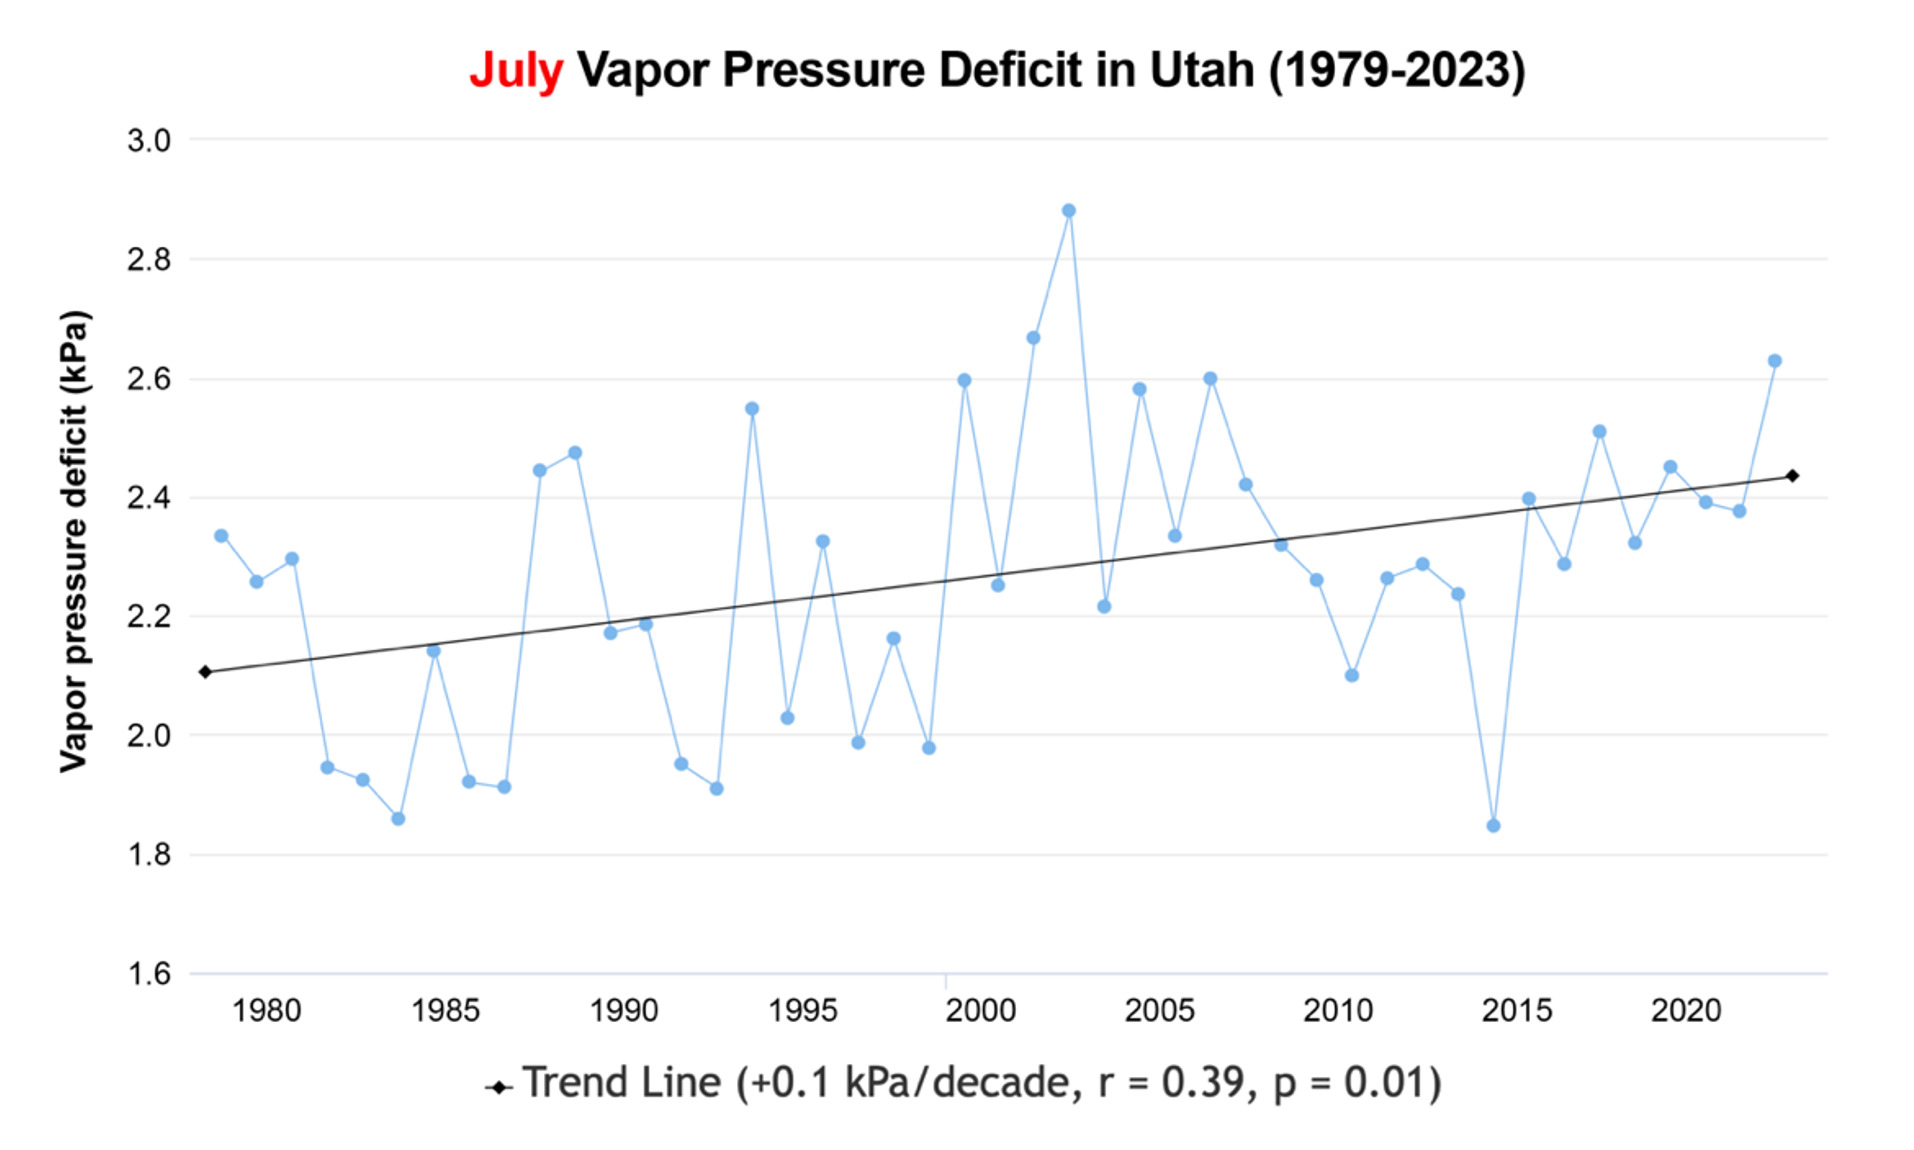
Source: Hegewisch & Abatzoglou, n.d.-b., CC BY 4.0
Ecological Change
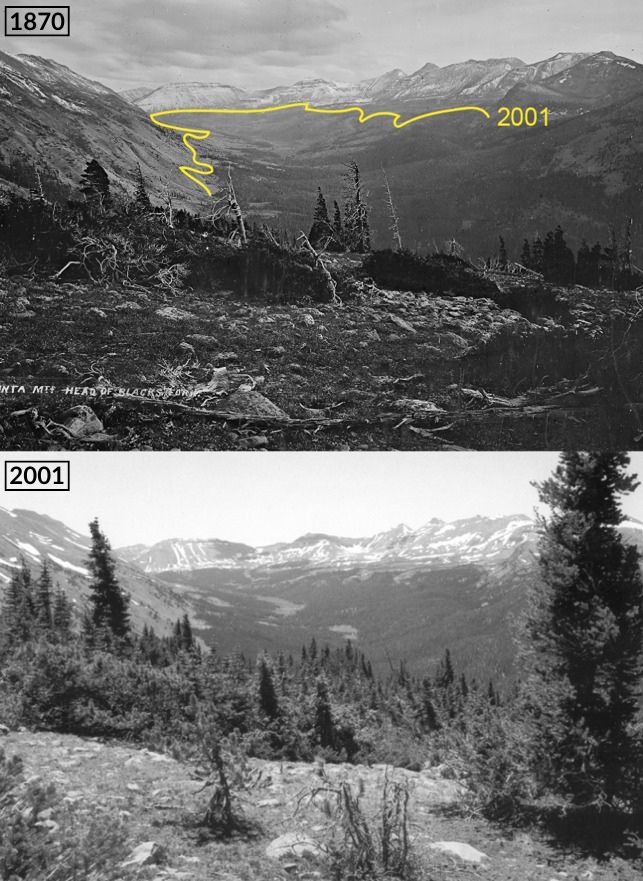
Climate change is also driving ecological changes in Utah; however, given the long timescale of the change and the difficulty of collecting long-term data, specific examples for Utah are rare. Using repeat photographs spanning 131 years (1870–2001), Munroe (2003) documented a roughly 100-meter uphill shift of tree line in the Uinta Mountains (Figure 10). When tree lines shift uphill, which can occur in response to climate warming, alpine habitats shrink. Warmer temperatures can also threaten species diversity. In northwestern Montana, warming mountain streams are driving a rise in hybridization between non-native rainbow trout and native westslope cutthroat trout (Mulhfeld et al., 2014). Given the similar dynamics between non-native rainbow trout and Bonneville cutthroat trout in Utah (e.g., Meyer et al., 2022), climate change may also contribute to hybridization of these species in local fisheries.
Source: Hegewisch & Abatzoglou, n.d.-b., CC BY 4.0
Note. The yellow line on the 1870 photograph shows that tree line moved 100 m uphill by 2001, reducing alpine habitat.
Photo credits: (top) Jackson, W. H., 1870, and (bottom) Munroe, J. S., 2003, used with permission
Generally, higher temperatures, declining snowpack, and reduced late-summer streamflow in Utah will alter the mosaic of existing habitats. For instance, these conditions will likely extend the Great Basin desert to higher elevations and expand its geographic range. At the same time, habitats above tree line will contract as downslope tree species shift uphill. Long-term data sets are needed to track these changes and their effects.
Acknowledgments
This publication was supported by the “Secure Water Future” project that is funded by an Agriculture and Food Research Initiative Competitive Grant (#2021-69012-35916) from the USDA National Institute of Food and Agriculture. To learn more, visit USU Extension’s Climate Adaptation & Resiliency website.
For correspondence, contact Scott Hotaling: scott.hotaling@usu.edu.
References
Abatzoglou, J. T. & Williams, A. P. (2016). Impact of anthropogenic climate change on wildfire across western US forests. Proceedings of the National Academy of Sciences, 113(42), 11770–11775. https://doi.org/10.1073/pnas.1607171113
Adrille. (2007, June). File: Colorado River edit2.jpg. Wikimedia Commons. https://commons.wikimedia.org/w/index.php?curid=3204619
Agee, J. K. (1993). Fire ecology of Pacific Northwest forests. Island Press, Washington DC.
Crowley, T. J. (2000). Causes of climate change over the past 1000 years. Science, 289, 270–277. https://www.science.org/doi/10.1126/science.289.5477.270
Gillies, R. R., Wang, S. Y., & Booth, M. R. (2012). Observational and synoptic analyses of the winter precipitation regime change over Utah. Journal of Climate, 25(13), 4679–4698. https://doi.org/10.1175/JCLI-D-11-00084.1
Jackson, W. H. (1870). Head of Black's Fork, Uinta Mountains, Summit County, Utah [Photograph No. 516926]. Hayden Survey, Records of the U.S. Geological Survey, Record Group 57. National Archives at College Park––Still Pictures. https://catalog.archives.gov/id/516926?objectPage=3
Hegewisch, K. C. & Abatzoglou, J. T. (n.d.-a). Historical climate tracker [Web tool]. Climate Toolbox, University of California. Accessed on July 20, 2024, from https://climatetoolbox.org/tool/Historical-Climate-Tracker
Hegewisch, K. C. & Abatzoglou, J. T. (n.d.-b). Future time series [Web tool]. Climate Toolbox, University of California. Accessed on July 25, 2024, from https://climatetoolbox.org/tool/future-time-series
Leppi, J. C., DeLuca, T. H., Harrar, S. W., & Running, S. W. (2012). Impacts of climate change on August stream discharge in the Central-Rocky Mountains. Climatic Change, 112, 997–1014. https://doi.org/10.1007/s10584-011-0235-1
Meyer, K. A., Hillyard, R. W., & Campbell, M. R. (2022). Detecting rainbow trout introgression in Bonneville cutthroat trout of the Bear River basin using field-based phenotypic characteristics. Western North American Naturalist, 82(1), 117–127. https://doi.org/10.3398/064.082.0111
Muhlfeld, C. C., Kovach, R. P., Jones, L. A., Al-Chokhachy, R., Boyer, M. C., Leary, R. F., Lowe, W. H., Luikart, G., & Allendorf, F. W. (2014). Invasive hybridization in a threatened species is accelerated by climate change. Nature Climate Change, 4(7), 620–624. https://www.nature.com/articles/nclimate2252
Munroe, J. S. (2003). Estimates of Little Ice Age climate inferred through historical rephotography, northern Uinta Mountains, USA. Arctic, Antarctic, and Alpine Research, 35(4), 489–498. http://www.jstor.org/stable/1552352
National Resource Conservation Service (NRCS) and National Water and Climate Center. (n.d.). SNOTEL sensor data. U.S. Department of Agriculture. https://www.nrcs.usda.gov/wps/portal/wcc/home/snowClimateMonitoring/snowpack/snotelSensorData/
NRCS. (n.d.). Report generator. U.S. Department of Agriculture. https://wcc.sc.egov.usda.gov/reportGenerator/
Siirila-Woodburn, E. R., Rhoades, A. M., Hatchett, B. J., Huning, L. S., Szinai, J., Tague, C., Nico, P. S., Feldman, D. R., Jones, A. D., Collins, W. D., & Kaatz, L. (2021). A low-to-no snow future and its impacts on water resources in the western United States. Nature Reviews Earth & Environment, 2(11), 800–819. https://doi.org/10.1038/s43017-021-00219-y
U.S. Geological Survey (USGS). (n.d.). National water information system: Web interface. U.S. Department of the Interior. Retrieved on July 31, 2024, from https://waterdata.usgs.gov/nwis/dv?referred_module=sw&site_no=10109000
Xiao, M., Udall, B., & Lettenmaier, D. P. (2018). On the causes of declining Colorado River streamflows. Water Resources Research, 54(9), 6739–6756. https://doi.org/10.1029/2018WR023153
August 2024
Utah State University Extension
Authors
Scott Hotaling, Ph.D.,1,2 Kendall Becker, Ph.D.1,2
1Department of Watershed Sciences, Utah State University
2Climate Resiliency Extension, Utah State University

Scott Hotaling
Assistant Professor | Climate Resiliency Specialist
Watershed Sciences
Related Research