Utah Fruit Grower Assessment Results Overview
Introduction
Utah boasts a rich history of fruit production, from the establishment of orchards by early settlers for personal and community use to the emergence of a thriving commercial fruit-growing industry in the early 1900s. This heritage is commemorated annually through various festivals across the state, such as Brigham City’s Peach Days held in August and Pleasant Grove’s Strawberry Days celebration in the spring (Doyle, 2021; Powell & Wood, 1995, pp. 207–208). Visitors to the state can visit the “Famous Fruit Way” that runs along I-15 from Willard to Perry in northern Utah and the sprawling orchards that hug the I-15 freeway near Payson and Santaquin in Utah County (Doyle, 2021).
In Utah’s early pioneer days, pioneer leaders encouraged settlers to plant fruit and were anxious to prove that a variety of crops could thrive in the region (Powell & Wood, 1995). In the late 1800s, farmers began to take surplus fruit into the cities and market their crops to grocers (Powell & Wood, 1995). Today, locally grown fruit contributes significantly to Utah’s economy (O’Donoghue, 2023; National Agricultural Statistics Service [NASS], 2023). Tart cherries, the state’s largest fruit crop, were valued at $5.6 million in 2022, spread across nearly 20 commercial producers around the state (O’Donoghue, 2023; NASS, 2023).
Fruit growers throughout Utah manage operations of varying sizes and sell their fruit products fresh or processed through various direct-to-consumer and wholesale markets. To better understand the fruit products under production and current marketing methods, as well as grower concerns and future business interests, researchers conducted an online survey via Qualtrics in early winter 2023. The survey was introduced at the January 2023 annual fruit growers meeting, and the survey link was distributed to fruit growers via the association email list serve. Sixteen[1] usable responses were collected and evaluated, and those results are outlined in the following sections.
[1] In 2022, the U.S. Department of Agriculture (USDA) reported 691 fruit and nut farms in Utah (NASS, 2022). At a 90% confidence level with a 20% margin of error, a sample size of 17 is representative.
Overview of Results
Fruit Operations
The majority of the production operations or orchards were located in Utah County (71%). Additional counties reported included Box Elder County, Cache County, and Wayne County (see Table 1). Two-thirds (67%) of the respondents indicated that their operation was not supported by off-farm income, suggesting fruit operations in Utah are mostly financially independent. Half of the respondents (50%) grow on more than 200 acres. The remaining respondents who grew on less than 200 acres were distributed evenly. Growers reported the number of full-time and part-time employees at their operation. Of the respondents, 40% indicated they had two or fewer full-time employees, while 20% reported employing 11–20 people full-time. A further 20% reported employing more than 20 people full-time. A third (33%) of the growers employed five or fewer seasonal employees while 27% of the growers employed 50 to100 seasonal employees. One-fifth (20%) of the respondents indicated they employ more than 100 seasonal laborers.
When questioned about the number of trees, bushes, or plants their operation cultivates annually, many reported that they did not know. Some simply reported that they grew “a lot” or “many.” Among those that reported numerical answers, the lowest number of trees cultivated was 600, and the highest was “more than 10,000.” From the numerical answers provided, the average number of annually cultivated trees is around 4,000. Average annual fruit production varied widely among respondents. The lowest reported production was 5,000 to 10,000 pounds of fruit annually, and the highest reported was “more than 10 million” pounds of fruit.
Table 1. Fruit Operaitons Characteristics
| Characteristic | Category | Sample (%) |
|---|---|---|
| Orchard/production location |
Utah County Box Elder County Cache County Wayne County |
71% 14% 7% 7% |
| Acreage in production | 25 acres or less 26 to 50 acres 51 to 100 acres 101 to 200 acres |
19% 13% 13% 6% 50% |
| Full-time employees | 2 or fewer employees 3 to 5 employees 6 to 10 employees 11 to 20 employees 21 or more employees |
40% 13% 7% 20% 20% |
| Seasonal employees | 5 or fewer employees 6 to 10 employees 11 to 20 employees 21 or more employees |
33% 7% 13% 0% 27% 20% |
| Off-farm income support | Yes No |
33% 67% |
Fruit Crops Produced
Nearly all the respondents (94%) primarily produced tree fruit, such as cherries, apples, or peaches. One grower respondent reported that their primary crop was berries. The most common tree fruits produced were apples and peaches, grown by 94% of respondents (see Figure 1). More than 60% of growers produced pears as well as sweet and tart cherries, and 50% of the respondents indicated they grew nectarines. Secondary crops produced varied more among respondents. Nearly a third (31%) of the respondents’ secondary crops were vegetables. A quarter of the respondents reported tree fruit as a secondary crop. Close to 20% produced berries and 13% other fruit. A few growers reported growing cover crops and field crops (7% for both).
Figure 1. Fruit Crops Produced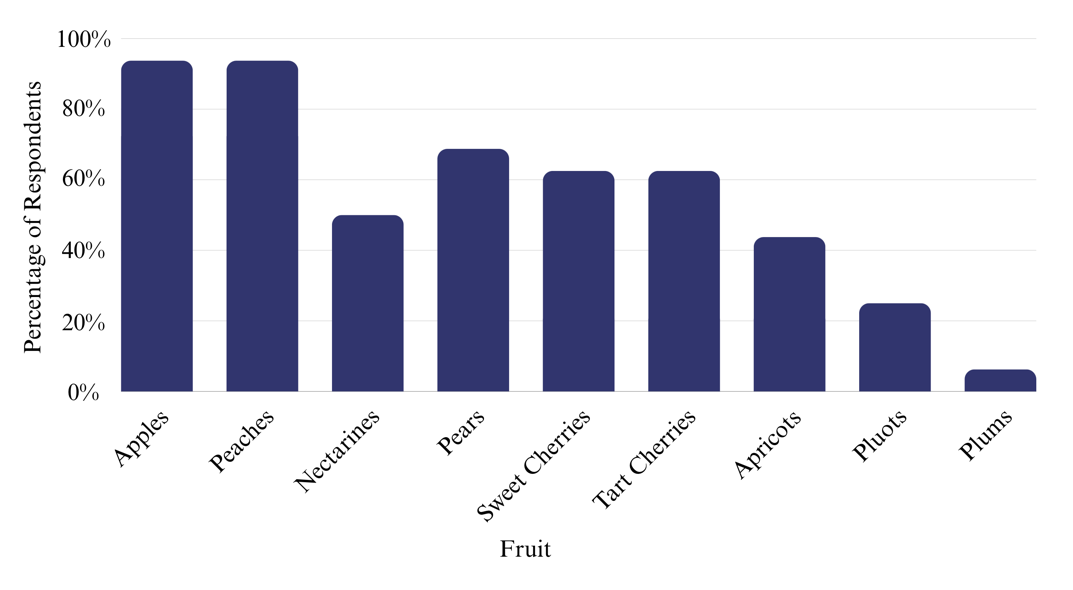
Value-Added and Processed Products
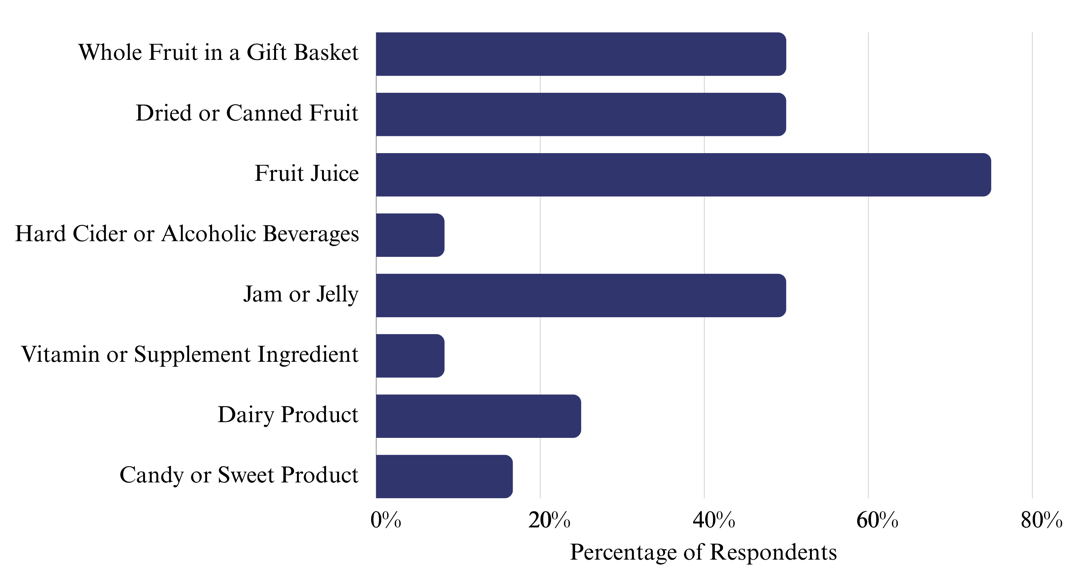
Respondents were asked if they process their fruit before sale. Three-quarters (75%) of the respondents reported their fruit was used in fruit juice (see Figure 2). Half of the grower respondents sold whole fruit in gift baskets or packages, dried or canned fruit products, or jam or jelly. The least common products were hard ciders or alcoholic beverages and supplements. The low prevalence of alcoholic beverages may be related to the low rates of alcohol consumption by Utah adults in comparison to other states (Centers for Disease Control [CDC], 2023). While the production of a large range of supplements and vitamins is high in Utah, fruit products grown in Utah are not often used in these supplements (Daniells, 2012). One exception includes tart cherries, which, when processed into tart cherry powder or extract, are used as a homeopathic remedy for various ailments (Brinckmann & Brendler, 2020). Tart cherry products include juices, jams or jellies, supplements, dairy products, vitamins, creams, and other cosmetics. For example, tart cherry juice is the latest popular ingredient in the fast-growing mocktail movement (McCarthy, 20).
Figure 2. Processed Fruit Products Produced
More than half (58%) of the respondents indicated that they process their own fruit products rather than selling raw products to another entity for processing. Two of the respondents reported that they use a combination of methods, processing products themselves and selling them to another entity for processing.
Marketing and Sales
Three-quarters (75%) of the grower respondents use a combination of wholesale and direct-to-consumer sales methods. When asked to specify the proportion of their sales from wholesale markets compared to direct-to-consumer markets, respondents provided varying answers. The most popular answer, chosen by a quarter (25%) of respondents, was 30% of sales from direct-to-consumer markets and 70% of sales via wholesale markets. Most growers use both wholesale and direct-to-consumer markets, with wholesale sales comprising the larger share. Growers were then asked what direct-to-consumer markets they use. The majority (81%) indicated that they sold through farm stands or farm stores (see Figure 3). More than half (56%) also sold products at farmers markets. None of the respondents use community-supported agriculture (CSA) programs.
Figure 3. Direct-to-Consumer Markets Used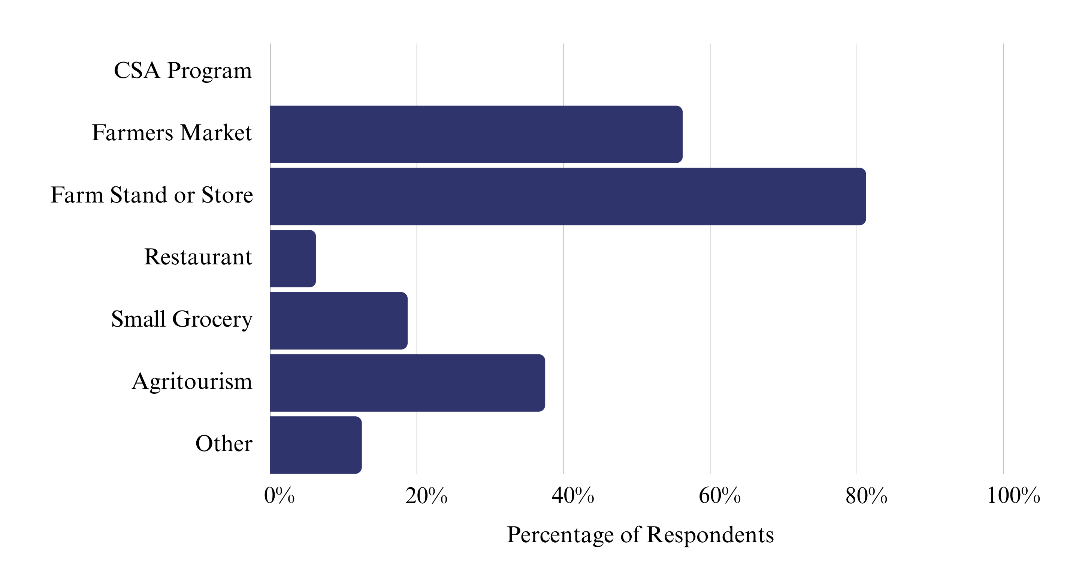
In terms of wholesale markets, the most popular method was through a wholesale buyer, which was selected by 75% of respondents (see Figure 4). More than half (56%) of the respondents also reported selling to local or regional grocery chains. In comparison, only 31% of respondents sold through large grocery chains. This may imply that selling to smaller grocery chains may be more effective for Utah fruit growers, thus accessing consumers who prefer local fruit (Curtis et al., 2020; Dumont, 2017).
Figure 4. Wholesale Markets Used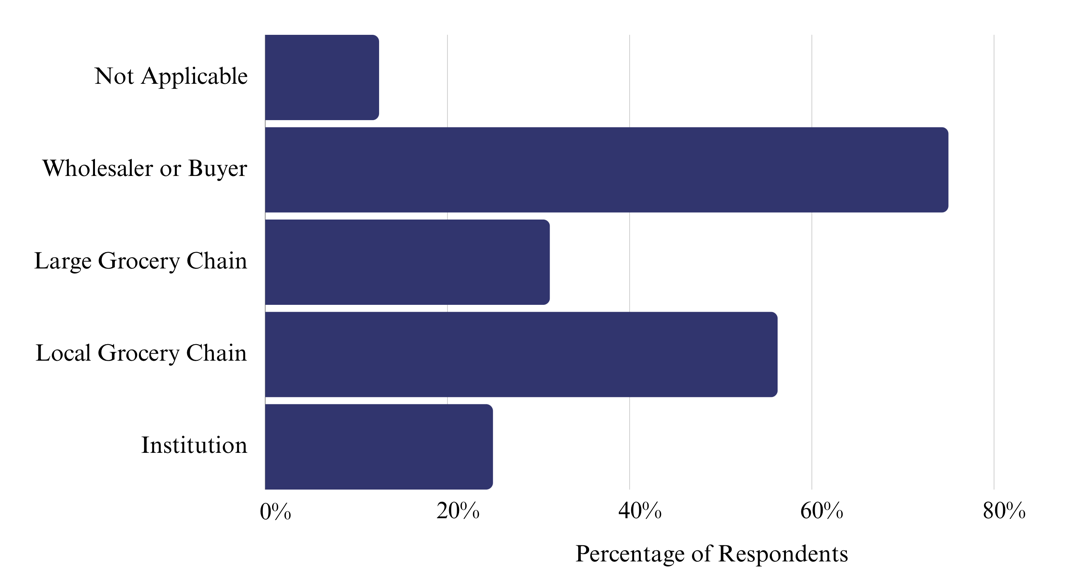
Grower Concerns
Growers were asked to report their operation’s primary concerns related to production and marketing. Results varied, but a third (33%) indicated they focused on finding new markets for existing products (see Table 2). Over a quarter (27%) indicated they needed assistance marketing their current products but did not specify the products or markets. No clear patterns emerged when respondents were asked about future business interests. Some expressed interest in establishing a cottage kitchen, starting a farm-to-table agritourism enterprise, or offering other on-farm experiences. Growers also expressed interest in strategies for selling their locally grown products within their communities, as well as the demand for locally grown fruit in urban areas such as Salt Lake City.
| Need/Concern | Sample (%) |
|---|---|
| Non/not applicable | 7% |
| New products/services | 13% |
| Marketing existing products | 27% |
| New markets for existing products | 33% |
| Decision tools | 7% |
| Value-added products/processing equipment | 13% |
Conclusions
The survey results discussed here demonstrate that fruit-growing operations in Utah vary widely in size, ranging from farms larger than 200 acres with 20 full-time employees to those cultivating fruit on less than 25 acres with two or fewer employees. Additionally, fruit growers in Utah are highly educated, as three-quarters have at least a bachelor’s degree.
Three-quarters of the respondents use some combination of wholesale and direct-to-consumer markets. However, the largest proportion of their fruit sales went to wholesale markets. Growers commonly process their fruit, with the highest proportion going to fruit juice. Additionally, half of the growers indicated their fruit went into dried or canned fruit products or whole fruit in gift baskets or packages.
When asked about their operations’ concerns and business interests moving forward, growers highlighted the importance of marketing their existing products both in their current markets but also expanding into new markets and assessing the potential of locally grown products in urban areas. Finally, several growers expressed interest in engaging with their community through agritourism opportunities.
Acknowledgements
This material is based upon work that is supported by the National Institute of Food and Agriculture, U.S. Department of Agriculture, under award number 2020-38640-31523 through the Western Sustainable Agriculture Research and Education program under project number SW21-923. USDA is an equal opportunity employer and service provider. Any opinions, findings, conclusions, or recommendations expressed in this publication are those of the author(s) and do not necessarily reflect the view of the U.S. Department of Agriculture.
References
- Brinckmann, J., & Brendler, T. (2020). Tart cherry. HerbalGram, 128, 6–16.
- Centers for Disease Control (CDC). (2023). BRFSS prevalence & trends data - Explore by topic: Alcohol consumption. https://nccd.cdc.gov/BRFSSPrevalence/rdPage.aspx rdReport=DPH_BRFSS.ExploreByTopic&irbLocationType=StatesAndMMSA&islClass=CLASS01&islTopic=TOPIC03&islYear=2022&islLocation=
- Curtis, K. R., Drugova, T., Knudsen, T., Reeve, J., & Ward, R. (2020). Is organic certification important to farmers’ market shoppers or is eco-friendly enough? HortScience, 55(11), 1822–1831. https://doi.org/10.21273/hortsci15291-20
- Daniells, S. (2012, May 22). Dietary supplements become Utah’s #1 industry, topping $7.2 billion. NutraIngredients – USA, William Reed. https://www.nutraingredients-usa.com/Article/2012/05/23/Dietary-supplements-become-Utah-s-1-industry-topping-7.2-billion#:~:text=Dietary%20supplements%20are%20the%20largest
- Doyle, D. (2021). Utah’s fruit way: Find local, fresh fruit along highway 89. Visit Utah, Utah Office of Tourism. https://www.visitutah.com/Articles/utahs-fruit-way-highway-89
- Dumont, A. (2017, December 5). The economic impact of locally produced food. Federal Reserve Bank of St. Louis. https://www.stlouisfed.org/on-the-economy/2017/december/economic-impact-locally-produced-food
- McCarthy, C. (2024). What is a sleepy girl mocktail? How to make the viral tart cherry juice pre-bedtime drink. Good Morning America, ABC News. https://abcnews.go.com/GMA/Food/sleepy-girl-mocktail-make-viral-tart-cherry-juice/story?id=106442503
- National Agricultural Statistics Service (NASS). (2022). Census of agriculture for Utah, Specified fruits and nuts by acres: 2022 and 2017. U.S. Department of Agriculture. https://www.nass.usda.gov/Publications/AgCensus/2022/Full_Report/Volume_1,_Chapter_1_State_Level/Utah/st49_1_037_037.pdf
- NASS. (2023). Non citrus fruits and nuts 2022 summary. U.S. Department of Agriculture. https://downloads.usda.library.cornell.edu/usda-esmis/files/zs25x846c/zk51wx21m/k356bk214/ncit0523.pdf
- O’Donoghue, A. J. (2023, July 28). Tart cherry production: Little tasty fruit is grown big time in Utah. Deseret News. https://www.deseret.com/2023/7/28/23809958/utah-county-tart-cherry-production-tasty-fruit-utah-agriculture-cherry-marketing-institute
- Powell, A. K., & Wood, S. R. (1995). Utah history encyclopedia (pp. 207–208). University Of Utah Press.
July 2024
Utah State University Extension
Peer-reviewed fact sheet
Authors
Makaylie Langford, USU Extension Intern, Department of Applied Economics
Kynda Curtis, Professor and USU Extension Specialist, Department of Applied Economics

Kynda Curtis
Food Systems Specialist
APEC Dept