Consumer Perceptions and Preferences for Utah Fresh and Packaged Fruit
Introduction
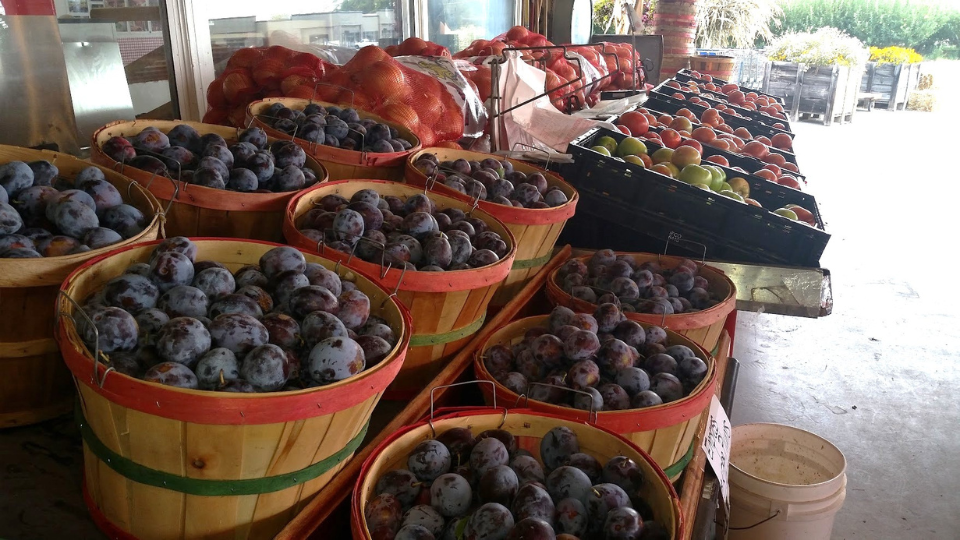
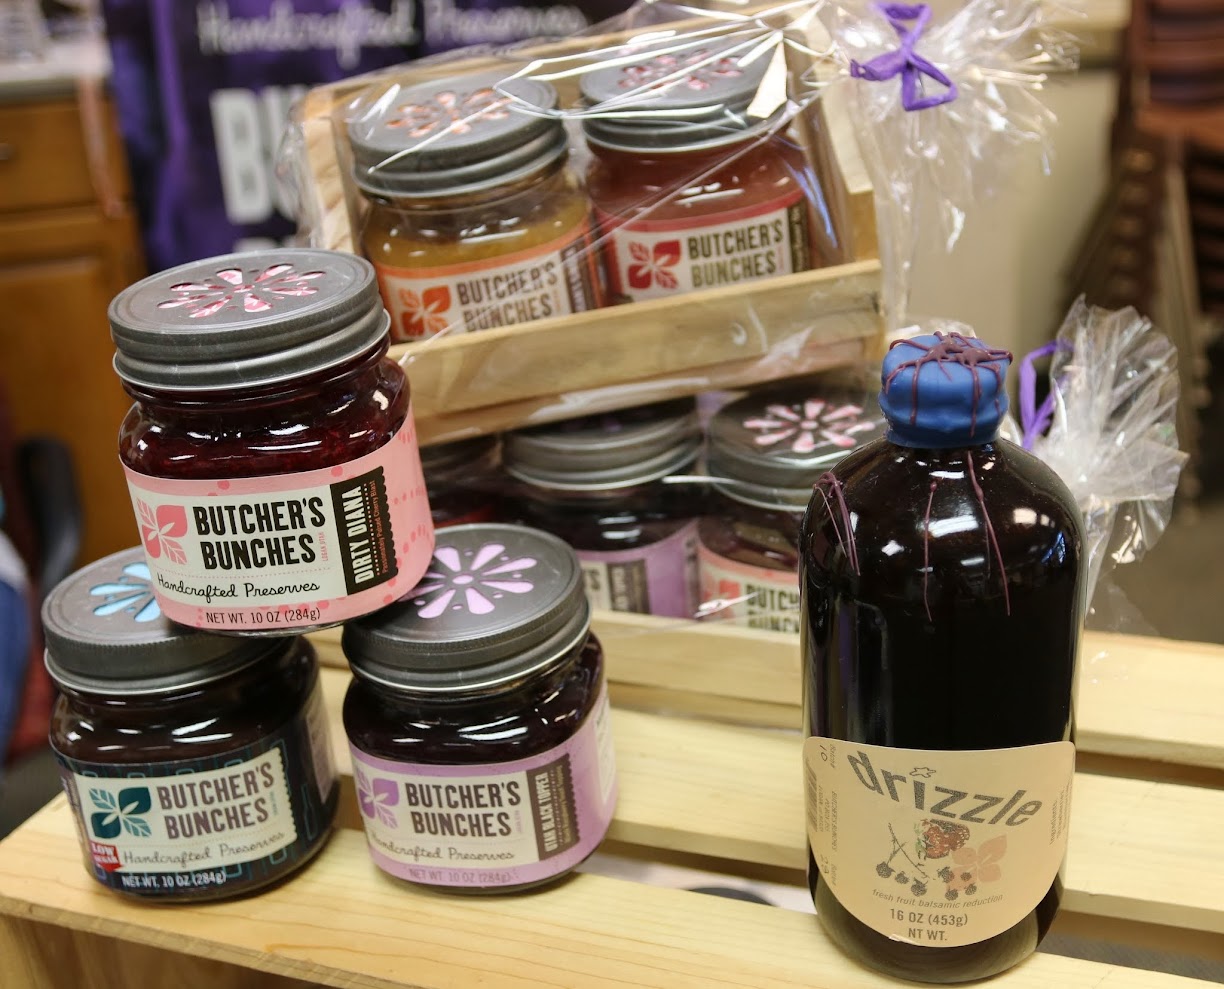
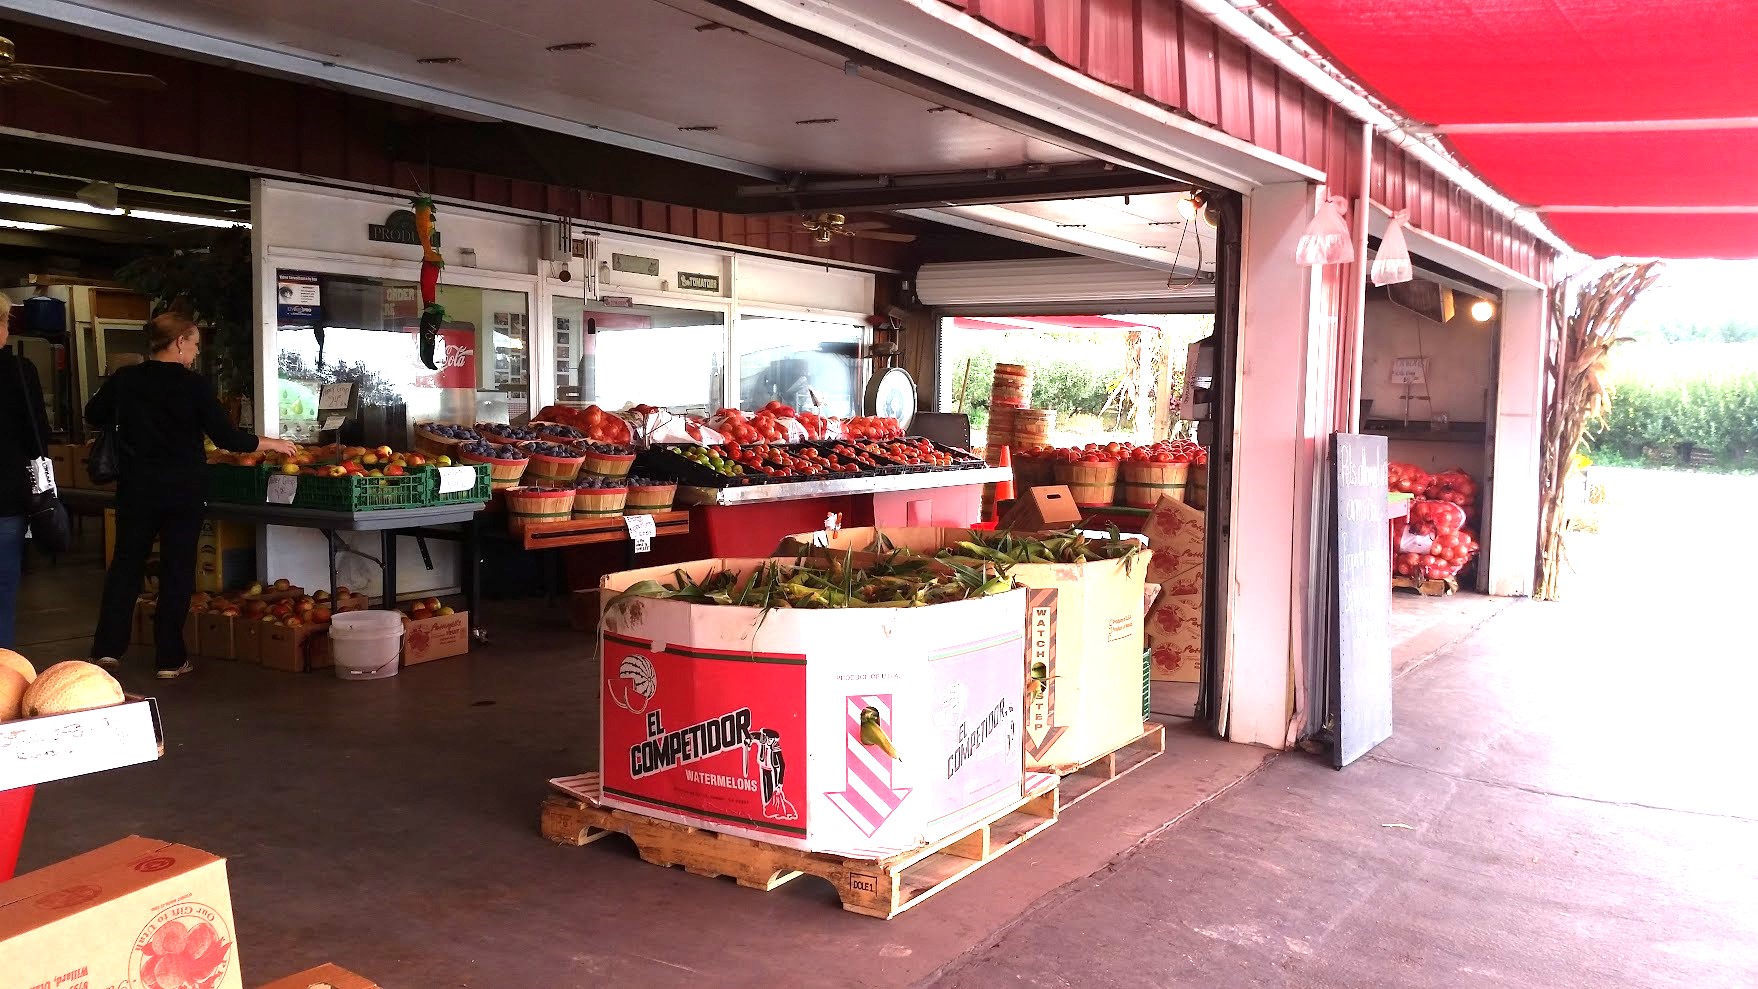
From Brigham City’s Peach Days to Strawberry Days in Pleasant Grove, Utah continues its tradition of celebrating its fruit-growing heritage. Travelers along I-15 between Perry and Willard, Utah, still pass through acres of fruit orchards, known as “Utah’s Famous Fruit Way” (Doyle, 2021). Further south, near Payson and Santaquin, cherry orchards line the freeway, producing fruit that may be sold fresh or processed and incorporated into products sold locally, statewide, or distributed to distant markets (O’Donoghue, 2023).
Fruit production significantly contributes to Utah’s economy. Utah’s largest fruit crop, tart cherries, was valued at $7.9 million in 2023 (National Agricultural Statistics Service [NASS], 2023). In 2022, 3,714 acres in Utah were dedicated to tart cherry production, producing more than 32.5 million pounds of tart cherries (NASS, 2022; NASS, 2023). Peaches are second to tart cherries in both acres cultivated and tons of fruit produced, as 1,310 acres of peaches are cultivated in Utah. Apple production is similar, with 1,104 acres dedicated to apple cultivation (NASS, 2022).
Beyond economic gains, local fruit production ensures fruit harvest at peak ripeness and higher nutrient concentrations, improves food safety, and preserves farmland and green spaces within communities.
Local fruit production offers benefits beyond mere economic gains. Previous studies show that consumers are willing to pay more for locally grown foods (Capelli et al., 2022). Consumer preferences for local foods often stem from the belief that local produce is fresher, more flavorful, and of higher quality than fruit transported and stored for longer periods of time (Klavinski, 2013; McCurdy, 2022). The shorter time between harvest and consumption ensures that fruit is picked at peak ripeness and may have higher concentrations of essential nutrients like potassium, phosphorus, Vitamin C, and Vitamin A. The shorter supply chain minimizes the risk of contamination, improving food safety (Capelli et al., 2022, Klavinski, 2013; McCurdy, 2022). Additionally, the shorter distance required for food to travel from farm to the table may also result in decreased transportation-related emissions, benefiting the environment (Klavinski, 2013; McCurdy, 2022). Supporting local farms plays a crucial role in preserving farmland and green spaces within communities. Finally, growers selling their locally grown produce directly to consumers retain a higher proportion of the profits compared to selling through wholesale supply chains (Dumont, 2017; Klavinski, 2013).
In this fact sheet, we discuss the results of a 2023 study examining Utah consumer perceptions and preferences for Utah fresh and packaged fruit products. Study data were collected online via a Qualtrics survey, and 384 Utah adults completed the survey. Utah consumer food behaviors and attitudes, including participation in food and agricultural tourism activities, are discussed. We analyze the most consumed fruits and the preferred purchasing options for various fruit types, such as packaged, frozen, canned, and fresh. Additionally, we explore the factors influencing consumers’ decisions when buying fruit and review the product information they rely on. Overall, the demographic and behavioral data in this fact sheet allows fruit producers to make informed decisions regarding product development, marketing strategies, distribution channels, and consumer engagement. By understanding consumer preferences and behaviors, fruit producers can competitively and effectively meet market demands.
Respondent Demographics
Table 1 provides an overview of the survey respondent demographics. Generally, they closely resemble Utah demographics overall. An equal number of respondents fell into the 18–34 age group and the 35–54 age group. Two-thirds of the respondents were female, just under a third were male, and just over 2% identified as transgender or non-binary. Many respondents (61%) had at least some college education, and over 35% had finished high school or completed a GED. Nearly half (47%) were employed full-time, and an additional 26% of the respondents were employed part-time or were homemakers. Just over half of the respondents (54%) were married, and just under half (46%) had children under 18 living in their household.
Most of the respondents (83%) reported an annual income above the federal poverty level (FPL) for a family of four. Close to a quarter of the respondents (24%) reported an income between $100,000 and $150,000 annually. The majority live in an urban county in Utah (86%), which is slightly below the level of Utahns living in urban areas (90% in 2020; Bateman, 2020). About two-thirds of respondents reported they were the primary grocery shopper for their household, while an additional 29% indicated that they were involved in grocery shopping but shared this responsibility with another person.
| Characteristic | Category | Sample (%) |
|---|---|---|
| Gender | Male Female Non-binary/self-identified |
30% 67% 2% |
| Age | 18-34 years 35-54 years 55-64 years 65 years and over |
38% 38% 11% 12% |
| Household Income (2022 annual) |
$0 to $29,999 $30,000 or more |
17% 83% |
| Marital status | Single Married |
37% 54% |
| Children in household | Yes | 46% |
| Education level | Less than a high school degree High school degree or GED Some college Associate or bachelor's degree Graduate degree |
5% 34% 21% 27% 12.5% |
| Employment status | Unemployed/student/retired Employed part-time/homemaker Employed full-time |
26% 26% 48% |
| Residence location | Rural county Urban county |
14% 86% |
| Grocery shopper | Primary shopper Shared responsibility |
67% 29% |
Food-Related Behaviors and Beliefs

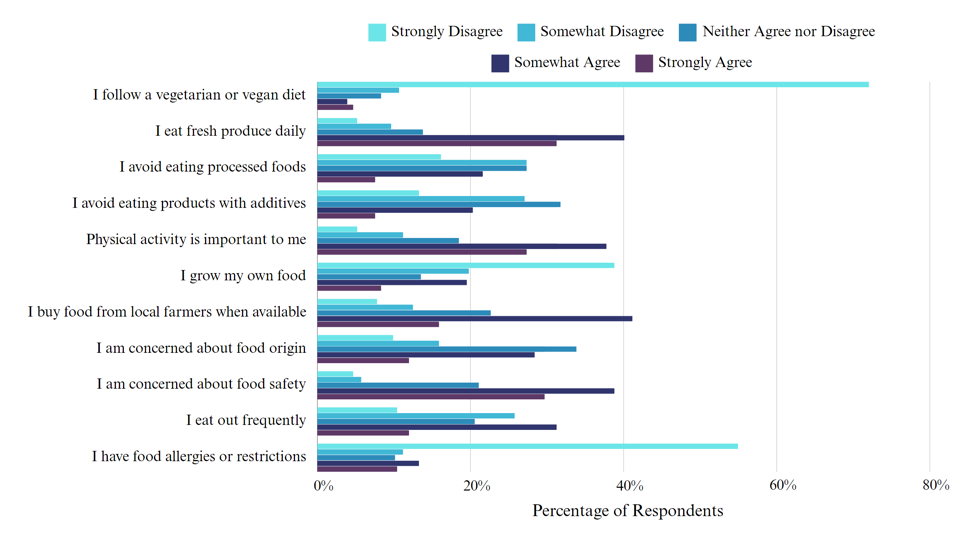
Respondents were asked to indicate their level of agreement with statements about their food behaviors and beliefs (see Figure 1). Only 7% of respondents regularly follow a vegetarian diet, but a strong majority (71%) eat fruits or vegetables daily, suggesting that an omnivorous dietary pattern is common among those surveyed. Almost two-thirds of the respondents (65%) agreed that physical activity or exercise is an important part of their routine. Only 29% of the respondents avoid processed foods. Further, when asked if they avoided foods with additives, only 28% agreed. Only 28% grew their own food, but 40% were concerned about their foods’ origins, and more than two-thirds (68%) were concerned about food safety. Just over half of the respondents (57%) purchase food from local farmers when available.
Figure 1. Food-Related Behaviors and Beliefs
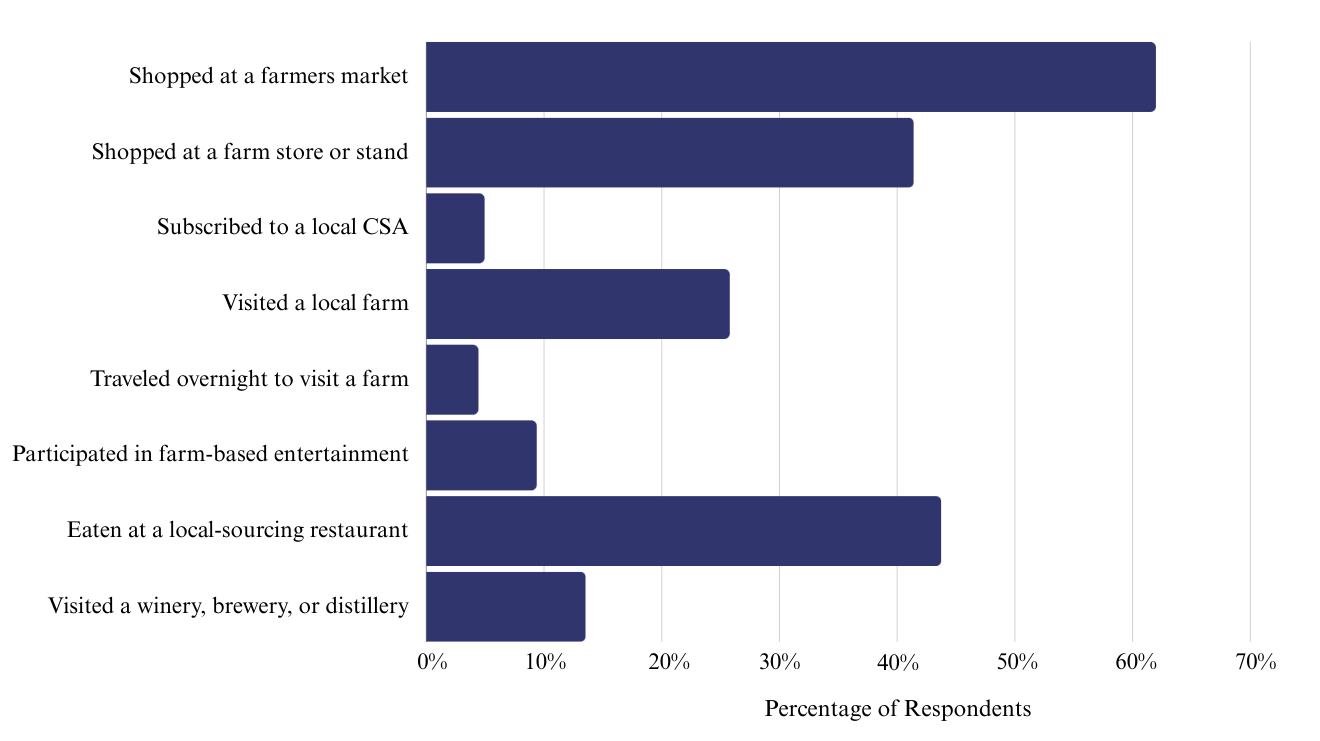
When questioned about their participation in food and agriculture-related tourism activities in the last year, the most common activity was shopping at a farmers market (see Figure 2). Almost two-thirds (62%) of those surveyed reported shopping at a farmers market in the past year. The second most common activity was eating at a local-sourcing restaurant (43%), followed by visiting a farm store
or stand (42%). The least common activity among those surveyed was traveling overnight to visit a farm. Although 26% of the respondents reported visiting a farm in the past year, only 4.5% indicated they had traveled overnight. It’s likely that the farms visited were close enough for a day trip and did not require extensive traveling.
Fruit Consumption
Many respondents (73%) reported that they consume fruit or fruit-based products at least several times each week. Apples were consumed the most, with 84% of respondents indicating that they consume apples at least monthly (see Figure 3). Strawberries, bananas, and grapes were each selected by more than 70% of respondents, and peaches, raspberries, oranges, and blueberries were selected by more than half of the respondents.
Figure 3. Fruits Consumed Regularly (at Least Monthly)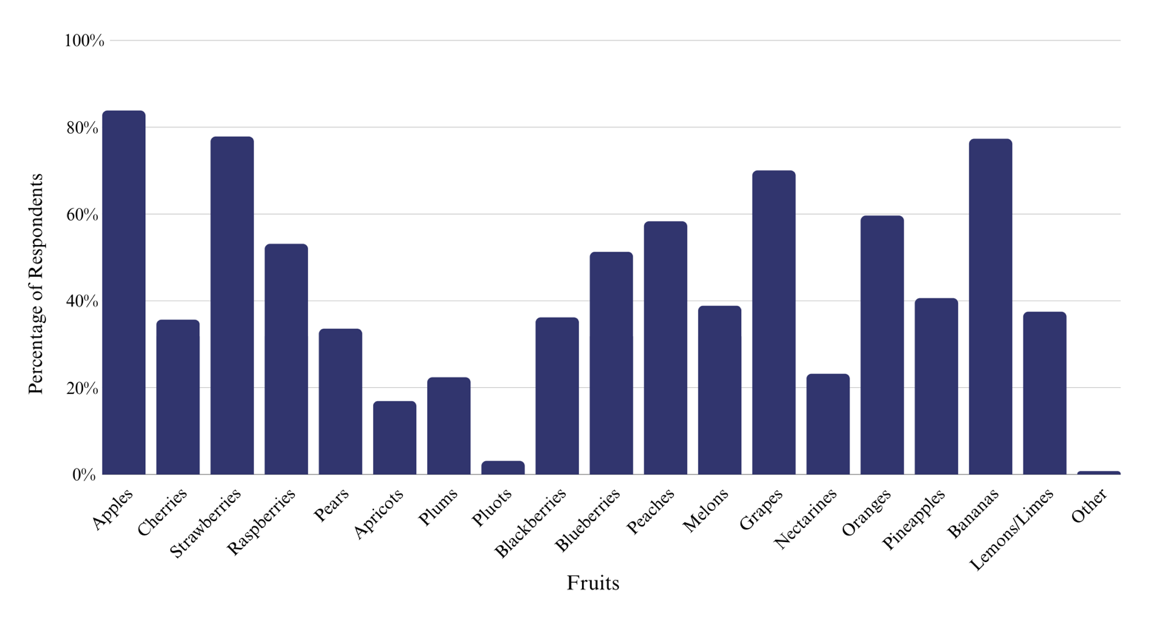
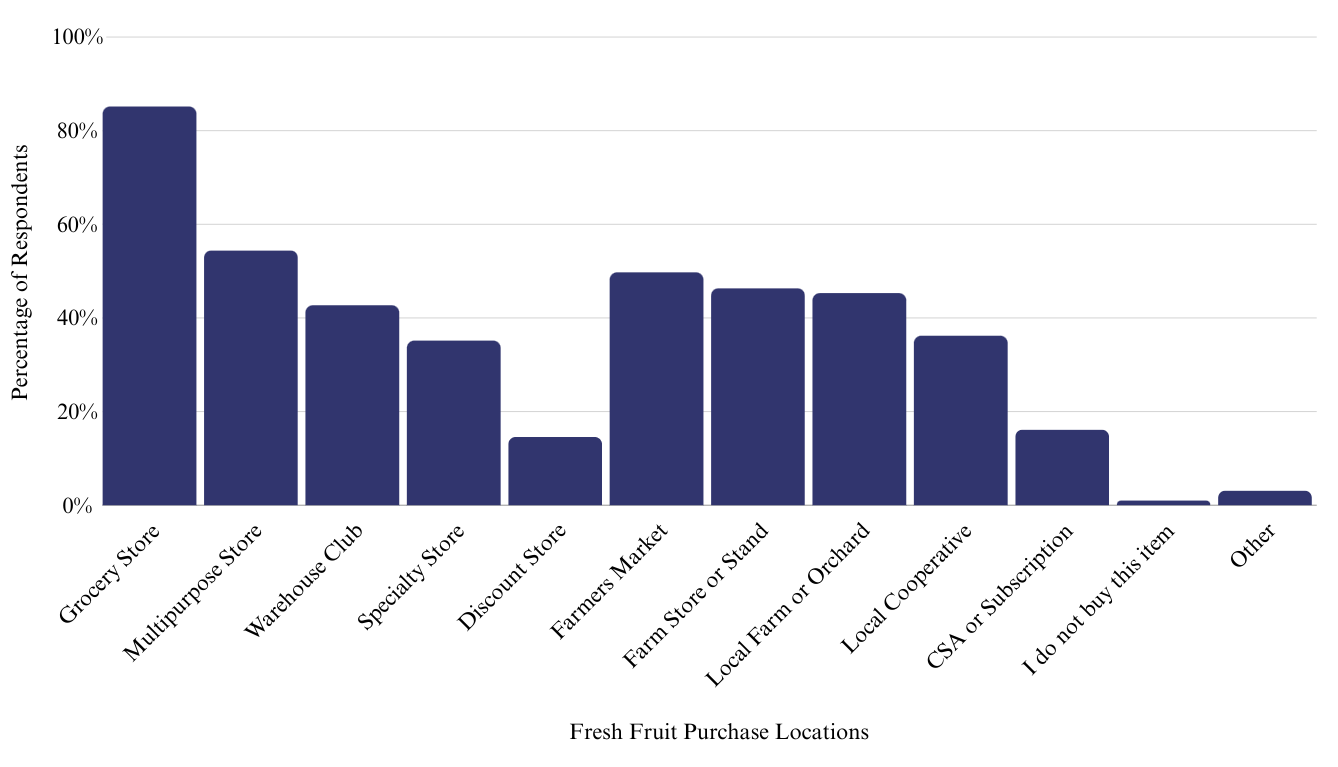
Respondents primarily purchase fruit products at traditional grocery stores such as Winco or Smith’s. For most fruit types, the second most common purchase location was multipurpose stores such as Walmart or Target. Fresh fruit was also commonly purchased at other venues such as farmers markets, farm stands, or local farms (see Figure 4). Value-added or processed fruit products such as canned, frozen, or dehydrated fruit were not frequently purchased outside of traditional grocery stores.
Figure 4. Fresh Fruit Purchase Location
Factors Important in Purchase Decisions
When asked what attributes they consider when purchasing fruit products, more than 80% of the respondents indicated that they consider product taste, price, and freshness (see Figure 5). Appearance was also valued by more than half of the respondents, followed by color, nutritional value, size, and locally grown. Organic was ranked nine, followed by texture and variety. The least favored attributes were tree-ripened and fair trade, both specialty labelling programs, although not examined in this study.
Figure 5. Product Attributes Considered in Purchase Decisions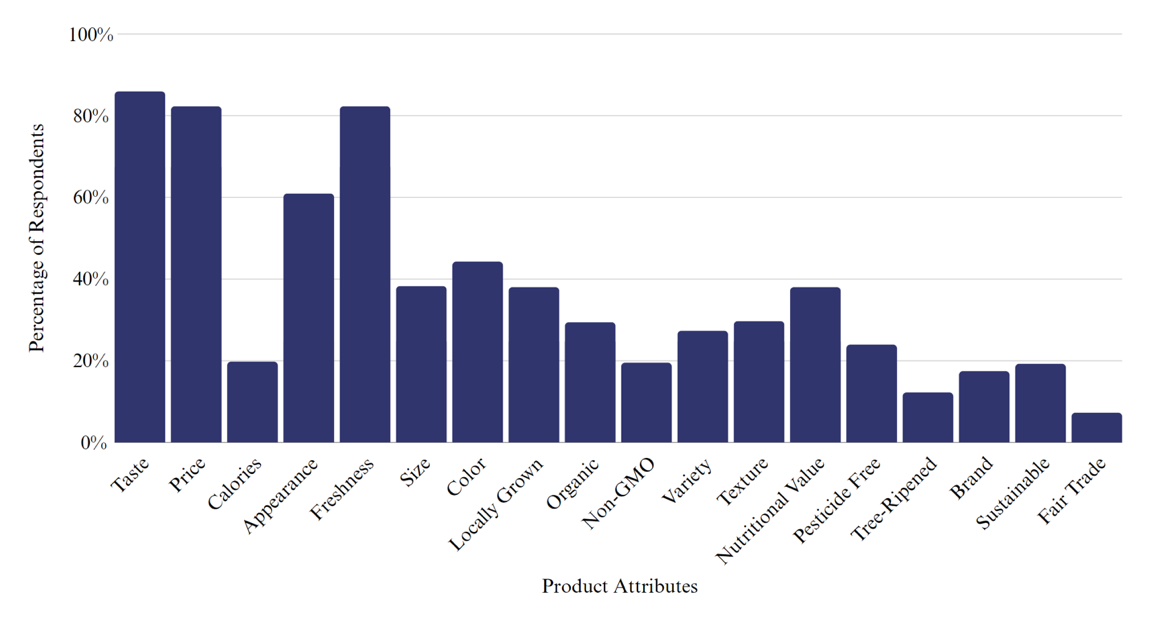
Additionally, survey respondents were asked what product and/or packaging information they refer to when making a purchase (see Table 2). The respondents’ most reported answer was “sometimes.” Package size was always or almost always referenced at purchase by just over half of the respondents (51%), followed by the Nutrition Facts panel and ingredient list (36% each). Half of the respondents (50%) indicated they never refer to allergen information. This was not surprising as 55% of respondents indicated they have no food allergies or restrictions.
| Information type | Never | Sometimes | Half the time | Almost always | Always |
|---|---|---|---|---|---|
| Nutrition Facts panel (back) | 13.80% | 36.72% | 13.54% | 20.83% | 15.10% |
| Ingredient list (back) | 12.76% | 38.80% | 12.76% | 20.57% | 15.10% |
| Serving size | 21.88% | 33.07% | 14.58% | 18.23% | 12.24% |
| Package size | 7.55% | 26.56% | 14.32% | 29.43% | 22.14% |
| Allergy warnings | 50.52% | 20.31% | 6.25% | 10.68% | 12.24% |
| Front labels (GMO-free, heart healthy, organic, low-fat, etc.) |
20.05% | 33.07% | 13.54% | 17.45% | 15.89% |
Conclusions
Fruit production significantly contributes to Utah’s economy, with tart cherries as the largest crop by value, and cherries and apples second in acreage and production. Local fruit production offers fresher, more flavorful produce, shorter supply chains, decreased emissions, farmland preservation, and higher profits for growers. Consumers prioritize freshness, flavor, and price, favoring traditional grocery stores for most purchases, but often purchase fresh fruit at local farmers markets or stands. When buying fruit, consumers consider package size, nutrition facts, and ingredients, with less emphasis on allergy warnings. Additionally, many engage in food and agriculture-related tourism, often shopping at farmers markets. This information allows fruit producers to align their efforts with consumer preferences and behaviors, enhancing their competitiveness and effectively meeting market demands.
Acknowledgements
This material is based upon work that is supported by the National Institute of Food and Agriculture, U.S. Department of Agriculture, under award number 2020-38640-31523 through the Western Sustainable Agriculture Research and Education program under project number SW21-923. USDA is an equal opportunity employer and service provider. Any opinions, findings, conclusions, or recommendations expressed in this publication are those of the author(s) and do not necessarily reflect the view of the U.S. Department of Agriculture.
References
- Bateman, M. (2020). Insight: New 2020 census urban areas released [Blog post]. Gardner Policy Institute, University of Utah. https://gardner.utah.edu/blog/blog-new-2020-census-urban-areas-released/
- Cappelli, L., D’Ascenzo, F., Ruggieri, R., & Gorelova, I. (2022). Is buying local food a sustainable practice? A scoping review of consumers’ preference for local food. Sustainability, 14(2), 772. https://doi.org/10.3390/su14020772
- Doyle, D. (2021). Utah’s fruit way: Find local, fresh fruit along highway 89. Utah Office of Tourism. https://www.visitutah.com/Articles/utahs-fruit-way-highway-89
- Dumont, A. (2017, December 5). The economic impact of locally produced food. Federal Reserve Bank of St. Louis. https://www.stlouisfed.org/on-the-economy/2017/december/economic-impact-locally-produced-food
- Klavinski, R. (2013, April 13). 7 benefits of eating local foods. Michigan State University Extension. https://www.canr.msu.edu/news/7_benefits_of_eating_local_foods
- McCurdy, M. (2022, May 17). Health benefits of eating locally [Fact sheet]. University of New Hampshire Extension; https://extension.unh.edu/blog/2022/05/health-benefits-eating-locally
- National Agricultural Statistics Service (NASS). (2022). Census of agriculture for Utah, Specified fruits and nuts by acres: 2022 and 2017. U.S. Department of Agriculture. https://www.nass.usda.gov/Publications/AgCensus/2022/Full_Report/Volume_1,_Chapter_1_State_Level/Utah/st49_1_037_037.pdf
- NASS. (2023). 2023 state agriculture overview - Utah. U.S. Department of Agriculture. https://www.nass.usda.gov/Quick_Stats/Ag_Overview/stateOverview.php?state=UTAH
- O’Donoghue, A. J. (2023, July 28). Tart cherry production: Little tasty fruit is grown big time in Utah. Deseret News. https://www.deseret.com/2023/7/28/23809958/utah-county-tart-cherry-production-tasty-fruit-utah-agriculture-cherry-marketing-institute
July 2024
Utah State University Extension
Peer-reviewed fact sheet
Authors
Makaylie Langford, USU Extension Intern, Department of Applied Economics
Kynda Curtis, Professor and USU Extension Specialist, Department of Applied Economics
Marcelo Pignatari, Graduate Research Assistant, Department of Applied Economics

Kynda Curtis
Food Systems Specialist
APEC Dept