Using Degree Days to Time Treatments for
Insect Pests
March 2020
Marion Murray, Extension IPM Specialist
Insecticides that are applied for a perennial insect pest based on a calendar date often result in poor insect control and a waste of resources. Insect activity varies from year to year depending on weather. For example, in Logan, Utah, eggs of the apple pest codling moth began hatching on May 15 in 2005, May 5 in 2006, and April 30 in 2007. If apple growers always spray on May 1, they are not making the most effective insecticide treatment in most years. As long as accurate weather data can be obtained, using degree days to time treatments is more reliable than a calendar date and allows growers to pinpoint a specific treatment date each year.
Degree days (often referred to as “growing degree days”) are accurate because insects have a predictable development pattern based on heat accumulation. Insects are exothermic (“cold-blooded”) and their body temperature and growth are affected by their surrounding temperature. Every insect requires a consistent amount of heat accumulation to reach certain life stages, such as egg hatch or adult flight. Degree day values interpret that heat accumulation. When used to determine treatment timing, they are an important component of an Integrated Pest Management program, providing a cost effective tool to reduce insect feeding damage.
Calculating Degree Days
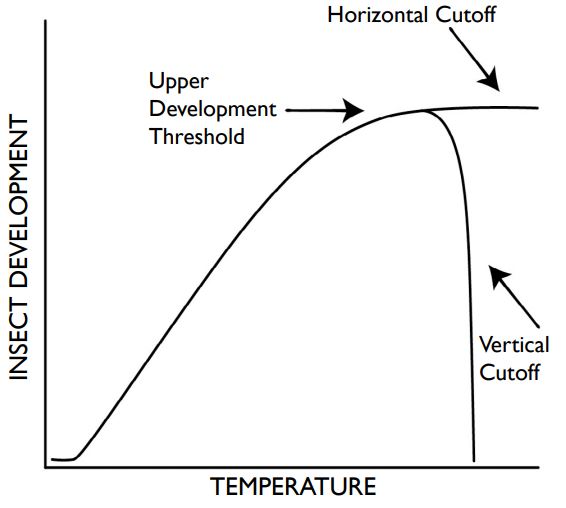
Simply put, a degree day (DD) is a measurement of heat units over time, calculated from daily maximum and minimum temperatures. Degree days are based on the rate of an insect’s development at temperatures between upper and lower limits for development (see Figure 1). The minimum temperature at which insects first start to develop is called the “lower developmental threshold”, or baseline. The maximum temperature at which insects stop developing is called the “upper developmental threshold,” or cutoff. The lower and upper thresholds vary among species, and have been determined for many, but not all, major insect pests. For those whose exact values are unknown, including most landscape insect pests, a baseline temperature of 50˚F is used. Some insects do not have an upper development threshold.
Although degree days are usually calculated for a 24-hour time period, it is the number of accumulated degree days from a starting point, called a biofix, that is most useful. The biofix can be a biological event, such as the date at which moth flight begins, or a calendar date, such as March 1. In northern Utah, we start accumulating degree days for insect pests, such as codling moth, that have a baseline of 50˚F on March 1, because there is typically no insect development before that time.
No matter how it is calculated, the degree day value for a 24-hour period is added to the prior day’s values, and so on. For an average growing season in northern Utah, areas will accumulate approximately 2500-3500 degree days (with a baseline of 50˚F).
Average Method
In general, degree days can be calculated using a simple formula for the average daily temperature, calculated from the daily maximum and minimum temperatures, minus the baseline (lower developmental threshold):
[(daily maximum temperature + daily minimum temperature)/2] – baseline temperature
For example, a day where the high is 72˚F and the low is 44˚F would accumulate 8 degree days using 50˚F as the
baseline:
Example 1: [(72 + 44)/2] – 50 = 8
When temperatures do not exceed 50, zero degree days have accumulated. This calculation method is the simplest and least precise.
Modified Average Method
The problem with the average method is that it does not take into account the length of time that the daily temperature may exceed the baseline temperature. In Example 1, results could be skewed if the minimum temperature of 44˚ F occurred for only 30 minutes out of the 24-hour day while the rest of the time the temperature was above 50˚ F. Given this, the accumulated degree days using the above calculation would be less than the actual value. To account for situations when the daily minimum temperature is less than the baseline, or the daily maximum temperature is greater than the cutoff, the formula needs to be modified. When either occurs, the lower threshold is used instead of the daily minimum, or the upper threshold is used instead of the maximum. For the above example, we would use 50˚F as the daily minimum temperature in the formula instead of 44˚F:
Example 2: [(72 + 50)/2] – 50 = 11
And for a day with a maximum temperature of 102˚F, and a low of 70˚F, we would replace the 102 with the upper threshold temperature, if known. We know that it is 88˚F for codling moth, so the degree days would be:
Example 3: [(88+70)/2] – 50 = 29
Sine Wave Method
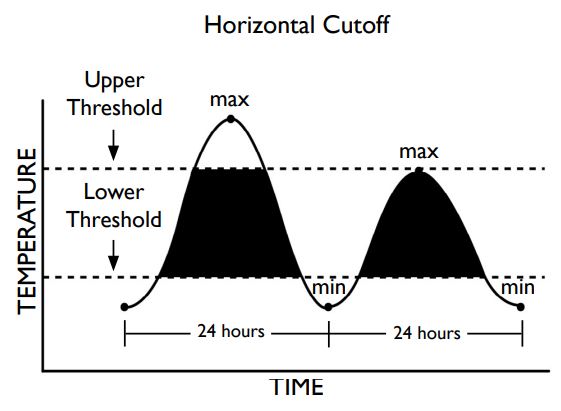
A more precise and method of calculating degree days is called the sine wave method. This method still uses the daily minimum, maximum, and baseline temperatures (lower threshold), but also incorporates the upper threshold temperature into the calculation. It is based on the assumption that temperatures of a 24-hour day follow a sine wave curve. The number of degree days is then calculated as the area under this curve within the lower and upper temperature thresholds (see Figure 2).
Because of the somewhat complicated calculus involved, the sine wave formula is not shown here. Degree days calculated using this method are usually determined by a computer.
The most widely used insect model in Utah is for codling moth (see Table 3). For this pest, it is important to know when 220 degree days after biofix will occur, because this point corresponds to first generation egg hatch, when fruit should begin to be protected.
Using Degree Days
Scouting
Accumulated degree days are useful in timing scouting events such as when to place traps, when to look for damage, when to sample, etc. As an example, codling moth pheromone monitoring traps are placed in the apple orchard at 100 degree days after March 1 in northern Utah to determine initiation of adult moth flight.
Using Insect Models
Scientists have studied biological development over time (phenology) of insects in correlation to accumulated degree days, discovering information on key physiological events, such as egg hatch, adult flight, etc. This predictive information is known as an insect model. Insect models are useful in timing insecticide treatment because the entire life cycle (or certain important events) of the insect is known. Models have been developed for a number of insect pests (see Table 1).
Predicting Treatment Timing
With the development of more targeted, reduced risk insecticides, timing of application is becoming more and more important. Certain life stages of insects are more susceptible to insecticide treatment such as young larvae or scale crawlers. Degree days are used to predict when those life stages will occur (see Table 2). Degree days are “projected” into the future for a given site using either forecasted daily highs and lows or 30-year average highs and lows. This information is only an approximation of a future event, but is highly useful in planning.
Table 1. A partial list of insect pests that occur in Utah for which we have temperature thresholds and degree day models.
| Target Insect | Lower Developmental Threshold (F) | Upper Developmental Threshold (F) | Availability of Model | |
| Common Name | Scientific Name | |||
| Alfalfa Weevil | Hypera postica | 50 | 87 | yes |
| Armyworm | Pseudaletia unipuncta | 50 | 84 | yes |
| Black cutworm | Agrotis ipsilon | 50 | 86 | yes |
| Cabbage maggot | Agrotis ipsilon | 40 | 86 | yes |
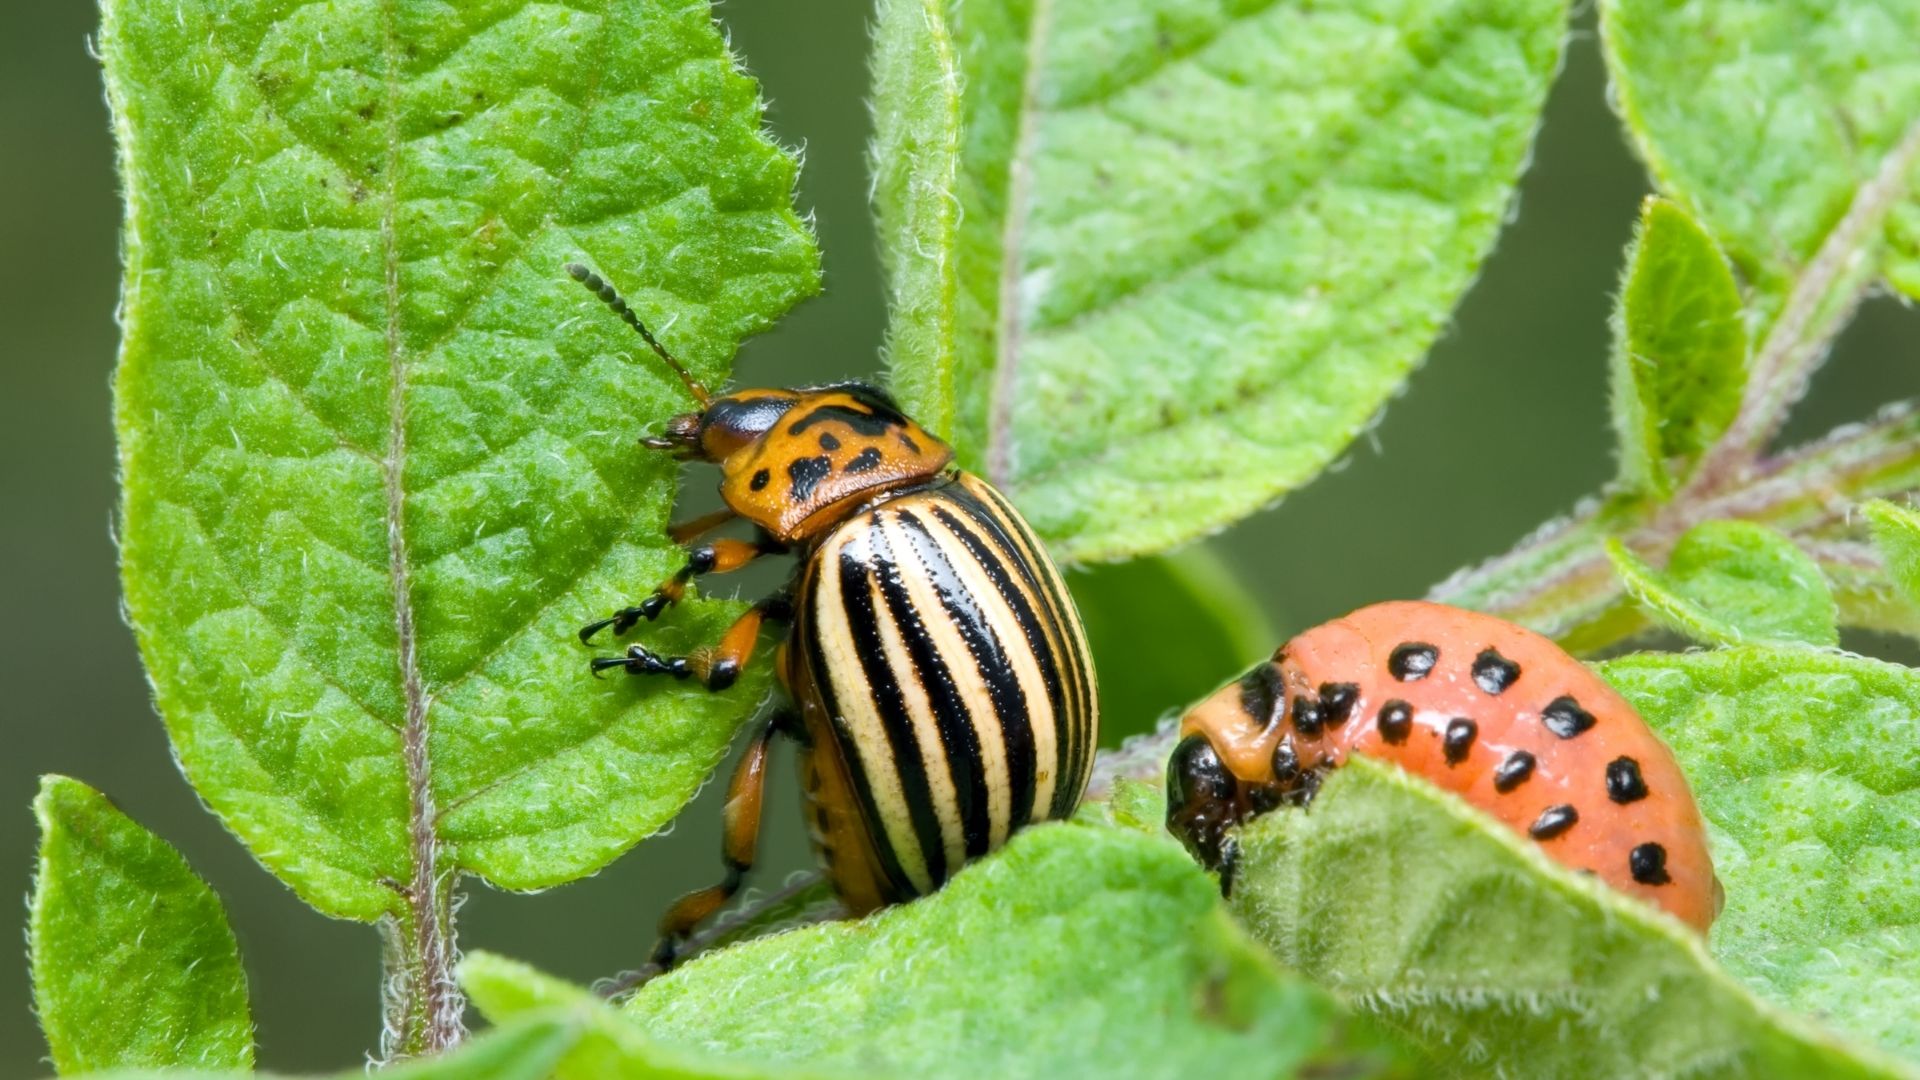
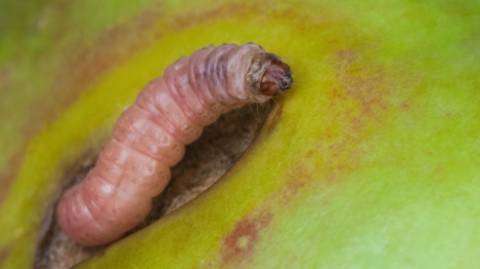
| Codling moth* | Cydia pomonella | 50 | 88 | yes |
| Corn earworm* | Helicoverpa zea | 55 | 92 | yes |
| European pine shoot moth | Rhyacionia bouliana | 28 | --- | yes |
| European red mite | Panonychus ulmi | 51 | --- | yes |
| Greater peachtree borer | Synanthedon exitiosa | 50 | 87 | no |
| Lilac/ash borer* | Podosesia syringae | 50 | --- | yes |
| Obliquebanded leafroller* | Choristoneura rosaceana | 43 | 85 | yes |
| Peach twig borer* | Anarsia lineatella | 50 | 88 | yes |
| Pear psylla | Cacopsylla pyricola | 41 | --- | no |
| San Jose scale* | Quadraspidiotus perniciosus | 51 | 90 | yes |
| Strawberry root weevil | Otiorhynchus ovatus | 40 | 103 | yes |
| Variegated cutworm | Peridroma saucia | 45 | 80 | yes |
| Walnut husk fly* | Rhagoletis completa | 41 | 130 | yes |
| Western cherry fruit fly* | Rhagoletis indifferens | 41 | 130 | yes |
*Insect model has been validated for Utah
Threshold and model information from UC-Davis IPM (Models: Insects, Mites, Diseases, Plants, and Beneficials)
Table 2. A partial list of degree day (GDD) accumulations for selected landscape pests that occur in Utah. “DD Min” is the
earliest timing for appearance, and “DD Max” is the latest timing.
| Common Name | Scientific Name | Lower Developmental Threshold (F) | Upper Developmental Threshold (F) | Availability of Model |
| Black pineleaf scale | Dynaspidiotus californica | E | 1068 | --- |
| Bronze birch borer | Agrilus anxius | A | 440 | 800 |
| Cankerworms | Alsophila sp. | L | 148 | 290 |
| European fruit lecanium scale | Parthenolecanium corni | C | 800 | --- |
| European pine shoot moth | Rhyacionia bouliana | L A E |
50 700 900 |
220 800 1000 |
| Honeylocust plant bug | Diaphnocoris chlorionis | N, A | 58 | 246 |
| Lilac/Ash borer | Podosesia syringae | L | 148 | 299 |
| Lilac root weevil | Otiorhynchus meridionalis | A | 500 | 950 |
| Locust borer | Magacyllene robiniae | L, A | 2271 | 2805 |
| Oystershell scale | Lepidosaphes ulmi | C C |
363 1600 |
707 1700 |
| Pine needle scale | Chionaspis pinifoliae | C C |
298 1388 |
448 1917 |
| Spruce spider mite | Oligonychus ununguis | E, L E, L, A E, L, N, A |
7 192 2375 |
121 363 2806 |
| Western tent caterpillar | Malacosoma californicum | L | 100 | 500 |
| Western spruce budworm | Choristoneura occidentalis | L | 200 | 300 |
*E (eggs), N (nymph), C (crawler), L (larvae), A (adults)
Degree day values determined by: Dr. Warren T. Johnson, Department of Entomology, Cornell University.
Table 3. Example of an insect model for codling moth showing method of calculation and degree days required for development.
Development Thresholds (Lower: 50 F, Upper: 88 F)
Calculation Method: Single Sine
Cutoff Method: Horizontal
Set out Traps: 100 DD after March 1
Biofix: First consistent (2+ in a single trap) catch of adults in the pheromone trap
| Event | Degree Days |
| Generation Time (egg to egg) | 880 |
| Generation Time (50% egg hatch to same) | 1096 |
| 1% egg hatch (1st gen) | 220 |
| 20% egg hatch (1st gen) | 484 |
| 75% egg hatch (1st gen) | 610 |
| 95% egg hatch (1st gen) | 800 |
| 5% adult emergence (2nd gen) | 1000 |
| 7% egg hatch (2nd gen) | 1260 |
| 30% egg hatch (2nd gen) | 1460 |
| 50% egg hatch (2nd gen) | 1580 |
| 75% egg hatch (2nd gen) | 1750 |
| 95% egg hatch (2nd gen) | 2000 |
Obtaining Degree Days
Whether you are calculating your own degree days, or using information from an instrument or Web site, it is important to know how the degree days were calculated for the target insect, and that your calculation method matches, or is modified to match. There are a variety of ways to acquire degree days:
- To calculate your own degree days, you will need a thermometer that records maximum and minimum temperatures in a location that closely matches the temperatures that your target pest(s) would encounter. Max-Min thermometers are inexpensive, easily available, and record in digital or mercury. Some digital models will store up to seven days of readings. The thermometer should be calibrated at the start of each season, and placed away from direct sunlight, ideally in a white shelter box. Obtain degree days in one of the following ways:
- Calculate them daily using the average or modified average method.
- Use a degree day look-up table. Degree day values for high and low temperatures are available for certain insects in a look up table (see Table 4 for example).
- Enter daily maximum and minimum temperatures into a computer spreadsheet that is set up to calculate the values.
- Biophenometers are instruments that calculate degree days every few minutes based on temperatures and are highly accurate. Many brands allow you to manually input the target pest’s upper and lower thresholds. They can be purchased as a stand-alone, or in conjunction with a weather station. Minor setbacks include price ($300-$1000), and the fact that the instruments’ degree day calculation method provides different results than the modified sine wave method. Typically, the degree days that researchers determined for insect models were calculated using the sine wave method, so values calculated from the biophenometers would be slightly less. They may need to be compared to the values from the sine calculation for one season and readjusted accordingly.
- USU Extension Pest Advisories provide accumulated and predicted degree days for a variety of sites across northern Utah. Your local county Extension office can also help you with this information.
- An Internet search for “degree day calculator” can often turn up sites where you can enter your own data, or select a location.
Limitations of Degree Days
The primary limiting factor in using degree days is obtaining accurate temperature readings. If a thermometer, biophenometer, or weather station location is not representative of the environment in which the target insect occurs, the resultant degree days will not mirror the actual insect development. In addition, temperatures at one site may not be reflective of conditions in another site several miles away. This is particularly true of Utah, where mountains, lakes, and deserts result in a wide variety of microclimates.
Table 4. Example of a degree day look-up table for peach twig borer and codling moth (base 50°F) (not a complete table)
| Minimum temperature (˚F) | |||||||||||||
| Maximum Temperature (˚F) | 48 | 51 | 54 | 57 | 60 | 63 | 66 | 69 | 72 | 75 | 78 | 81 | |
| 52 | 1 | 2 | |||||||||||
| 58 | 2 | 3 | 5 | ||||||||||
| 61 | 5 | 6 | 8 | 9 | 11 | ||||||||
| 64 | 6 | 8 | 9 | 11 | 12 | 14 | |||||||
| 70 | 9 | 11 | 12 | 14 | 15 | 17 | 18 | 20 | |||||
| 73 | 11 | 12 | 14 | 15 | 17 | 18 | 20 | 21 | 23 | ||||
| 76 | 12 | 14 | 15 | 17 | 18 | 20 | 21 | 23 | 24 | 26 | |||
| 79 | 14 | 15 | 17 | 18 | 20 | 21 | 23 | 24 | 26 | 27 | 29 | ||
| 82 | 15 | 17 | 18 | 20 | 21 | 23 | 24 | 26 | 27 | 29 | 30 | 32 | |
| 85 | 17 | 18 | 20 | 21 | 23 | 24 | 26 | 27 | 29 | 30 | 32 | 33 | |
| 88 | 18 | 20 | 21 | 23 | 24 | 26 | 27 | 29 | 30 | 32 | 33 | 35 | |
| 91 | 19 | 21 | 22 | 24 | 25 | 27 | 28 | 30 | 31 | 32 | 34 | 35 | |
Glossary
Baseline: Equivalent to “lower developmental threshold.”
Biofix: A date that signals the start of growing degree day accumulations (“biological fix”). The date can be represented by a biological event, such as first moth flight, or a calendar date.
Degree days: A measurement of heat units over time, equivalent to the number of degrees that the average temperature is above a baseline value. Also known as “growing degree days” (GDD) to differentiate this value from “heating degree days” or “cooling degree days,” which are used to estimate energy demand.
GDD (50), DD (50), GDD50, DD50, DD (base 50), etc: Terminology used to describe a value of degree days, using 50° F as the baseline temperature. Lower Developmental Threshold: A temperature at which insect development begins (also known as “baseline”); determined by laboratory studies.
Phenology: The study of periodic biological events, such as plant flowering, insect development, etc., in relation to environmental factors, such as temperature (translated as: “knowledge of phenomena”).
Upper Developmental Threshold: A maximum temperature of insect development where development levels off or slows down; determined by laboratory studies.
Related Research
Springtime, while grasshoppers are still nymphs, is the best time for communities or neighborhoods to work together to suppress grasshopper populations. Treating as wide an area as possible is the key to success. When grasshoppers become adults, they An inextricable link exists between humans and pollinators, with benefits that include ecosystem health and function and human food security. Bees, butterflies, moths, wasps, flies, and beetles are responsible for most of the world’s pollination servic Biochar is a charcoal-like product that contains no petroleum. It is made by heating biomass such as herbaceous or woody crop residues, non-salvageable timber and slash, or animal manure, in a contained system. There are many potential uses for biocha Mating disruption as a method to manage orchard pests became commercially available in the early 1990s, and was adopted by many Utah growers about a decade later. Use of this pest management technology c “Balance of Nature.” Virtually all pest populations are affected by natural enemies to some extent. In many cases, natural enemies are the primary regulating force of the pest populations. Degree days (often referred to as “growing degree days”) are accurate because insects have a predictable development pattern based on heat accumulation. Insects are exothermic (“cold-blooded”) and their body temperature and growth are affected by their su The lowest population density of a pest that will cause economic damage; or the amount of pest injury which will justify the cost of control. A short summary of the main insect and disease pests of apples and how they are managed by the backyard fruit grower. While grasshoppers are still nymphs, is the best time for communities or neighborhoods to work together to suppress grasshopper populations. Treating as wide an area as possible is the key to success Pest managers cannot afford to take a pest management action without knowing if it is economically sound. Treating a pest needlessly is not conducive to making a profit. Other values such as aesthetics of the management situation (pertinent to landscapes The term Pest Management came about in the early 1960’s, which then evolved into Integrated Pest Management (IPM). However, many aspects of IPM have been practiced since plants were first cultivated by humans. Biochar is a charcoal-like product that contains no petroleum. It is made by heating biomass such as herbaceous or woody crop residues, non-salvageable timber and slash, or animal manure, in a contained system. There are many potential uses for biochar in Codling moth, Cydia pomonella, is the key insect pest of apple, pear, and walnut throughout the world, including Utah (apple and pear). Effective management practices are based on accurate determination of the first flight of codling moths in the spring, Row covers on Utah farms. As an integrated pest management tool, row covers act as a physical barrier that prevents the movement of pests such as insects, birds, and mammals, to host plants.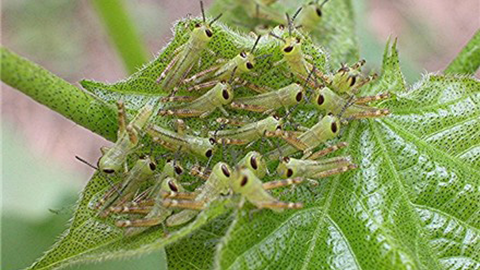
Community-Wide Grasshopper Control
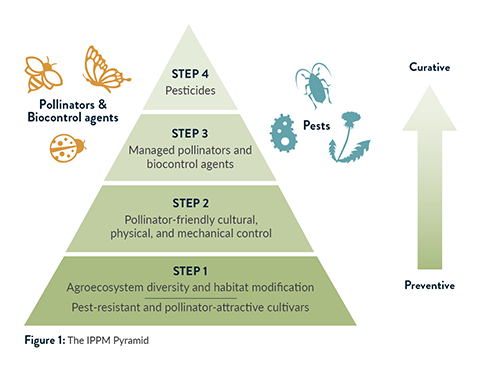
Integrated Pest and Pollinator Management
What Is Biochar and How Is It Used?
Codling Moth Mating Disruption
General Concepts of Biological Control

Using Degree Days to Time Treatments for Insect Pests

Important Components of a Successful Pest Management Program
The Backyard Orchard - Apple Pests
Community Wide Grasshopper Control

Pest Management Decision-Making: The Economic-Injury Level Concept
The Integrated Pest Management (IPM) Concept
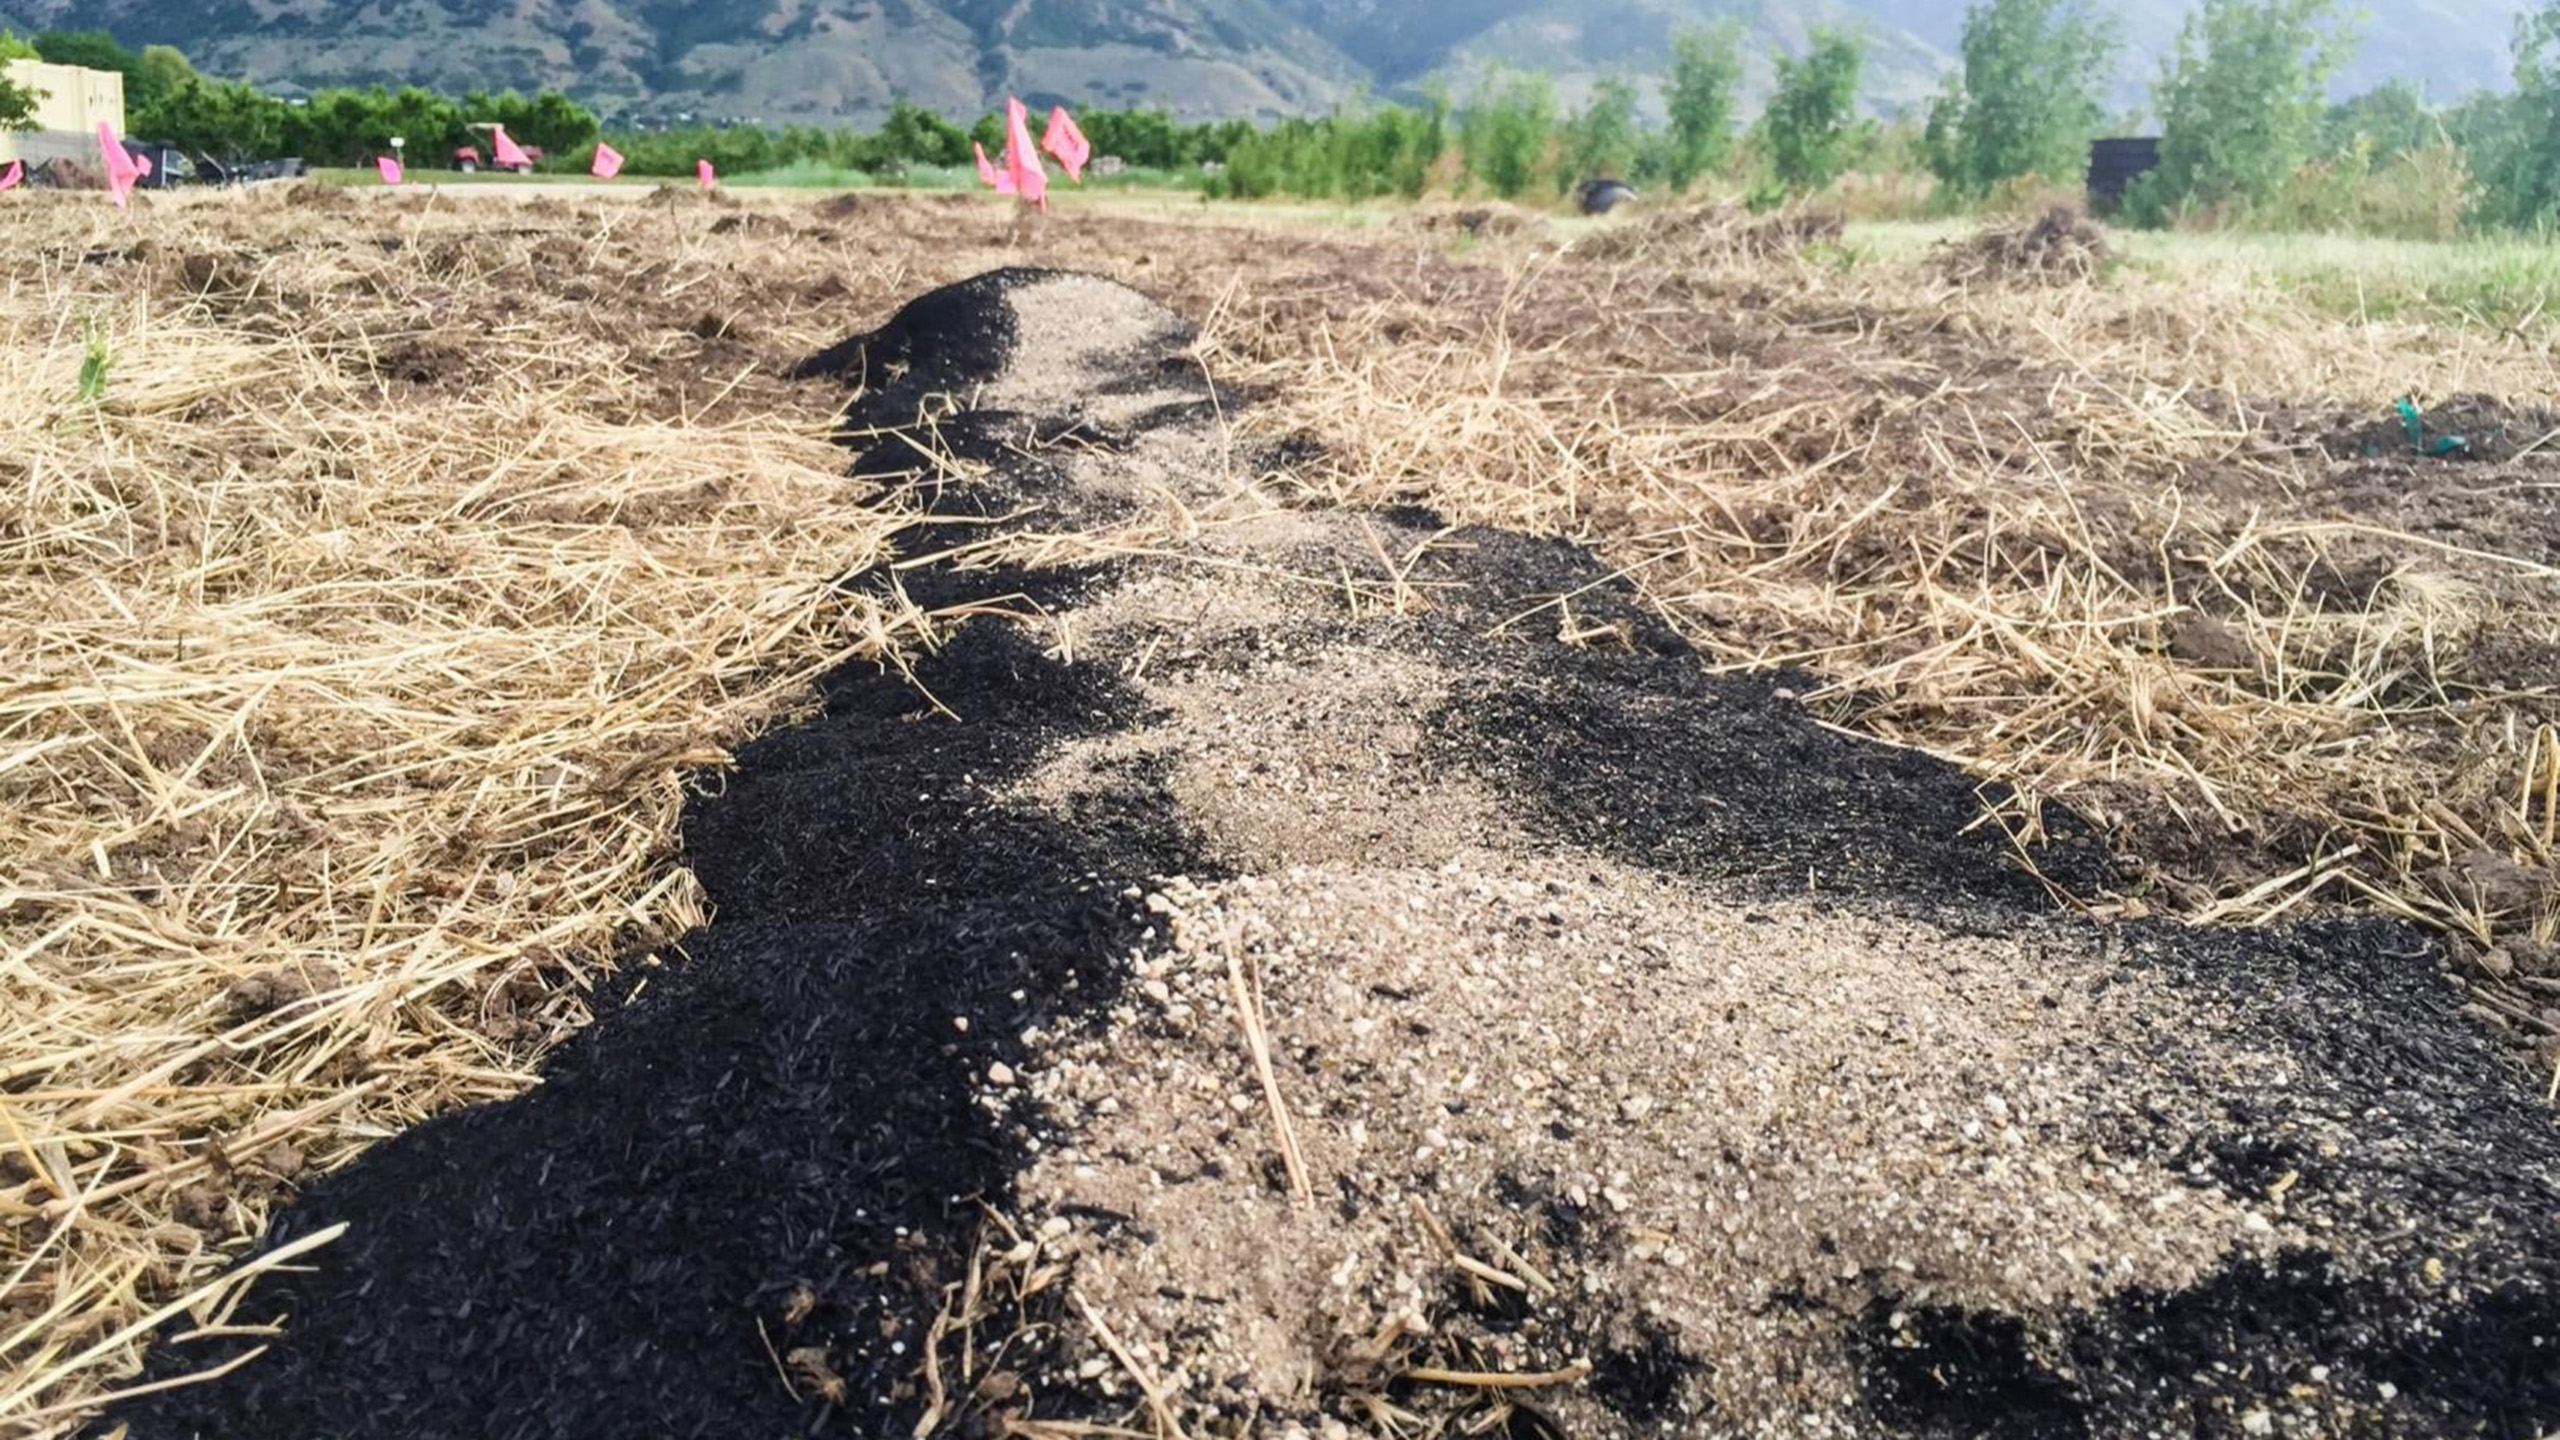
What is Biochar and How is it Used?
An Alternate Method for Setting Codling Moth Biofix
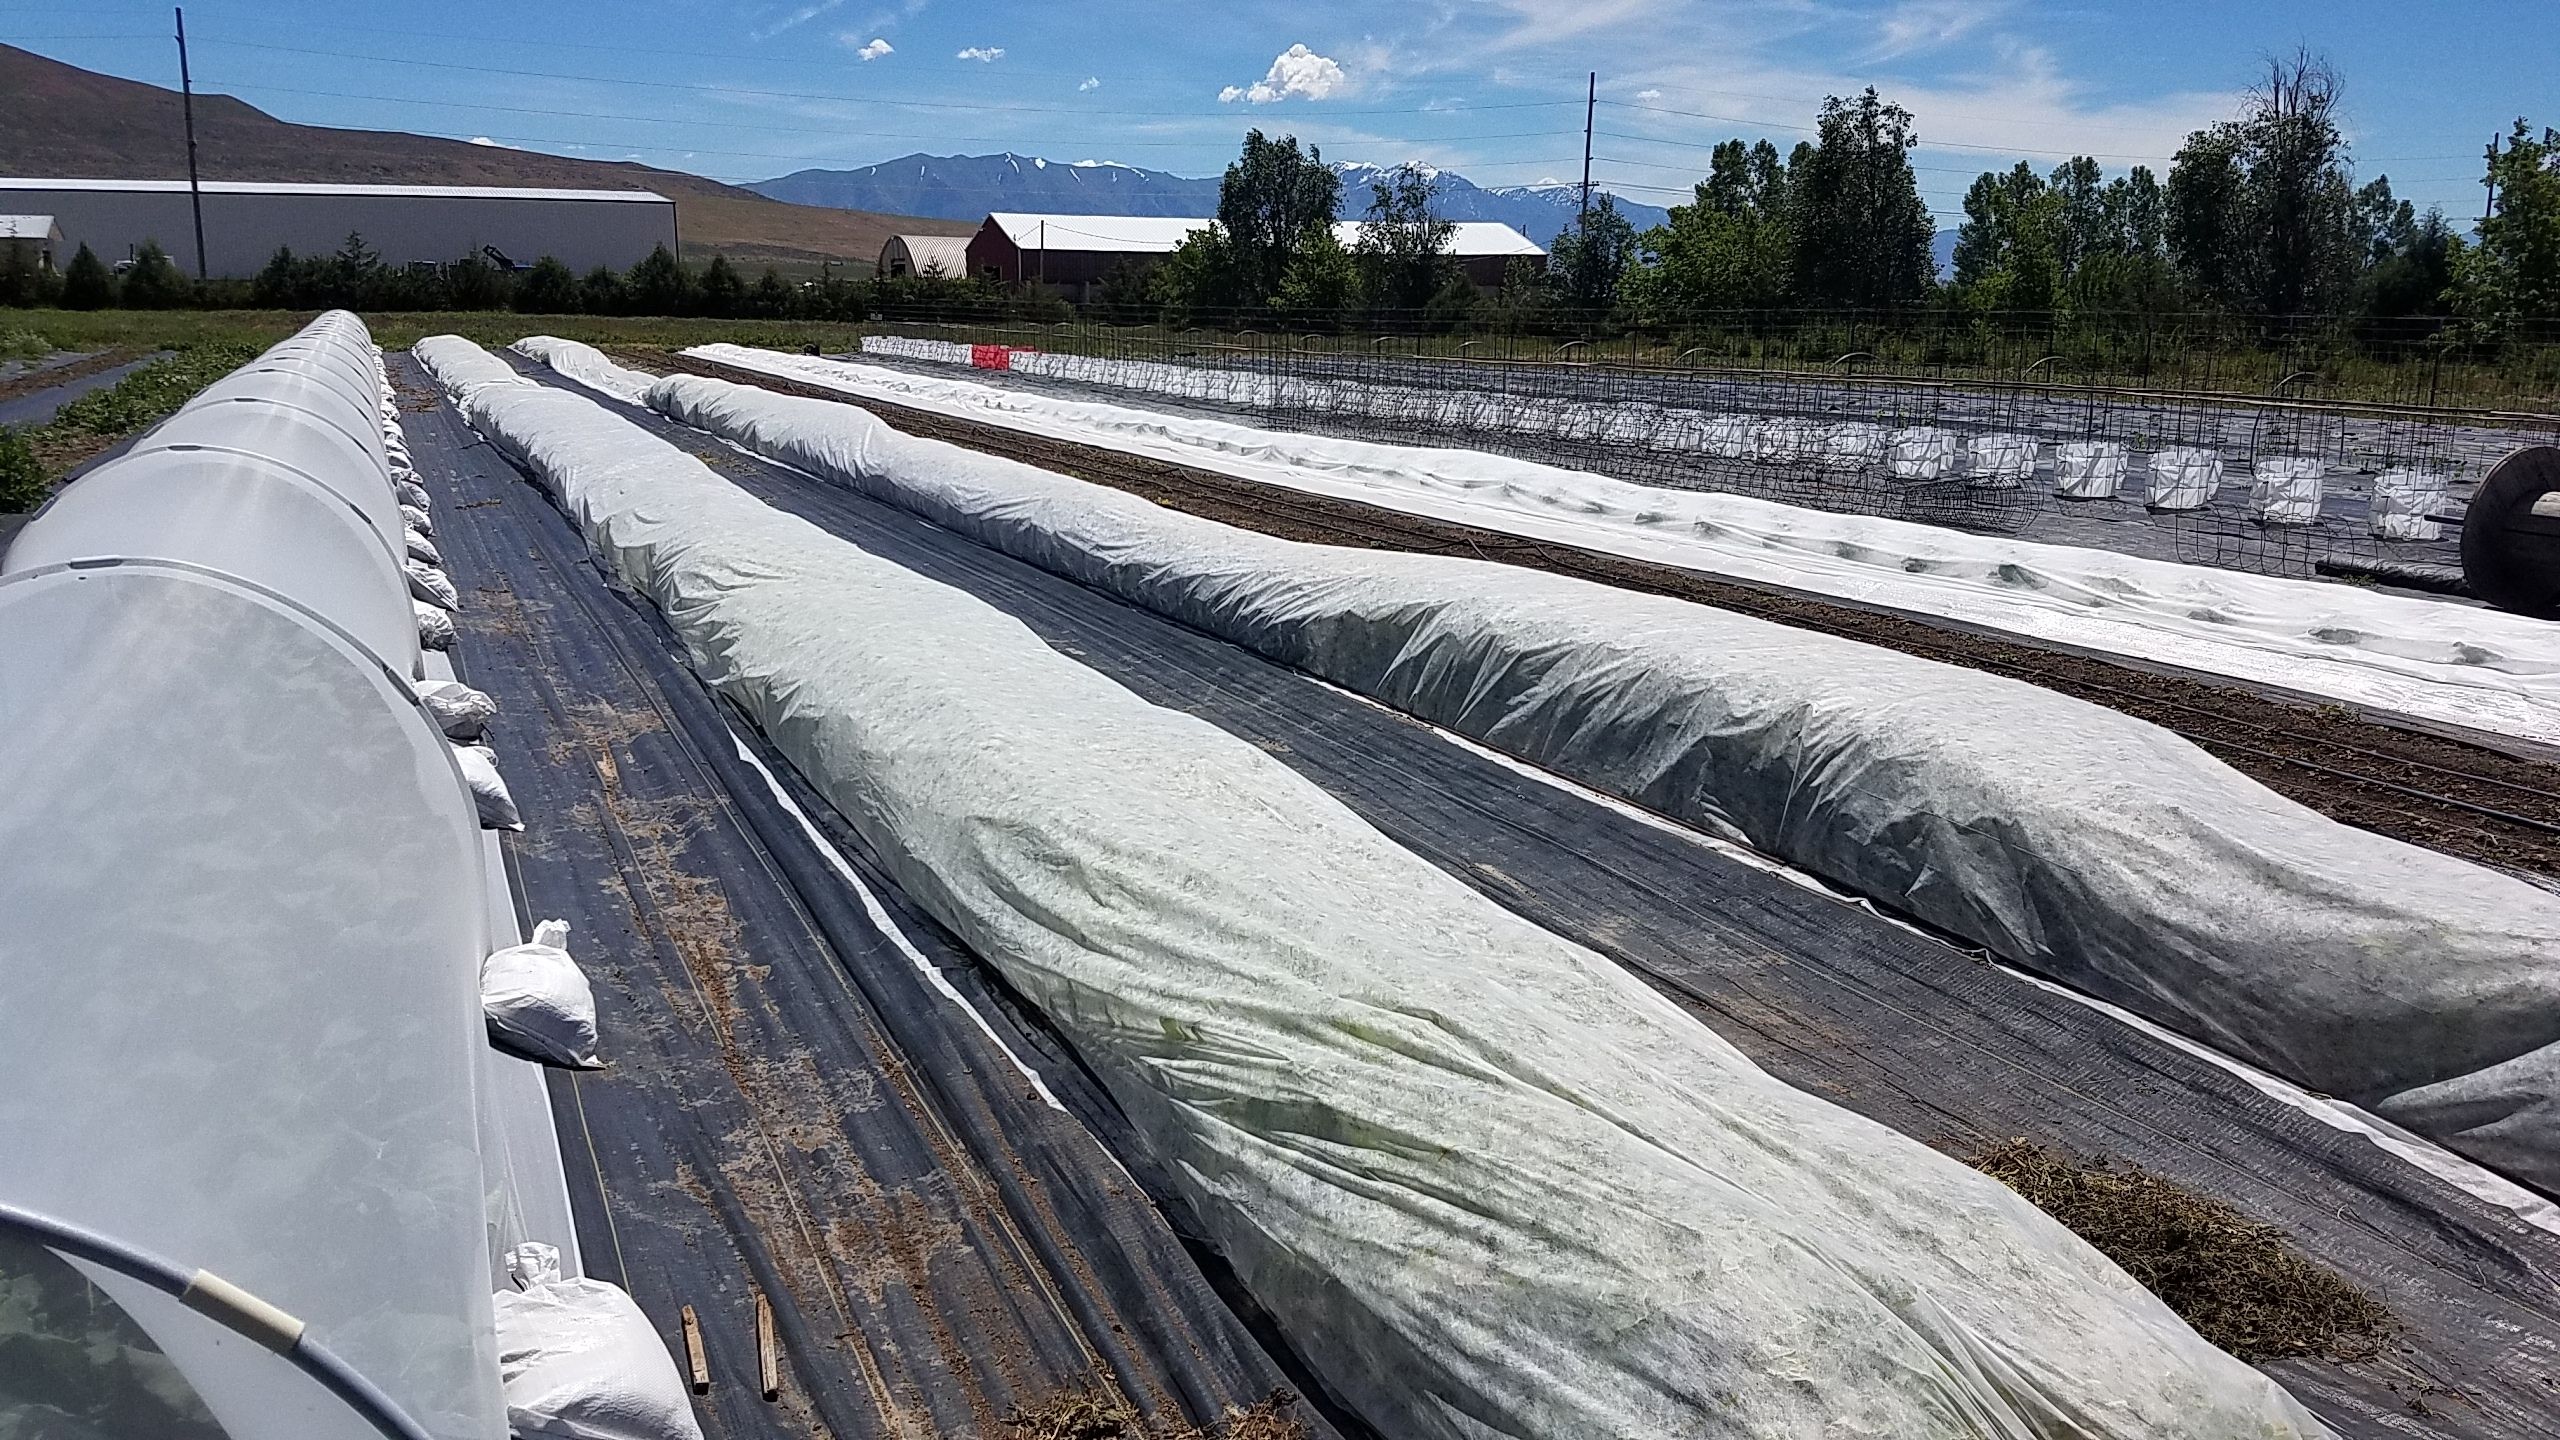
Row Covers