2016 Water Week Results

This year marks Utah Water Watch's 3rd annual Utah Water Week and was a success! A big thank you to all of the volunteers who helped make this snapshot of Utah's water quality possible. Results show generally good water quality, with only one extreme criteria exceedance of pH. See the data for yourself by downloading it from the UWW database on CitSci.org.
Some impressive Utah Water Week statistics:
Number of monitoring events/sites: 22
Total number of hours sampled by all volunteers: 24
Total miles driven: 152
Warmest air temperature sampled: 37 ºC (99 F)
Coldest air temperature sampled: 7 ºC (45 F)
Number of dead fish seen: 0
Average water temperature: 9.5 ºC
Average pH: 7.0
Average dissolved oxygen: 8.7 mg/L
Our volunteers, YOU, continue to sacrifice time and energy, sampling in extreme weather conditions for the greater good. You are making a difference and we appreciate your continued efforts!
Click on the map to enlarge and view maps and check out the link about each parameter to learn more.
Temperature

The average for all sites was 9.5 ºC (1.5 C colder than last year) with the coldest temperature of 6.0 ºC at the Weber River and the warmest temperature of 15 ºC in the Santa Clara River. Water temperature in streams should not exceed 20 ºC for cold water fisheries and 27 ºC for warm water fisheries.
To learn more go to the temperature information page.
Dissolved Oxygen
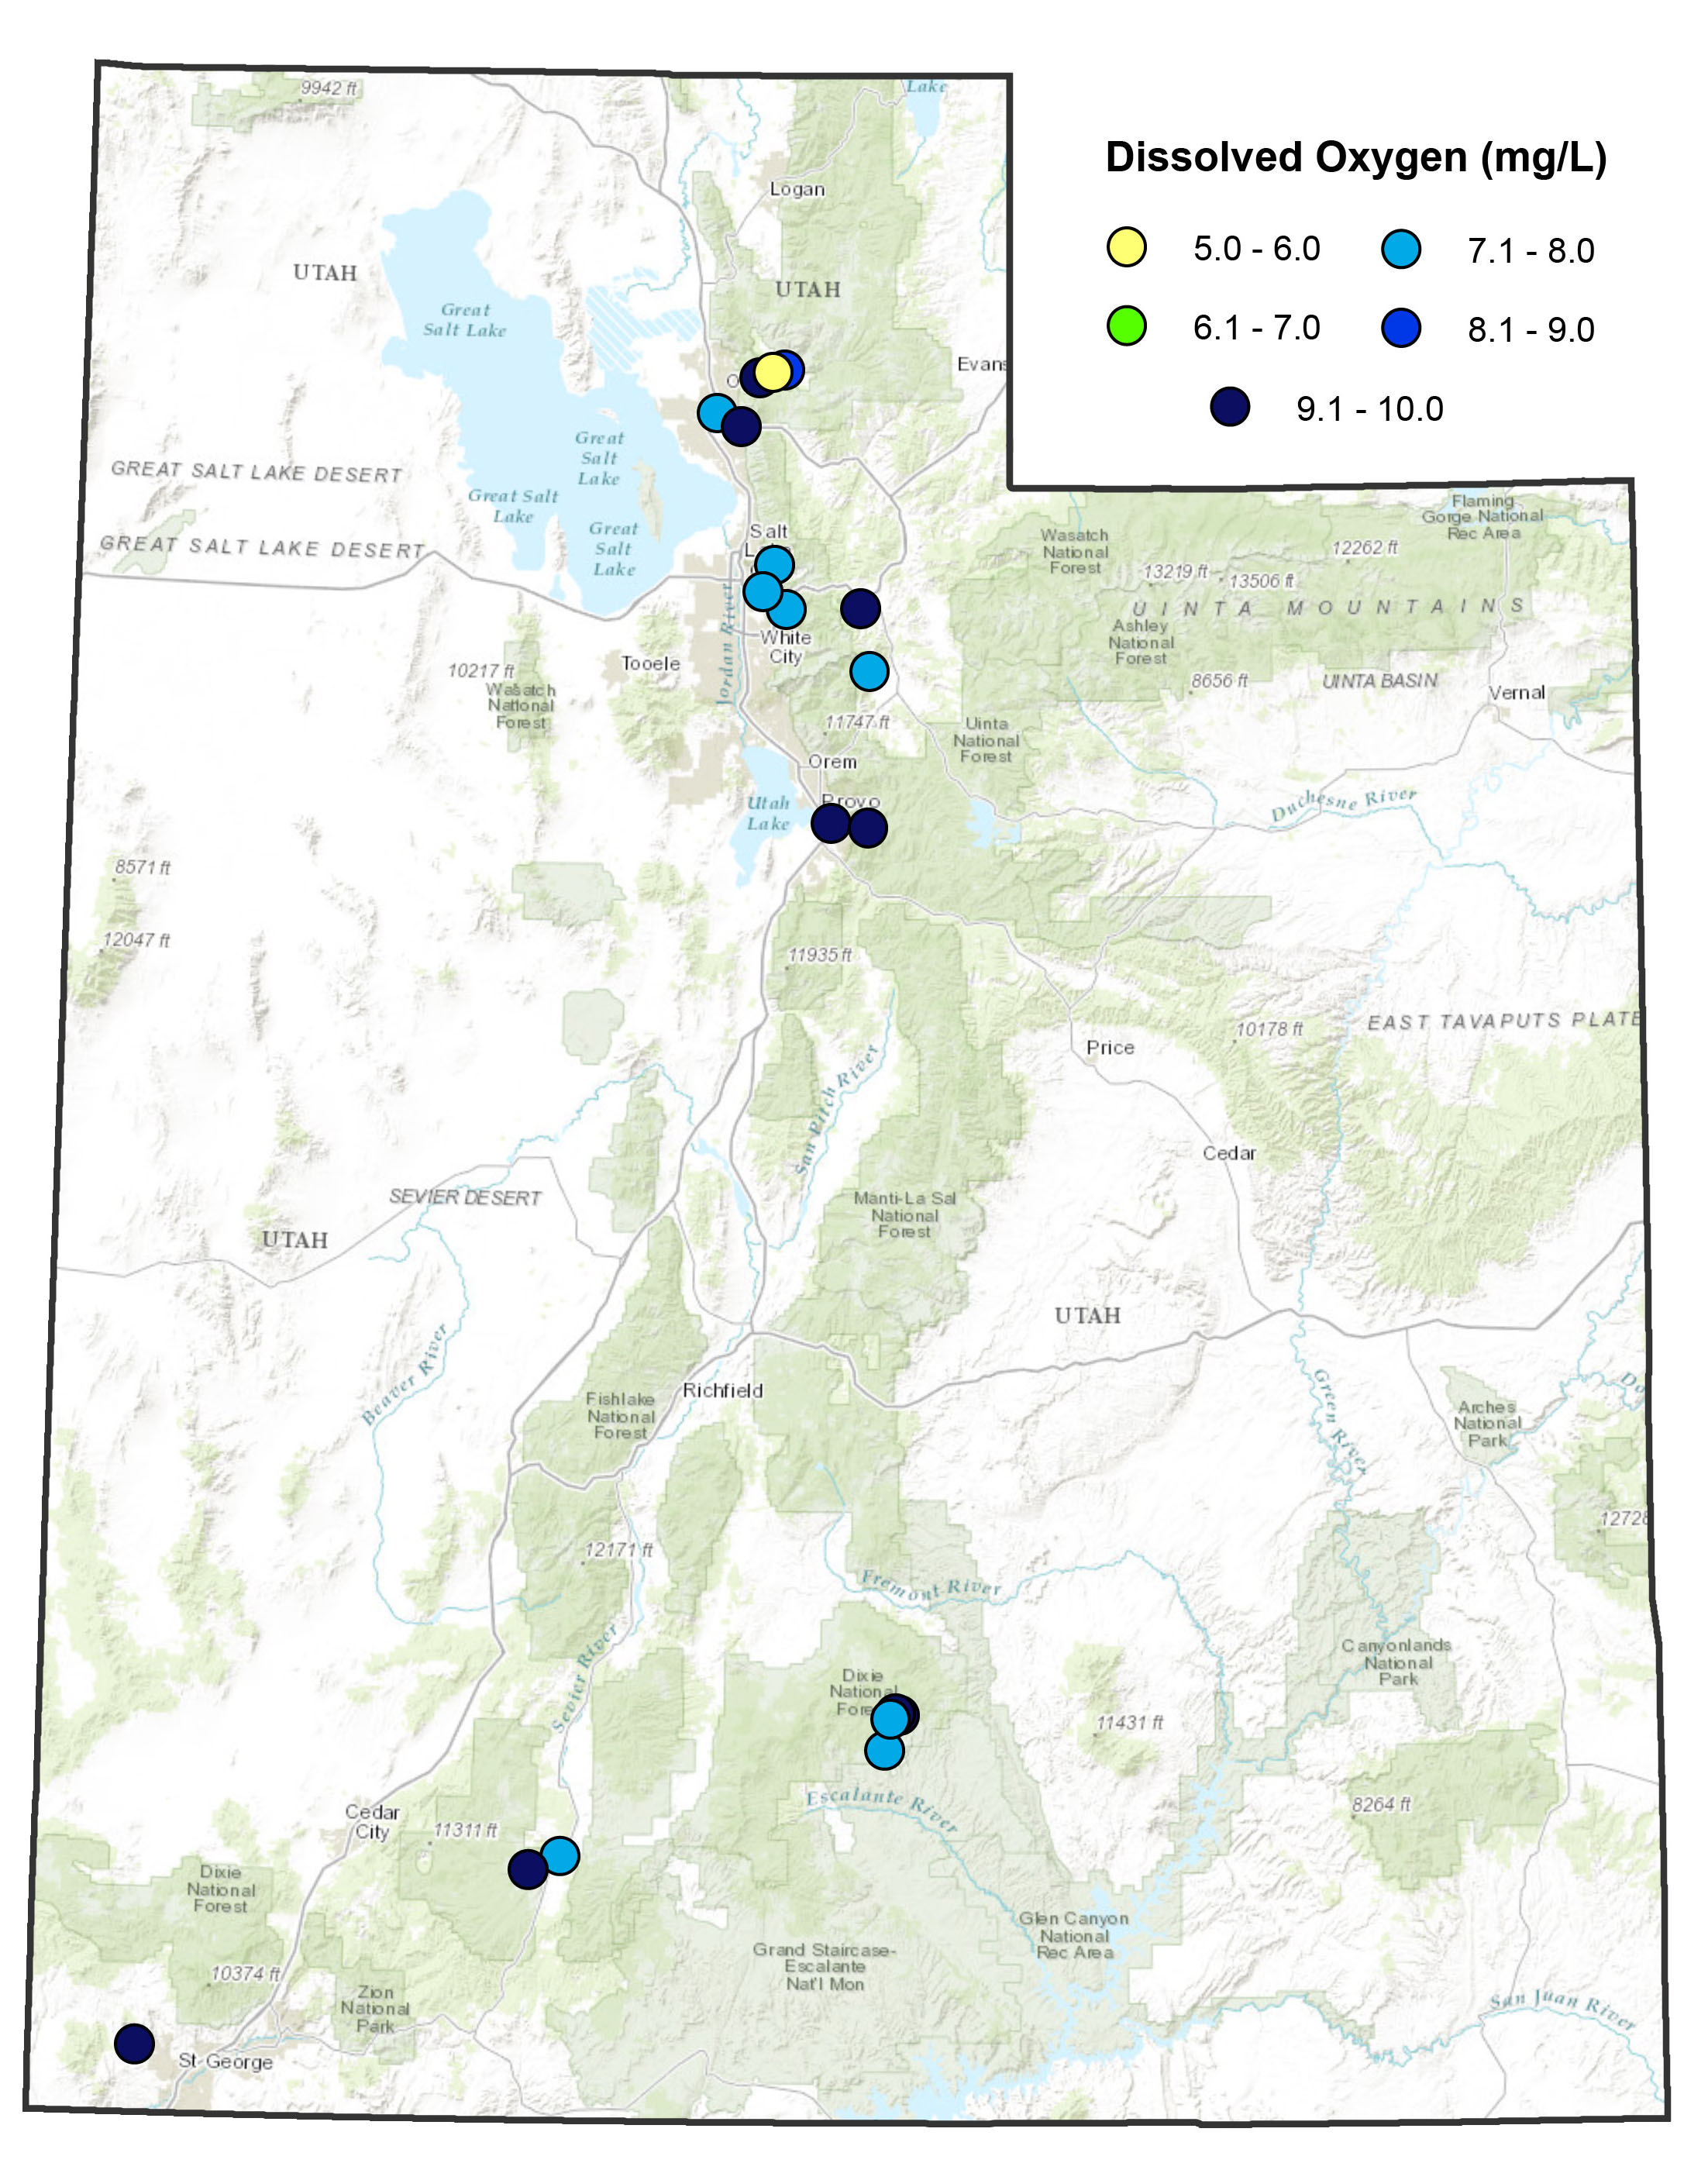
The average for all sites was 8.7 mg / L with a low of 5.0 mg/ L on one location on the Weber River and a high of 10 mg/ L at many locations in Utah. Values lower than ~ 5.0 mg / L can be stressful for certain aquatic organisms.
To learn more visit the dissolved oxygen page.
Turbidity
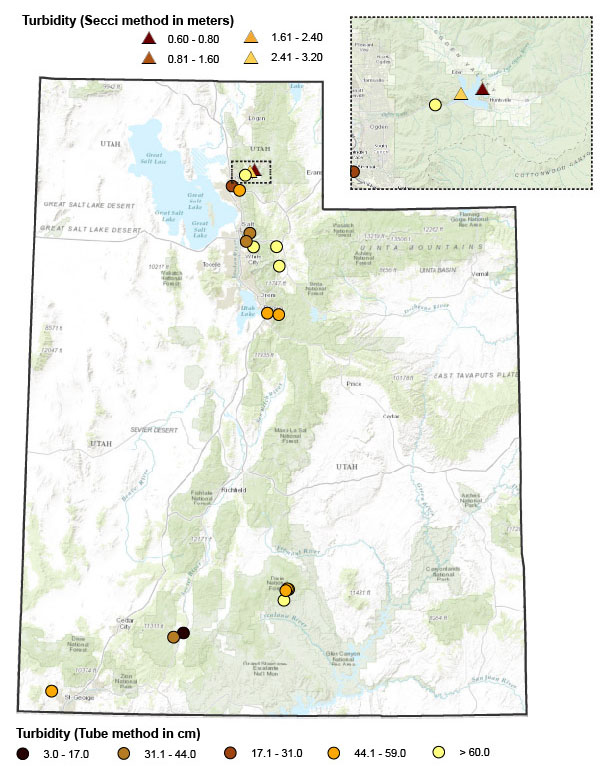 To learn more, visit the turbidity page.
Learn more about Utah Water Week or to see results from other years