2015 Water Week Results

During Utah Water Watch's 2nd Annual Big Water Week (May 3-9) volunteers collected monitoring reports on 29 sites across Utah. This provided a snapshot of Utah's water quality during Utah Water Week. Below are highlights of three key parameters.
Overall the reports indicate that we have good quality, healthy water! The majority of water quality parameters were in their normal ranges and no one observed any large problems or dead fish during the week. Many of the same parameters where very similar to 2014, with water temperature showing the greatest change. This is great news! All this data and more are available on our the database at CitSci.org.
Temperature
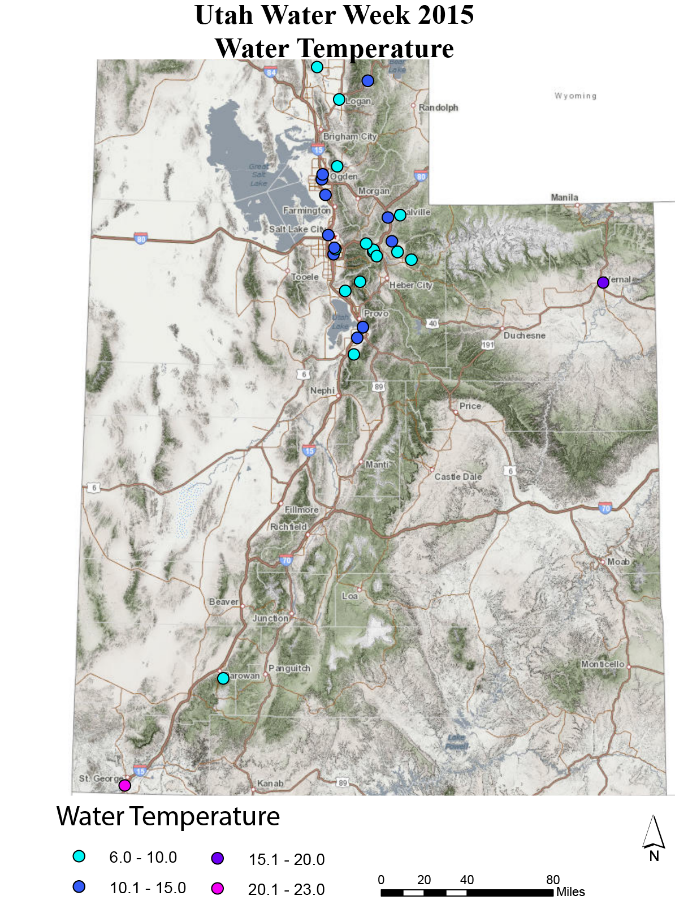
The average for all sites was 10.9 C (1.0 C warmer than last year) with the coldest temperature of 6.0 C at Highland Glen Pond and the warmest temperature of 23 C in the Virgin River (also the highest from 2014). Water temperature in streams should not exceed 20 C for cold water fisheries and 27 C for warm water fisheries.
To learn more go to the Temperature Information page.
Dissolved Oxygen
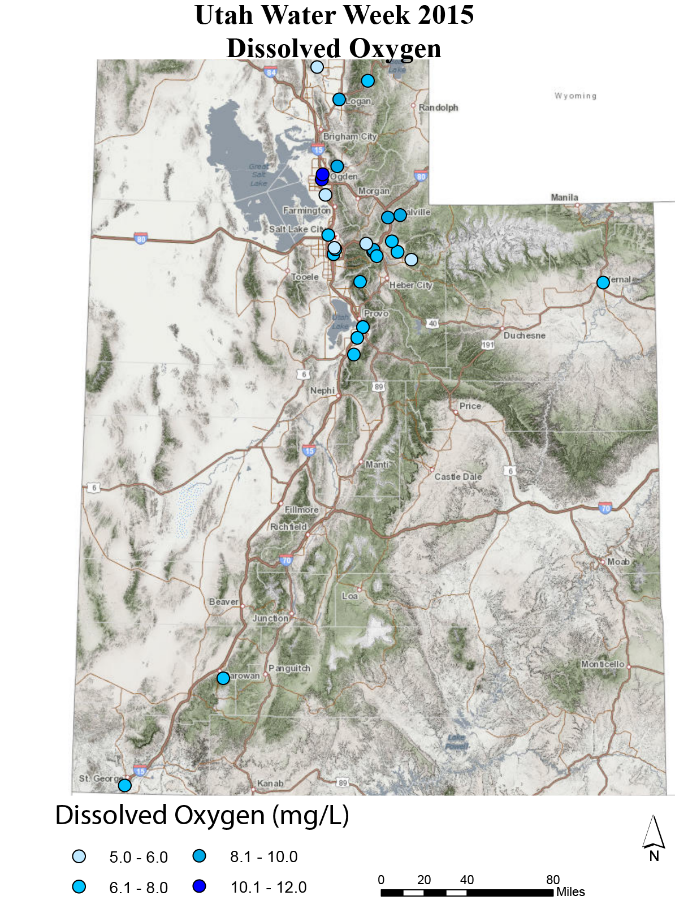
The average for all sites was 7.9 mg / L with a low of 5.0 mg/ L on one location on the Weber River and a high of 12 mg/ L at a different location on the Weber River. Values lower than ~ 5.0 mg / L can be stressful for certain aquatic organisms.
To learn more visit the dissolved oxygen page.
pH
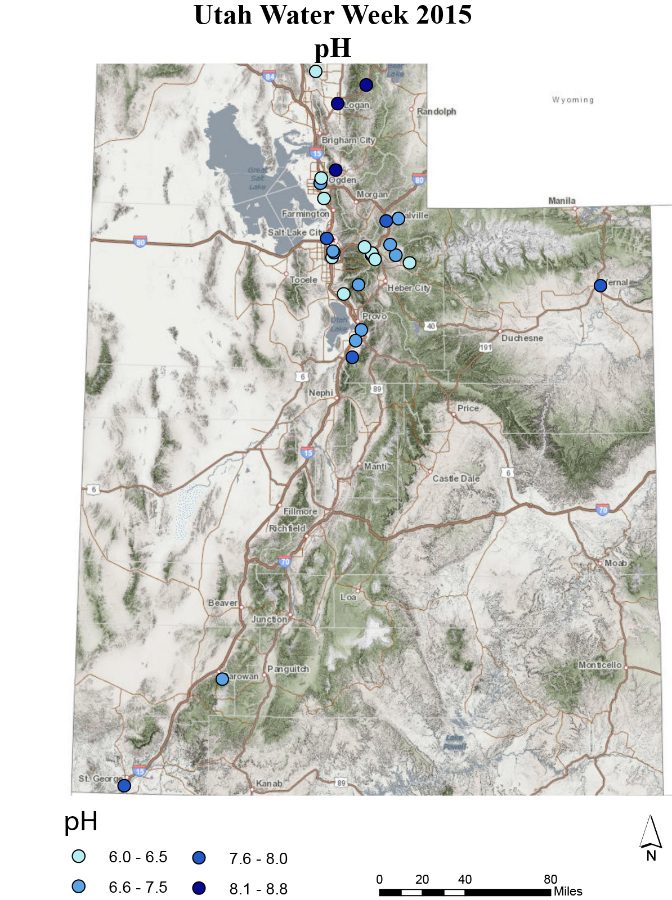
The average for all sites was 7.3 (2014 was 7.2) with a maximum of 8.85 at Temple Fork and a minimum of 6 at three different sites. The healthy range of pH is 6.5-9, so there were only three measurements outside this range.
To learn more visit the pH Information page.
Learn more about Utah Water Week or to see results from other years